• Übersicht
  • Bewertungen
  • Diskussion
  • Neue Funktionen

Market Trending plus Alert by RunwiseFX

Shows whether market is trending or not, to what extent, which direction, and if the trend is increasing. The indicator is very useful for trend following strategies, where it can filter out flat/choppy markets. The indicator can also alert when the market transitions from being flat to trending, which can serve as a great trade entry point. The alert is controllable directly from the chart, via a tick box.

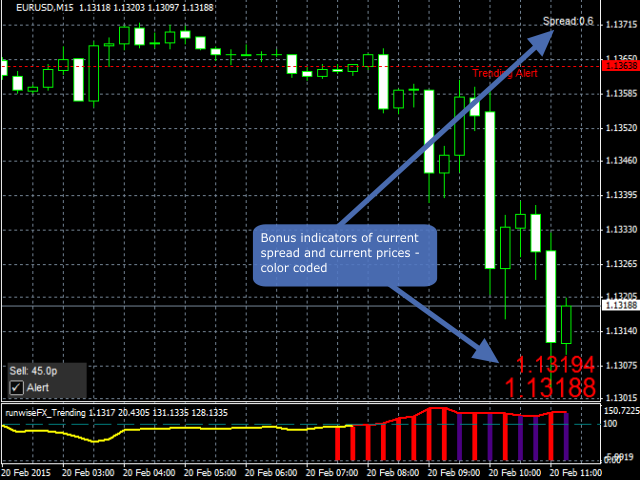
Also, the product includes bonus indicators of the current spread and ask/bid prices in large text, color coded as price changes.


Usage

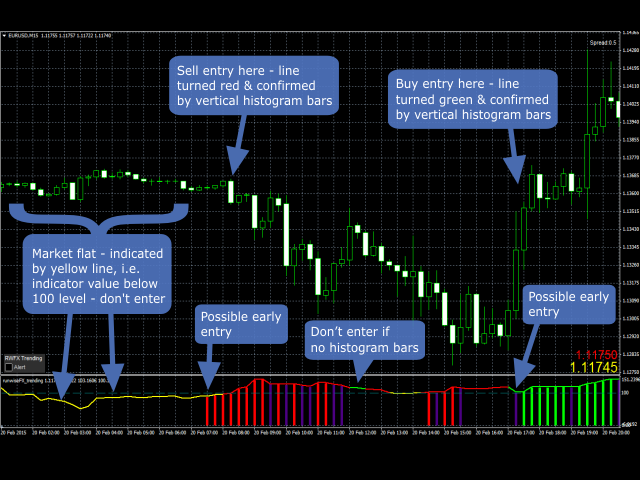
Trade entry should be made when the indicator line is above the 100 level, i.e. not yellow, and the vertical histogram bars are present and of the same color. The histogram bars appear when the direction is confirmed. If purple, then the direction is confirmed but the trend is weakening. Green color signals buy/long and red signals sell/short. Do not open a trade if no histogram bars are present.

Early entry: An early entry could be considered if either the green/red vertical histogram bar is present but the indicator line is still yellow, or the histogram bar is purple but the indicator line is above 100, i.e. colored green/red.

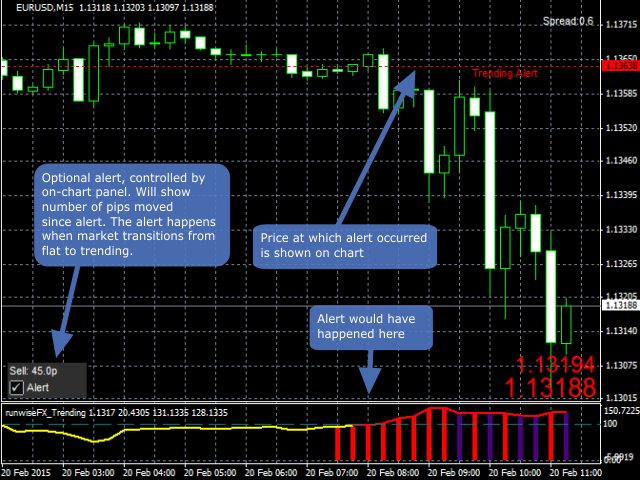
The optional alert is controlled via the chart tick box, by default shown on the bottom left of the chart. The alert will be raised when the market transitions from flat to trending. The number of pips since the alert was raised is shown in the panel. The alert can be set to pop-up, play wav file sound, email or notification.

A bonus spread indicator will show the current spread, which can be configured to change color if the spread has gone too high. Also, current ask/bid prices can be shown in big text. The prices will be colored green if gone up, red if gone down or yellow if stayed the same. The indicators are optional and fully configurable.


Inputs

  • Main_alertOnDefault - set to true for alert to be on by default when indicator is placed onto a chart
  • Main_alertShowPriceLine - if set to true, it will show horizontal price line on chart of the price when an alert is raised
  • Main_alertLineStyle - line style of the above alert price line
  • Main_alertThreshold - indicator value when alert happens. Default is 100 (trending confirmed)
  • Main_histogramThreshold - indicator value when the histogram appears. Default is 90 (trending likely)
  • Col_alertSell - color of alert price line in case of a sell alert
  • Col_alertBuy - color of alert price line in case of a buy alert
  • Box_corner - which corner of the chart to show the alert's control panel. Default is bottom left
  • Box_X - X co-ordinate of where to show the alert's control panel
  • Box_Y - Y co-ordinate of where to show the alert's control panel
  • Gen_GUIFontSize - font size for label on control panel
  • Gen_GUIFont - font name used on control panel
  • Gen_lineLabelFontSize - font size of text label used on horizontal price lines
  • Gen_alertPopUp - if true, then will alert via pop-up window (note, on strategy tester will appear in the Journal)
  • Gen_alertSound - if true, will alert via playing a wav file
  • Gen_alertSoundWavFile - wav file fame, use if Gen_alertSound is set to true
  • Gen_alertMail - if true, then will alert via email, as configured in your MetaTrader terminal
  • Gen_alertNotification - if true, then will alert via push notification, as configured in your MetaTrader terminal
  • Gen_colorLabel - color used for labels in the control panel
  • Gen_colorSell - general color to use for sell
  • Gen_colorBuy - general color to use for buy
  • Gen_colorSellBuy - general color to use when transitioning from buy/sell
  • Gen_askBidPricesShow - if true, when will show ask/bid prices on the chart
  • Gen_askBidPricesCorner - which corner of the chart to show the ask/bid prices
  • Gen_askBidPricesX - X co-ordinate of ask/bid prices
  • Gen_askBidPricesY - Y co-ordinate of ask/bid prices
  • Gen_askBidPricesSizeAsk - font size of ask price
  • Gen_askBidPricesSizeBid - font size of bid price
  • Gen_spreadShow - if true, then will show the current spread
  • Gen_spreadCorner - which corner of the chart to show the spread


Empfohlene Produkte
HMA Trend Professional MT5
Pavel Zamoshnikov
4.25 (4)
Improved version of the free HMA Trend indicator (for MetaTrader 4) with statistical analysis. HMA Trend is a trend indicator based on the Hull Moving Average (HMA) with two periods. HMA with a slow period identifies the trend, while HMA with a fast period determines the short-term movements and signals in the trend direction. The main differences from the free version: Ability to predict the probability of a trend reversal using analysis of history data. Plotting statistical charts for analyzi
Owl Smart Levels MT5
Sergey Ermolov
4.1 (29)
MT4-Version  |  FAQ Der Owl Smart Levels Indikator ist ein komplettes Handelssystem innerhalb eines Indikators, der so beliebte Marktanalysetools wie die fortschrittlichen Fraktale von Bill Williams , Valable ZigZag, das die richtige Wellenstruktur des Marktes aufbaut, und Fibonacci-Levels , die die genauen Einstiegslevels markieren, enthält in den Markt und Orte, um Gewinne mitzunehmen. Detaillierte Strategiebeschreibung Anleitung zur Verwendung des Indikators Berater-Assistent im Handel Owl H
STRICTLY FOR BOOM INDEX ONLY!!!!! Here I bring the Maximum Trend Arrows OT1.0 MT5 indicator. This indicator is made up of a combination of different trend indicators for entries and exits, for entries an orange arrow will paint on the chart below the current market and a red flag for closing of trades and it produces buy arrows only. When the orange arrow appears, it will appear along with it's sound to notify you. The 1H timeframe is recommended, don't use it anywhere else than on the 1H timefr
Noize Absorption Index - is the manual trading system that measures the difference of pressure between bears forces and bulls forces. Green line - is a noize free index that showing curent situation. Zero value of index shows totally choppy/flat market.Values above zero level shows how powerfull bullish wave is and values below zero measures bearish forces.Up arrow appears on bearish market when it's ready to reverse, dn arrow appears on weak bullish market, as a result of reverse expectation.
Volality Index Scalper
Lesedi Oliver Seilane
5 (1)
Volality Index scalper indicator  Meant for Volality pairs such as Volality 10, 25, 50, 75 and 100 The indicator works on all timeframes from the 1 minute to the monthly timeframe the indicator is non repaint the indicator has 3 entry settings 1 color change on zero cross 2 color change on slope change 3 color change on signal line cross Orange line is your sell signal Blue line is your buy signal.
Your Trend Friend
Luigi Nunes Labigalini
5 (1)
The trend is your friend! Look at the color of the indicator and trade on that direction. It does not  repaint. After each candle is closed, that's the color of the trend. You can focus on shorter faster trends or major trends, just test what's most suitable for the symbol and timeframe you trade. Simply change the "Length" parameter and the indicator will automatically adapt. You can also change the color, thickness and style of the lines. Download and give it a try! There are big movements w
Indikator zur Bestimmung von Flat und Trend. Wenn der Preis unter einem der beiden Histogramme und zwei Linien (rot und blau) liegt, ist dies eine Verkaufszone. Beim Kauf dieser Version des Indikators, MT4-Version für ein echtes und ein Demo-Konto - als Geschenk (zum Erhalten, schreiben Sie mir eine private Nachricht)! Wenn der Preis über einem der beiden Histogramme und zwei Linien (rot und blau) liegt, ist dies eine Kaufzone. MT4-Version: https://www.mql5.com/en/market/product/3793 Wenn der P
Was: $249  Now: $149   Market Profile defines a number of day types that can help the trader to determine market behaviour. A key feature is the Value Area, representing the range of price action where 70% of trading took place. Understanding the Value Area can give traders valuable insight into market direction and establish the higher odds trade. It is an excellent addition to any system you may be using. Inspired by Jim Dalton’s book “Mind Over Markets”, this indicator is designed to suit the
Renko Gold
Ignacio Agustin Mene Franco
Renko Gold! clearly indicates the floors and ceilings where it goes from 4 lines, the line below that marks the floor in green confirming with the thinnest line clarifies the purchase entry, the same is for sale, the top line marks the ceiling and the thinnest red line marks the sale, This indicator works for all temporalities! For Forex and Synthetic Indices markets! It also works for crypto markets! Good profit! World Investor.
Premium-Level ist ein einzigartiger Indikator mit mehr als 80% Genauigkeit der richtigen Vorhersagen! Dieser Indikator wurde von den besten Trading-Spezialisten seit mehr als zwei Monaten getestet! Den Indikator des Autors finden Sie nirgendwo anders! Anhand der Screenshots können Sie sich von der Genauigkeit dieses Tools überzeugen! 1 ist ideal für den Handel mit binären Optionen mit einer Ablaufzeit von 1 Kerze. 2 funktioniert bei allen Währungspaaren, Aktien, Rohstoffen, Kryptowährungen
Der DYJ-BoS-Indikator identifiziert und markiert automatisch die wesentlichen Elemente von Marktstrukturverschiebungen, darunter: Ausbruch aus der Struktur (BoS): Wird erkannt, wenn der Preis eine signifikante Bewegung macht und einen vorherigen Strukturpunkt durchbricht. Es markiert mögliche Aufwärtstrendlinien und Abwärtstrendlinien (UP & DN, d. h. kontinuierliche neue Hochs und neue Tiefs), und sobald der Preis diese Linien durchbricht, markiert es rote (BEAR) und grüne (BULL) Pfeile Ein
SolarTrade Suite Finanzindikator: Jupiter Market Indicator – Ihr zuverlässiger Führer in der Welt der Finanzmärkte! Dies ist ein Trendindikator, der spezielle innovative und fortschrittliche Algorithmen zur Berechnung seines Wertes verwendet und zudem ein ansprechendes Design aufweist. Die Messwerte dieses Indikators sind sehr leicht zu verstehen: Blau – Kaufen, Rot – Verkaufen. Sehen Sie sich unsere anderen Produkte aus der SolarTrade Suite-Reihe am Ende der Beschreibung an. Möchten Sie si
Trend Monitor MT5
Pavel Zamoshnikov
4.5 (2)
The indicator generates early signals basing on ADX reading data combined with elements of price patterns. Works on all symbols and timeframes. The indicator does not redraw its signals. You see the same things on history and in real time. For better visual perception signals are displayed as arrows (in order not to overload the chart). Features The best results are obtained when the indicator works on two timeframes. For example: M30 – the indicator shows the main trend; M5 – the indicator gen
The Riko Trend indicator is a revolutionary trend trading and filtering solution with all the important features of a trend tool built into one tool! The Riko Trend indicator is good for any trader, suitable for any trader for both forex and binary options. You don’t need to configure anything, everything is perfected by time and experience, it works great during a flat and in a trend. The Riko Trend indicator is a technical analysis tool for financial markets that reflects the current price f
Trade history
Andriy Konovalov
5 (2)
The indicator plots charts of profit taken at the Close of candles for closed (or partially closed) long and short positions individually. The indicator allows to filter deals by the current symbol, specified expert ID (magic number) and the presence (absence) of a substring in a deal comment, to set the start time and the periodicity of profit reset (daily, weekly or monthly) to calculate the profit chart. The indicator also displays the floating (not fixed) profit of the opened positions at th
PipFinite Trend PRO MT5
Karlo Wilson Vendiola
4.84 (551)
Breakthrough Solution For Trend Trading And Filtering With All Important Features Built Inside One Tool! Trend PRO's smart algorithm detects the trend, filters out market noise and gives entry signals with exit levels. The new features with enhanced rules for statistical calculation improved the overall performance of this indicator. Important Information Revealed Maximize the potential of Trend Pro, please visit www.mql5.com/en/blogs/post/713938 The Powerful Expert Advisor Version Automatin
To get access to MT4 version please click here . - This is the exact conversion from TradingView: "Stochastic Momentum Index" By "UCSgears". - This is a popular version of stochastic oscillator on tradingview. - This is a light-load processing and non-repaint indicator. - Buffers are available for the lines on chart. - You can message in private chat for further changes you need. Thanks for downloading
This indicator is used to compare the relative strength of the trade on the chart against the other several selected symbols. By comparing the price movement of each traded variety based on the same base day, several trend lines of different directions can be seen, reflecting the strong and weak relationship between the several different traded varieties, so that we can have a clearer understanding of the market trend. For example, you can apply this indicator on a EurUSD chart and compare it w
Atomic Analyst MT5
Issam Kassas
4.32 (19)
Zunächst einmal ist es erwähnenswert, dass dieser Handelsindikator nicht neu malt, nicht neu zeichnet und keine Verzögerung aufweist, was ihn sowohl für manuellen als auch für Roboterhandel ideal macht. Benutzerhandbuch: Einstellungen, Eingaben und Strategie. Der Atom-Analyst ist ein PA-Preisaktionsindikator, der die Stärke und das Momentum des Preises nutzt, um einen besseren Vorteil auf dem Markt zu finden. Ausgestattet mit fortschrittlichen Filtern, die helfen, Rauschen und falsche Signale z
Rainbow EA MT5
Jamal El Alama
Description : Rainbow EA MT5 is a simple Expert advisor based on   Rainbow MT5 indicator witch is based on Moving average with period 34. The indicator is incorporated in the EA, therefore, it is not required for the EA to operate, but if you wish, you can download it from   my product page . The Expert Advisor settings are as follows : Suitable for Timeframes up to H1 The parameters below can be set according to your trading rules. StopLoss ( Stop Loss in pips) TakeProfit ( Take Profit in pips
How to use Pair Trading Station Pair Trading Station is recommended for H1 time frame and you can use it for any currency pairs. To generate buy and sell signal, follow few steps below to apply Pair Trading Station to your MetaTrader terminal. When you load Pair Trading Station on your chart, Pair Trading station will assess available historical data in your MetaTrader platforms for each currency pair. On your chart, the amount of historical data available will be displayed for each currency pai
Provided Trend is a complex signal formation indicator. As a result of the work of internal algorithms, you can see only three types of signals on your chart. The first is a buy signal, the second is a sell signal, and the third is a market exit signal. Options: CalcFlatSlow - The first parameter that controls the main function of splitting the price chart into waves. CalcFlatFast - The second parameter that controls the main function of splitting the price chart into waves. CalcFlatAvg - Para
ATrend
Zaha Feiz
4.77 (13)
ATREND: How It Works and How to Use It How It Works The " ATREND " indicator for the MT5 platform is designed to provide traders with robust buy and sell signals by utilizing a combination of technical analysis methodologies. This indicator primarily leverages the Average True Range (ATR) for volatility measurement, alongside trend detection algorithms to identify potential market movements. Leave a massage after purchase and receive a special bonus gift. Key Features: ⦁ Dynamic Trend Detect
The Antique Trend Indicator is a revolutionary trend trading and filtering solution with all the important features of a trend tool built into one tool! The Antique Trend indicator is good for any trader, suitable for any trader both for Forex and binary options. There is no need to configure anything, everything has been perfected by time and experience, it works great during flats and trends. The Antique Trend indicator is a tool for technical analysis of financial markets, reflecting curren
Fibo Channels
Jeffrey Quiatchon
Fibo Daily Channel Indicator The  Indicator is a powerful tool for traders, providing precise daily support and resistance levels based on Fibonacci retracement and extension calculations. This indicator automatically draws key pivot points (PP, R1, R2, S1, S2) as well as additional extension levels (R3, R4, S3, S4), helping traders identify potential reversal and breakout zones with ease. It includes customizable alerts and push notifications, allowing traders to receive updates whenever the pr
Banana Binary MT5 Signal
Nirundorn Promphao
1 (1)
Promotion $66 lifetime for you. The principle of this indicator is very simple: detecting the trend with Moving Average, then monitoring the return point of graph by using the crossing of Stochastic Oscillator and finally predicting BUY and SELL signal with arrows, alerts and notifications. The parameters are fixed and automatically calculated on each time frame. Example: If you install indicator on EURUSD, timeframe M5: the indicator will detect the main trend with the Moving Average on this ti
Visual Titan Force Indicator
AL MOOSAWI ABDULLAH JAFFER BAQER
Unleash Market Volatility with the Titan Force Indicator! Are you ready to dominate the market by capitalizing on volatility? The Titan Force Indicator is your ultimate trading tool, designed for traders who thrive during periods of heightened market activity. Not Optimized for You – Yet! This indicator is a canvas for your creativity. It's been crafted to let you optimize it according to your unique trading strategies and preferences. Your skills, your edge! How Does the Titan Force
Cumulative delta indicator As most traders believe, the price moves under the pressure of market buying or selling. When someone redeems an offer standing in the cup, the deal is a "buy". If someone pours into the bid standing in the cup - the deal goes with the direction of "sale". The delta is the difference between purchases and sales. A cumulative delta - the difference between the cumulative sum of purchases and sales for a certain period of time. It allows you to see who is currently contr
To download MT4 version please click here . This is the exact conversion from TradingView: "WaveTrend [LazyBear]" By "zeusuk3". One of the coolest indicators out there to detect overbought and oversold zones. It can be used as a part of more complicated strategy and for confirming a potential trade setup. There are buffers to use in EAs also. The indicator is loaded light and non-repaint. - You can message in private chat for further changes you need. Thanks for downloading 
Double HMA MTF for MT5
Pavel Zamoshnikov
4 (4)
This is an advanced multi-timeframe version of the popular Hull Moving Average (HMA) Features Two lines of the Hull indicator of different timeframes on the same chart. The HMA line of the higher timeframe defines the trend, and the HMA line of the current timeframe defines the short-term price movements. A graphical panel with HMA indicator data from all timeframes at the same time . If the HMA switched its direction on any timeframe, the panel displays a question or exclamation mark with a tex
Käufer dieses Produkts erwarben auch
Trend Screener Pro MT5
STE S.S.COMPANY
4.89 (72)
Nutzen Sie die Macht des Trendhandels mit Trend Screener Indicator: Ihrer ultimativen Trendhandelslösung, die auf Fuzzy-Logik und einem System mit mehreren Währungen basiert! Steigern Sie Ihren Trendhandel mit Trend Screener, dem revolutionären Trendindikator mit Fuzzy-Logik. Es handelt sich um einen leistungsstarken Trendfolgeindikator, der über 13 Premium-Tools und -Funktionen sowie 3 Handelsstrategien kombiniert und ihn zu einer vielseitigen Wahl macht, um Ihren Metatrader in einen Trendanaly
FX Volume MT5
Daniel Stein
4.72 (18)
FX Volume: Erleben Sie den echten Marktüberblick aus der Sicht eines Brokers Kurzüberblick Möchten Sie Ihre Handelsstrategie auf das nächste Level bringen? FX Volume liefert Ihnen Echtzeit-Einblicke in die Positionierung von Retail-Tradern und Brokern — lange bevor verzögerte Berichte wie der COT verfügbar sind. Ob Sie nach beständigen Gewinnen streben oder einfach einen tieferen Vorteil am Markt suchen, FX Volume hilft Ihnen, große Ungleichgewichte zu erkennen, Breakouts zu bestätigen und Ihr
Golden Trend Indicator MT5
Noha Mohamed Fathy Younes Badr
4.86 (14)
Golden Trend indicator  is The best indicator for predicting trend movement this indicator never lags and never repaints and never back paints    and give  arrow buy and sell    before the candle appear  and it will help you and  will make your trading decisions clearer its work on all currencies and  gold and crypto and all time frame This unique  indicator uses very secret algorithms to catch the  trends, so you can trade using this indicator and see the trend clear on charts  manual guide and
FX Power MT5 NG
Daniel Stein
5 (10)
FX Power: Analysieren Sie die Stärke von Währungen für intelligentere Handelsentscheidungen Übersicht FX Power ist Ihr unverzichtbares Werkzeug, um die tatsächliche Stärke von Währungen und Gold unter allen Marktbedingungen zu verstehen. Indem Sie starke Währungen kaufen und schwache verkaufen, vereinfacht FX Power Ihre Handelsentscheidungen und deckt Chancen mit hoher Wahrscheinlichkeit auf. Ob Sie Trends folgen oder extreme Delta-Werte nutzen, um Umkehrungen zu prognostizieren, dieses Tool p
IX Power MT5
Daniel Stein
4.83 (6)
IX Power: Markteinblicke für Indizes, Rohstoffe, Kryptowährungen und Forex Überblick IX Power ist ein vielseitiges Tool zur Analyse der Stärke von Indizes, Rohstoffen, Kryptowährungen und Forex-Symbolen. Während FX Power die höchste Präzision für Währungspaare bietet, indem es alle verfügbaren Paardaten einbezieht, konzentriert sich IX Power ausschließlich auf die Marktdaten des zugrunde liegenden Symbols. Dies macht IX Power zu einer hervorragenden Wahl für Nicht-Forex-Märkte und zu einem zuv
FX Levels MT5
Daniel Stein
5 (2)
FX Levels: Außerordentlich präzise Unterstützungs- und Widerstandszonen für alle Märkte Kurzüberblick Suchen Sie eine verlässliche Methode, um Support- und Resistance-Level in jedem Markt zu identifizieren—egal ob Währungspaare, Indizes, Aktien oder Rohstoffe? FX Levels vereint die traditionelle „Lighthouse“-Methode mit einem modernen dynamischen Ansatz und bietet nahezu universelle Genauigkeit. Durch unsere Erfahrung mit echten Brokern sowie automatischen täglichen und Echtzeit-Updates hilft
TPSpro RFI Levels MT5
Roman Podpora
4.53 (19)
ANWEISUNGEN       Russland       -        ENG    Die Empfehlung basiert auf dem Indikator -   TPSpro   TREND PRO -   Version MT5 Die wichtigsten Elemente in der Branche sind entweder in Zonen oder in der Fabrik enthalten, oder sie führen zu einer Lösung bei einem Kauf oder dem Verkauf eines anderen Instruments. Wenn viele Menschen ihre Rechte nicht auf dem Händlerkonto verschlüsseln, werden die Folgen nicht schnell genug sein. Ich habe es damit abgeschlossen, dass ich diese Folgen nun noch inter
TPSproTREND PrO MT5
Roman Podpora
4.47 (17)
TPSpro TREND PRO   ist ein Trendindikator, der den Markt automatisch analysiert und Informationen über den Trend und jede seiner Änderungen liefert sowie Signale für den Einstieg in Geschäfte ohne Neuzeichnung gibt! Der Indikator verwendet jede Kerze und analysiert sie separat. bezieht sich auf verschiedene Impulse – Aufwärts- oder Abwärtsimpuls. Exakte Einstiegspunkte in Transaktionen für Währungen, Krypto, Metalle, Aktien, Indizes! Version MT5                   VOLLSTÄNDIGE BESCHREIBUNG DES IN
Quantum TrendPulse
Bogdan Ion Puscasu
5 (12)
Wir stellen   Quantum TrendPulse   vor, das ultimative Handelstool, das die Leistung von   SuperTrend   ,   RSI   und   Stochastic   in einem umfassenden Indikator vereint, um Ihr Handelspotenzial zu maximieren. Dieser Indikator wurde für Händler entwickelt, die Präzision und Effizienz suchen, und hilft Ihnen dabei, Markttrends, Momentumverschiebungen und optimale Ein- und Ausstiegspunkte sicher zu erkennen. Hauptmerkmale: SuperTrend-Integration:   Folgen Sie problemlos dem vorherrschenden Markt
Support And Resistance Screener ist ein Level-Indikator für MetaTrader, der mehrere Tools innerhalb eines Indikators bietet. Die verfügbaren Werkzeuge sind: 1. Marktstruktur-Screener. 2. Bullische Pullback-Zone. 3. Bärische Pullback-Zone. 4. Tägliche Pivot-Punkte 5. wöchentliche Pivots-Punkte 6. monatliche Pivots-Punkte 7. Starke Unterstützung und Widerstand basierend auf harmonischem Muster und Volumen. 8. Zonen auf Bankebene. ZEITLICH BEGRENZTES ANGEBOT: HV Support and Resistance Indicator ist
RelicusRoad Pro MT5
Relicus LLC
4.78 (18)
Jetzt 147 US -Dollar (nach ein paar Aktualisierungen auf 499 US -Dollar) - Unbegrenzte Konten (PCs oder MACs) RelicusRoad Benutzerhandbuch + Schulungsvideos + Zugang zur privaten Discord-Gruppe + VIP-Status EINE NEUE ART, DEN MARKT ZU BETRACHTEN RelicusRoad ist der weltweit leistungsstärkste Handelsindikator für Forex, Futures, Kryptowährungen, Aktien und Indizes und gibt Händlern alle Informationen und Tools, die sie benötigen, um profitabel zu bleiben. Wir bieten technische Analysen und Ha
Gold Stuff mt5
Vasiliy Strukov
4.92 (173)
Gold Stuff mt5-Ein Trendindikator, der speziell für Gold entwickelt wurde, kann auch auf allen Finanzinstrumenten verwendet werden. Der Indikator wird nicht neu gezeichnet und verzögert sich nicht. Empfohlener Zeitrahmen H1. WICHTIG! Kontaktieren Sie mich sofort nach dem Kauf, um Anweisungen und Bonus zu erhalten!     Sie können eine kostenlose Kopie unseres Strong Support- und Trendscanner-Indikators erhalten, bitte senden Sie uns eine persönliche Nachricht. Mich! DATEN Draw Arrow - inkl.a
Bill Williams Advanced
Siarhei Vashchylka
5 (10)
Bill Williams Advanced is designed for automatic chart analysis using Bill Williams' "Profitunity" system. The indicator analyzes four timeframes at once. Manual (Be sure to read before purchasing) Advantages 1. Automatically analyzes the chart using the "Profitunity" system of Bill Williams. The found signals are placed in a table in the corner of the screen. 2. Equipped with a trend filter based on the Alligator indicator. Most of the system signals are recommended to be used only according t
Dieses Dashboard zeigt die   neuesten verfügbaren harmonischen   Muster für die ausgewählten Symbole, so dass Sie Zeit sparen und effizienter sein werden /   MT4-Version . Kostenloser Indikator:   Basic Harmonic Pattern Spalten des Indikators Symbol:   die ausgewählten Symbole werden angezeigt Trend:   bullish oder bearish Pattern :   Art des Musters (Gartley, Schmetterling, Fledermaus, Krabbe, Hai, Cypher oder ABCD) Entry :   Einstiegskurs SL:   Stop-Loss-Kurs TP1:   1. Take-Profit-Kurs TP2
Matrix Arrow Indicator MT5
Juvenille Emperor Limited
5 (13)
Matrix Arrow Indicator MT5   ist ein einzigartiger 10-in-1-Trend, der zu   100 % nicht neu gezeichnet   werden kann. Multi-Timeframe-Indikator, der für alle Symbole/Instrumente verwendet werden kann:   Forex ,   Rohstoffe ,   Kryptowährungen ,   Indizes ,   Aktien .  Der  Matrix Arrow Indicator MT5  wird den aktuellen Trend in seinen frühen Stadien bestimmen und Informationen und Daten von bis zu 10 Standardindikatoren sammeln, die sind: Durchschnittlicher Richtungsbewegungsindex (ADX) Rohstoff
Zunächst einmal ist es wichtig zu betonen, dass dieses Handelstool ein Nicht-Repaint-, Nicht-Redraw- und Nicht-Verzögerungsindikator ist, was es ideal für professionelles Trading macht. Online-Kurs, Benutzerhandbuch und Demo. Der Smart Price Action Concepts Indikator ist ein sehr leistungsstarkes Werkzeug sowohl für neue als auch erfahrene Händler. Er vereint mehr als 20 nützliche Indikatoren in einem und kombiniert fortgeschrittene Handelsideen wie die Analyse des Inner Circle Traders und Str
FX Dynamic: Volatilität und Trends mit anpassbarer ATR-Analyse im Blick Übersicht FX Dynamic ist ein leistungsstarkes Tool, das die Berechnungen des Average True Range (ATR) nutzt, um Tradern unübertroffene Einblicke in die tägliche und intraday-Volatilität zu geben. Durch das Festlegen klarer Volatilitätsschwellen — beispielsweise 80%, 100% und 130% — kannst du schnell potenzielle Gewinnchancen erkennen oder Warnungen erhalten, wenn der Markt seine üblichen Spannen überschreitet. FX Dynamic p
Wir stellen vor       Quantum Breakout PRO   , der bahnbrechende MQL5-Indikator, der die Art und Weise, wie Sie mit Breakout-Zonen handeln, verändert! Entwickelt von einem Team erfahrener Händler mit über 13 Jahren Handelserfahrung,       Quantum Breakout PRO       ist darauf ausgelegt, Ihre Handelsreise mit seiner innovativen und dynamischen Breakout-Zone-Strategie auf ein neues Niveau zu heben. Der Quantum Breakout Indicator zeigt Ihnen Signalpfeile auf Breakout-Zonen mit 5 Gewinnzielzonen u
Dies ist ein Indikator für MT5, der genaue Signale für den Einstieg in einen Handel ohne Repainting (Neuzeichnen) liefert. Er kann auf alle Finanzwerte angewendet werden: Forex, Kryptowährungen, Metalle, Aktien, Indizes. Er liefert ziemlich genaue Schätzungen und sagt Ihnen, wann es am besten ist, eine Position zu eröffnen und zu schließen. Sehen Sie sich das Video (6:22) mit einem Beispiel für die Verarbeitung nur eines Signals an, das sich für den Indikator gelohnt hat! Die meisten Händler ver
Zunächst einmal ist es wichtig zu betonen, dass dieses Handelssystem ein Nicht-Repainting-, Nicht-Redrawing- und Nicht-Verzögerungsindikator ist, was es sowohl für manuelles als auch für automatisches Trading ideal macht. Online-Kurs, Handbuch und Vorlagen herunterladen. Das "Smart Trend Trading System MT5" ist eine umfassende Handelslösung, die für neue und erfahrene Trader maßgeschneidert ist. Es kombiniert über 10 Premium-Indikatoren und bietet mehr als 7 robuste Handelsstrategien, was es zu
Easy Breakout MT5
Mohamed Hassan
5 (3)
After your purchase, feel free to contact me for more details on how to receive a bonus indicator called VFI, which pairs perfectly with Easy Breakout for enhanced confluence!     Easy Breakout MT5   is a powerful price action trading system built on one of the most popular and widely trusted strategies among traders: the   Breakout strategy ! This indicator delivers crystal-clear Buy and Sell signals based on breakouts from key support and resistance zones. Unlike typical breakout indicators
Gartley Hunter Multi
Siarhei Vashchylka
5 (10)
Gartley Hunter Multi - An indicator for searching for harmonic patterns simultaneously on dozens of trading instruments and on all possible timeframes. Manual (Be sure to read before purchasing) | Version for MT4 Advantages 1. Patterns: Gartley, Butterfly, Shark, Crab. Bat, Alternate Bat, Deep Crab, Cypher 2. Simultaneous search for patterns on dozens of trading instruments and on all possible timeframes 3. Search for patterns of all possible sizes. From the smallest to the largest 4. All fou
Trend Line Map Pro MT5
STE S.S.COMPANY
4.09 (11)
Trend Line Map Indicator ist ein Add-On für Trend Screener Indicator. Es arbeitet als Scanner für alle Signale, die vom Trendscreener (Trendliniensignale) erzeugt werden. Es ist ein Trend Line Scanner basierend auf dem Trend Screener Indicator. Wenn Sie keinen Trend Screener Pro Indicator haben, funktioniert die Trend Line Map Pro nicht. It's a Trend Line Scanner based on Trend Screener Indicator. If you don't have Trend Screener Pro Indicator,     the Trend Line Map Pro will not work . Wen
Dies ist wahrscheinlich der vollständigste Indikator für die automatische Erkennung der harmonischen Preisbildung, den Sie für die MetaTrader-Plattform finden können. Es erkennt 19 verschiedene Muster, nimmt Fibonacci-Projektionen genauso ernst wie Sie, zeigt die potenzielle Umkehrzone (PRZ) an und findet geeignete Stop-Loss- und Take-Profit-Werte. [ Installationsanleitung | Update-Anleitung | Fehlerbehebung | FAQ | Alle Produkte ] Es erkennt 19 verschiedene harmonische Preisbildungen Darges
Dieses Dashboard entdeckt und zeigt die   Angebots- und Nachfragezonen   auf dem Chart an, sowohl im Scalping- als auch im Long-Term-Modus, je nach Ihrer Handelsstrategie für die ausgewählten Symbole. Darüber hinaus hilft Ihnen der Scanner-Modus des Dashboards, alle gewünschten Symbole auf einen Blick zu überprüfen und keine geeigneten Positionen zu verpassen /   MT4-Version Kostenloser Indikator:   Basic Supply Demand Merkmale Ermöglicht Ihnen die Anzeige von Handelsmöglichkeiten für   mehrere
QM Pattern Scanner MT5
Reza Aghajanpour
5 (3)
Contact me  to send you instruction and add you in group. QM (Quasimodo) Pattern is based on Read The Market(RTM) concepts. The purpose of this model is to face the big players of the market (financial institutions and banks), As you know in financial markets, big traders try to fool small traders, but RTM prevent traders from getting trapped. This style is formed in terms of price candles and presented according to market supply and demand areas and no price oscillator is used in it. RTM conc
Auto Order Block with break of structure based on ICT and Smart Money Concepts (SMC) Futures Break of Structure ( BoS )             Order block ( OB )            Higher time frame Order block / Point of Interest ( POI )    shown on current chart           Fair value Gap ( FVG ) / Imbalance   -  MTF      ( Multi Time Frame )    HH/LL/HL/LH  -  MTF      ( Multi Time Frame )  Choch  MTF      ( Multi Time Frame )  Volume Imbalance     ,  MTF          vIMB Gap’s Power of 3 Equal High / Low’s  
Dark Absolute Trend   is an Indicator for intraday trading. This Indicator is based on   Trend Following  strategy but use also candlestick patterns and Volatility. We can enter in good price with this Indicator, in order to follow the main trend on the current instrument. It is advised to use low spread ECN brokers. This Indicator does   Not repaint   and   N ot lag . Recommended timeframes are M5, M15 and H1. Recommended working pairs: All. I nstallation and  Update Guide   -  Troubleshooting
CONTACT US  after purchase to get the Indicator Manual. Try Now—Limited 50% Discount for First 10 Buyers! Download the  Metatrader 4 Version Due to regulatory restrictions, our service is unavailable in certain countries such as India, Pakistan, and Bangladesh. William Delbert Gann (W.D. Gann) was an exceptional market analyst, whose trading technique was based on a complex blend of mathematics, geometry, astrology, and ancient mathematics which proved to be extremely accurate. A Note from t
Suleiman Levels
Suleiman Alhawamdah
5 (1)
Wichtiger Hinweis: Das in den Screenshots gezeigte Bild zeigt meine 2 Indikatoren, den „Suleiman Levels“-Indikator und den „RSI Trend V“-Indikator. Ich empfahl, es zusammen mit dem „RSI Trend V1“-Indikator zu verwenden, insbesondere um die farbige Wolke zu bestätigen und abzugleichen sowie für Pfeilsignale, zusätzlich zur Bedeutung des Fibonacci-Indikators und seiner angehängten herausragenden Ebenen : https://www.mql5.com/en/market/product/132080 Der „Suleiman Levels“-Indikator ist ein fortsch
Weitere Produkte dieses Autors
The first currency based indicator to draw a distinction between map and strength. The map shows the currencies in terms of oversold/overbought levels and gives the direction of travel. The currency strength calculates and shows the strength of that move. Alerts are included for changes in currency direction on the map (confirmed over two bars) and also when the strength reached the appropriate level.  The currency map is useful for finding currency pairs to trade and in which direction. Look fo
Fully functional manual trade panel with lot size calculation, one-click trading, hidden (virtual) stop loss/take profit and pending orders, scale in and out of trades (partial close), auto SL/TP and more. Works with all symbols not just currency pairs. Brings an incredible amount of functionality to MetaTrader for free and for both demo and live accounts. Features Lot size calculation - based on % of account to risk, fixed amount or dynamic lots Automatic take profit based on risk reward ratio
FREE
Comprehensive on chart trade panel with the unique ability to be controllable from mobile as well. Plus has a library of downloadable configuration, e.g. exit rules, extra panel buttons, pending order setup and more. Please see our product video. Works with all symbols not just currency pairs. Features On chart panel plus controllable from free app for Windows, iPhone and Android Built-in script engine with library of downloadable configuration, e.g. add 'Close All Trades in Profit' button, exit
The indicator displays a matrix of indicators across multiple timeframes with a sum total and optional alert. Custom indicators can also be added to the matrix, in a highly configurable way. The alert threshold can be set to say what percentage of indicators need to be in agreement for an alert to happen. The alerts can turned on/off via on chart tick boxes and can be set to notify to mobile or sent to email, in addition to pop-up. The product offers a great way to create an alert when multiple
Trade Panel Pro by RunwiseFX
Runwise Limited
4.88 (32)
Fully functional manual trade panel with risk/reward, auto SL, lot size calculation, one-click trading, hidden (virtual) stop loss/take profit and pending orders, scale in and out of trades (partial close), news events and more. Works with all symbols not just currency pairs. Brings an incredible amount of functionality to MetaTrader for free and for both demo and live accounts. Features Lot size calculation - based on % of account to risk, fixed amount or dynamic lots Automatic take profit base
FREE
Allows symbols/currency pairs to be ordered based on a configured indicator, with the best performing symbols shown at the top. This helps you to select the symbol with better prospects from a given list of symbols. Can optionally alert when a symbol moves into the top two (configurable). Also shown is the number of pips that the symbol has moved in its current direction, allowing you to tell if you've 'missed the boat'. Further, a graph is shown, per symbol, of the indicator value over time all
Comprehensive on chart trade panel with the unique ability to be controllable from mobile as well. Plus has a library of downloadable configuration, e.g. exit rules, extra panel buttons, pending order setup and more. Please see our product video. Works with all symbols not just currency pairs. Features On chart panel plus controllable from free app for Windows, iPhone and Android Built-in script engine with library of downloadable configuration, e.g. add 'Close All Trades in Profit' button, exit
Strategy Builder offers an incredible amount of functionality. It combines a trade panel with configurable automation (covert indicators into an EA), real-time statistics (profit & draw down) plus automatic optimization of SL, TP/exit, trading hours, indicator inputs. Multiple indicators can be combined into an single alert/trade signal and can include custom indicators, even if just have ex4 file or purchased from Market. The system is easily configured via a CONFIG button and associated pop-u
Description Shows Heikin-Ashi candles (often misspelled Heiken-Ashi) on the chart and can alert when candles change color. The alert is useful for both entry and exit. The number of candles of the new color before an alert is raised can be set. The alert can be controlled interactively, directly from the chart. Also includes bonus indicators of current spread and ask/bid prices in large text, color coded as price changes. Usage Heikin-Ashi candles give a much better insight to the underlying tre
Description The product draws lines on the chart to show daily support, resistance and pivot plus weekly and monthly pivot. An alert can be set when the price reaches one of the lines or the price closes above/below it. This can be useful for both entry and exit. The alerts can be controlled interactively directly from the chart. The product also includes bonus indicators of Average Daily Range (or Average True Range - configurable), current spread and ask/bid prices in large text, color coded a
Description Shows whether market is trending or not, to what extent, which direction, and if the trend is increasing. The indicator is very useful for trend following strategies. The indicator can also alert when the market transitions from being flat to trending, which can serve as a great entry point. The alert is controllable directly from the chart, with an on-chart tick box to enable the alert. Also includes bonus indicators of current spread and ask/bid prices in large text, color coded as
Provides the simplicity of binary options but addresses the shortcomings of regular binary options, namely: Poor risk reward ratio, fixed duration trades, poor broker choice, poor indicators/alerts, no hidden (stealth) stop loss/take profit, etc. Features 1 to 1 risk reward ratio, calculated automatically (configurable) Manual (with alert) or automatic trade entry (on alert conditions) Lot size calculation (money management) - based on % of account to risk or fixed amount Compact interactive on
The product combines a manual trade panel with the ability to perform actions automatically in a highly configurable way. Actions include capturing indicator values and then based on those values raising alerts, open/close or partially close trades, scale-in, setting up pending orders, adjusting stop loss, take profit and more. On-chart controls can be configured, such as tick boxes and buttons, so can be fully interactive. The EA also handles money management, news events, hidden stop loss, tak
The indicator displays trend strength, including showing the transition from buy to sell and visa versa. It is ideal for trend following strategies and also highlights possible reversals/flattening trend with a yellow X on the indicator window. By default, the indicator does not repaint/flicker, however, there is an option to calculate on the live candle but even then the indicator will not repaint unduly. The indicator can also be used for exit. Usage Enter long/buy trade when the indicator tr
Allows multiple indicators to be combined into a single indicator, both visually and in terms of an alert. Indicators can include standard indicators, e.g. RSI, CCI, etc., and also Custom Indicators, even those purchased through Market, or where just have the ex4 file. An early alert is provided, say when 4 out 5 indicators have lined up, and a confirmed alert when all are in agreement. A‌lso features a statistics panel reporting the success of the combined indicator by examining the current cha
Displays multiple indicators, across multiple timeframes and symbols to give a comprehensive overview of the market. Uniquely, the indicators are configurable and can include custom indicators, even those where you just have the ex4 file or those purchased from Market. Standard indicators can also be selected, the default being ADX, CCI, market price above/below Moving Average (MA), Moving Average Cross (MAX), MACD, Momentum (MOM), OsMA, RSI, Parabolic SAR, William's Percentage Range (WPR). Use
Strategy Builder offers an incredible amount of functionality. It combines a trade panel with configurable automation (covert indicators into an EA), real-time statistics (profit & draw down) plus automatic optimization of SL, TP/exit, trading hours, indicator inputs. Multiple indicators can be combined into an single alert/trade signal and can include custom indicators, even if just have ex4 file or purchased from Market. The system is easily configured via a CONFIG button and associated pop-up
The first currency based indicator to draw a distinction between map and strength. The map shows the currencies in terms of oversold/overbought levels and gives the direction of travel. The currency strength calculates and shows the strength of that move. Alerts are included for changes in currency direction on the map (confirmed over two bars) and also when the strength reached the appropriate level.  The currency map is useful for finding currency pairs to trade and in which direction. Look fo
The product combines a manual trade panel with the ability to perform actions automatically in a highly configurable way. Actions include capturing indicator values and then based on those values raising alerts, open/close or partially close trades, scale-in, setting up pending orders, adjusting stop loss, take profit and more. On-chart controls can be configured, such as tick boxes and buttons, so can be fully interactive. The EA also handles money management, news events, hidden stop loss, tak
The indicator displays a matrix of indicators across multiple timeframes with a sum total and optional alert. Custom indicators can also be added to the matrix, in a highly configurable way. The alert threshold can be set to say what percentage of indicators need to be in agreement for an alert to happen. The alerts can turned on/off via on chart tick boxes and can be set to notify to mobile or sent to email, in addition to pop-up. The product offers a great way to create an alert when multiple
Allows multiple indicators to be combined into a single indicator, both visually and in terms of an alert. Indicators can include standard indicators, e.g. RSI, CCI, etc., and also Custom Indicators, even those purchased through Market, or where just have the ex4 file. An early alert is provided, say when 4 out 5 indicators have lined up, and a confirmed alert when all are in agreement. A‌lso features a statistics panel reporting the success of the combined indicator by examining the current cha
Displays multiple indicators, across multiple timeframes and symbols to give a comprehensive overview of the market. Uniquely, the indicators are configurable and can include custom indicators, even those where you just have the ex4 file or those purchased from Market. Standard indicators can also be selected, the default being ADX, CCI, market price above/below Moving Average (MA), Moving Average Cross (MAX), MACD, Momentum (MOM), OsMA, RSI, Parabolic SAR, William's Percentage Range (WPR). Use
Auswahl:
Keine Bewertungen
Antwort auf eine Rezension
Version 1.7 2018.11.29
- Fixed issue with previous release, where 'EA mode' wasn't working correctly when capturing direction
Version 1.6 2018.11.23
- Added EA_mode input which can be set to true when capturing values from an EA via iCustom() to improve performance
Version 1.5 2018.06.21
- Fixed issue where alert on/off tick box wasn't working and couldn't be hidden
Version 1.3 2018.03.08
- Fixed issue with two color buffers, meant for internal calculations, being shown on chart depending on chart background color.