• Übersicht
  • Bewertungen (16)
  • Diskussion (71)
  • Neue Funktionen

Candle patterns scanner with RSI filter

4.92

Dieser Multi-Time-Frame- und Multi-Symbol-Indikator scannt nach Pin-Bars, Morgen-/Abendsternen, Engulfings, Pinzetten, Drei-Linien-Strikes, Inside Bars und Wimpel und Dreiecken. Der Indikator kann auch im Single-Chart-Modus verwendet werden. Bitte lesen Sie mehr über diese Option im Produkt Blogs . In Kombination mit Ihren eigenen Regeln und Techniken ermöglicht Ihnen dieser Indikator, Ihr eigenes leistungsstarkes System zu erstellen (oder zu verbessern).

Merkmale

  • Kann alle in Ihrem Market Watch-Fenster sichtbaren Symbole gleichzeitig überwachen. Wenden Sie den Indikator auf nur einen Chart an und überwachen Sie sofort den gesamten Markt.
  • Überwacht jeden Zeitrahmen von M1 bis MN und sendet Ihnen eine Echtzeitwarnung (Pop-up, Push oder E-Mail), wenn ein Muster identifiziert wird.
  • Kann RSI- und Bollinger-Bänder als Filter für Pin-Bar-, Morgen-/Abendstern-, Engulfing- und Pinzetten-Formationen verwenden, um potenzielle Umkehrungen richtig zu erkennen.
  • Kann den gleitenden Durchschnitt als Haupttrendfilter und ADX als Volalitätsfilter verwenden.
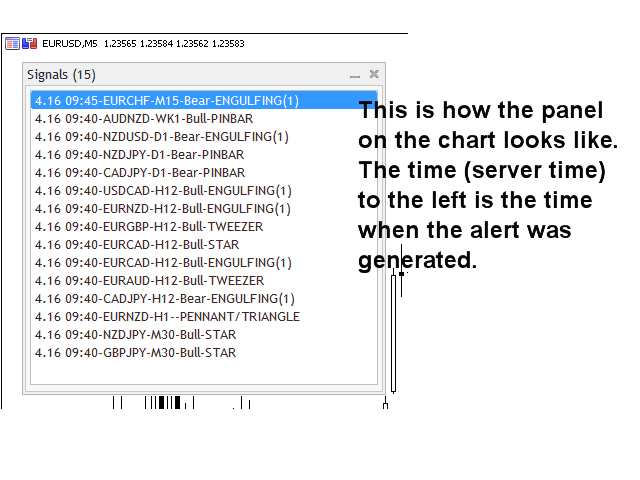
  • Der Indikator enthält ein interaktives Panel. Wenn Sie auf ein Element klicken, wird ein neuer Chart mit dem entsprechenden Symbol und Zeitrahmen geöffnet.
  • Der Indikator kann die Signale in eine Datei schreiben, die von einem Expert Advisor für den automatischen Handel verwendet werden kann. Zum Beispiel dieses Produkt.

Das Scannen von Wimpel und Dreiecken identifiziert Ausbruchsmuster mit hoher Wahrscheinlichkeit. Es tut dies, indem es starke, symmetrische Wimpel und Dreiecke identifiziert. Dieses Muster erscheint NICHT sehr oft in höheren Zeitrahmen. Aber wenn dies der Fall ist, handelt es sich um ein Setup mit sehr hoher Wahrscheinlichkeit. Siehe Screenshots hier.

Eingabeparameter

Die Beschreibung und Erläuterung der Eingabeparameter finden Sie hier.

Wichtig

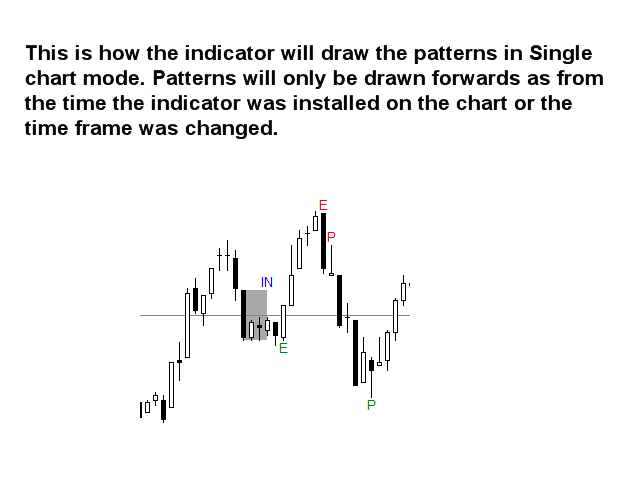
Bitte beachten Sie, dass auf dem Chart, auf dem der Indikator installiert ist, aufgrund der Multifunktionalität weder Kauf- und Verkaufshinweise noch Linien und Pfeile gezeichnet werden. Auf dem Chart, der sich öffnet, wenn Sie auf ein Signal im Chart-Panel klicken, werden Linien gezeichnet, die auf die Inside-Bars und Wimpel- und Dreiecksformationen sowie Pfeile für die anderen Kerzenmuster hinweisen.

Es wird dringend empfohlen, den Indikator auf einem sauberen (leeren) Chart ohne andere Indikatoren oder Expert Advisors darauf zu platzieren, die den Scanner stören könnten.

Bewertungen 16
yamez
207
yamez 2023.02.02 05:39 
 

Great scanner with optional filters built in. Bonus is that it works with the authors free Signal EA too. I agree with other reviews, the author is very helpful.

Ian Straw
757
Ian Straw 2021.12.15 17:12 
 

Great indicator, very useful. Jan is a good honest helpful seller. 5 star +

CasiousD
814
CasiousD 2021.12.08 01:36 
 

Amazing indicator. Lots of customizations to set each candle sticks/pattern to your own specifications, to suit your own style of trading. New single chart mode works great, and the on screen indentifying stick/pattern labels are simple and clean, so keeps your chart from looking too busy and cluttered. Developer is very responsive, very easy to work with and extremlely helpful. Very honorable and stands by his products, he helped me to fully address the issues I was having and now indicator works perfectly! Thank you Jan!

Empfohlene Produkte
Der Trendfänger: Die Strategie des Trendfängers mit Alarmindikator ist ein vielseitiges technisches Analysewerkzeug, das Händlern hilft, Markttrends und potenzielle Ein- und Ausstiegspunkte zu identifizieren. Sie verfügt über eine dynamische Trendfängerstrategie, die sich den Marktbedingungen anpasst, um eine klare visuelle Darstellung der Trendrichtung zu ermöglichen. Händler können die Parameter an ihre Vorlieben und Risikotoleranz anpassen. Der Indikator hilft bei der Trendidentifikation,
FREE
This is a new strategy for SUPPLY DEMAND areas It is based on a calculation using the tick volume to detect the big price action in market for both bear /bull actions this smart volume action candles are used to determine the supply and demand areas prices in between main supply and demand lines indicate sideway market  up arrows will be shown when prices moves above the main supply and the secondary supply lines Down arrows will be shown when prices moves below the main demand and the secondary
We present you the indicator "Candle closing counter", which will become your indispensable assistant in the world of trading. That’s why knowing when the candle will close can help: If you like to trade using candle patterns, you will know when the candle will be closed. This indicator will allow you to check if a known pattern has formed and if there is a possibility of trading. The indicator will help you to prepare for market opening and market closure. You can set a timer to create a p
Market Structure Zig Zag
Lesedi Oliver Seilane
4.69 (26)
Free Market structure zig zag to assist in price action trading the screenshots describe how to use and how to spot patterns new version comes with alerts, email alert and  push notification alert can be used on all pairs  can be used on all timeframes  you can add additional confirmation indicators the indicator shows you your higher high and low highs as well as your lower lows and lower highs  the indication makes price action analysis easier to spot.
FREE
Owl smart levels
Sergey Ermolov
4.34 (35)
MT5-Version  |  FAQ Der   Owl Smart Levels Indikator   ist ein komplettes Handelssystem innerhalb eines Indikators, der so beliebte Marktanalysetools wie die   fortschrittlichen Fraktale von Bill Williams , Valable ZigZag, das die   richtige Wellenstruktur   des Marktes aufbaut, und   Fibonacci-Levels , die die genauen Einstiegslevels markieren, enthält in den Markt und Orte, um Gewinne mitzunehmen. Detaillierte Strategiebeschreibung Anleitung zur Verwendung des Indikators Berater-Assistent im
Extremum Reverse Bar
Yurij Izyumov
2.8 (5)
This indicator has been created for finding the probable reversal points of the symbol price. A small candlestick reversal pattern is used it its operation in conjunction with a filter of extremums. The indicator is not redrawn! If the extremum filter is disabled, the indicator shows all points that have a pattern. If the extremum filter is enabled, the condition works – if the history Previous bars 1 candles back contains higher candles and they are farther than the Previous bars 2 candle, such
FREE
Super Reversal Pattern
Parfait Mujinga Ndalika
Super Reversal Pattern Indicator Unlock the power of advanced pattern recognition with our Super Reversal Pattern Indicator. Designed for traders seeking precision and reliability, this indicator identifies one of the most effective reversal patterns in technical analysis, offering a significant edge in your trading strategy. Key Features: Non-Repainting Accuracy: Enjoy the confidence of non-repainting technology. Once a Super Reversal Pattern is detected, it remains static, providing consis
Quantum Heiken Ashi PRO MT4
Bogdan Ion Puscasu
4.33 (6)
Wir stellen vor       Quantum Heiken Ashi PRO-   Charts Die Heiken-Ashi-Kerzen wurden entwickelt, um klare Einblicke in Markttrends zu geben und sind bekannt für ihre Fähigkeit, Rauschen herauszufiltern und falsche Signale zu eliminieren. Verabschieden Sie sich von verwirrenden Preisschwankungen und begrüßen Sie eine glattere, zuverlässigere Diagrammdarstellung. Was den Quantum Heiken Ashi PRO wirklich einzigartig macht, ist seine innovative Formel, die traditionelle Candlestick-Daten in leicht
"Adjustable Fractals" - is an advanced version of fractal indicator, very useful trading tool! As we know   Standard fractals mt4 indicator does not have settings at all   - this is very inconvenient for traders Adjustable Fractals has resolved that issue - it has all necessary settings: Adjustable period   of indicator (recommended values - above 7) Adjustable distance   from Highs/Lows of price Adjustable design   af fractal arrows // More great Expert Advisors and Indicators are available he
Awesome Oscillator by Bill Williams with the ability to fine-tune and replace the averaging algorithms of the indicator, which significantly expands the possibilities of using this oscillator in algorithmic trading and brings it closer in its properties to such an indicator as the MACD. To reduce price noise, the final indicator is processed with an additional Smooth averaging. The indicator has the ability to give alerts, send mail messages and push signals when the direction of movement of th
TrendPlus
Sivakumar Subbaiya
4.08 (12)
Trend Plus   Trendplus  Indicator   Time Frame: Suitable for any time frame.  Purpose: Trend Prediction. Blue and red candle indicate the buy and sell call respectively. Buy: When the blue candle is formed buy call is initiated. close the buy trades when the next red candle will formed.   Sell: When the Red candle is formed Sell call is initiated. close the Sell trades when the next blue candle will formed.   Happy trade!!
FREE
>>> BIG SALE PROMOTION: 50% OFF + GIFT EA!  - Promo price: $64 / Regular price $129 <<< - The promotion will end soon! The Forex Trend Tracker is an advanced tool designed to enhance the trading capabilities of forex traders. This sophisticated indicator uses complex mathematical formulas alongside the Average True Range (ATR) to detect the beginnings of new upward and downward trends in the forex market. It offers visual cues and real-time alerts to give traders a competitive advantage in th
Trend PA
Mikhail Nazarenko
5 (3)
The Trend PA indicator uses   Price Action   and its own filtering algorithm to determine the trend. This approach helps to accurately determine entry points and the current trend on any timeframe. The indicator uses its own algorithm for analyzing price changes and Price Action. Which gives you the advantage of recognizing, without delay, a new nascent trend with fewer false positives. Trend filtering conditions can be selected in the settings individually for your trading style. The indicator
Rainbow MT4
Jamal El Alama
Rainbow MT4 is a technical indicator based on Moving average with period 34 and very easy to use. When price crosses above MA and MA changes color to green, it’s a signal to buy. When price crosses below MA and MA changes color to red, it’s a signal to sell. The Expert advisor ( Rainbow EA MT4) based on Rainbow MT4 indicator, as you can see in the short video below is now available here .
FREE
GTAS FibTdi
Riviera Systems
GTAS FidTdi is a trend indicator using combination of volatility and potential retracement levels. This indicator was created by Bernard Prats Desclaux, proprietary trader and ex-hedge fund manager, founder of E-Winvest. Description The indicator is represented as a red or green envelope above or under prices. How to use Trend detecting When the envelope is green, the trend is bullish. When it is red, the trend is bearish. Trading Once a trade is opened, GTAS FibTdi shows retracement zones
FREE
Zunächst einmal ist es wichtig zu betonen, dass dieses Handelstool ein Nicht-Repaint-, Nicht-Redraw- und Nicht-Verzögerungsindikator ist, was es ideal für professionelles Trading macht. Online-Kurs, Benutzerhandbuch und Demo. Der Smart Price Action Concepts Indikator ist ein sehr leistungsstarkes Werkzeug sowohl für neue als auch erfahrene Händler. Er vereint mehr als 20 nützliche Indikatoren in einem und kombiniert fortgeschrittene Handelsideen wie die Analyse des Inner Circle Traders und Stra
Trendiness Index
Libertas LLC
5 (3)
"The trend is your friend" is one of the best known sayings in investing, because capturing large trendy price movements can be extremely profitable. However, trading with the trend is often easier said than done, because many indicators are based on price reversals not trends. These aren't very effective at identifying trendy periods, or predicting whether trends will continue. We developed the Trendiness Index to help address this problem by indicating the strength and direction of price trend
HMA Trend Professional MT4
Pavel Zamoshnikov
4.57 (7)
Improved version of the free HMA Trend indicator (for MetaTrader 4) with statistical analysis. HMA Trend is a trend indicator based on the Hull Moving Average (HMA) with two periods. HMA with a slow period identifies the trend, while HMA with a fast period determines the short-term movements and signals in the trend direction. The main differences from the free version: Ability to predict the probability of a trend reversal using analysis of history data. Plotting statistical charts for analyz
Email Drawdown Alert
Roman Starostin
5 (12)
Free informative Indicator-helper. It'll be usefull for traders who trade many symbols or using grid systems (Averaging or Martingale). Indicator counts drawdown as percent and currency separate. It has a number of settings: Count deposite drawdown according equity value and send e-mail or notifications to user if DD more than set; Sending e-mail when max open orders reached; Shows price and remaining pips amount before MarginCall on current chart and Account generally; Display summary trade lot
FREE
A machine translation from English product description was used. We apologies for possible imprecisions. Es wurde eine maschinelle Übersetzung der englischen Produktbeschreibung verwendet. Eventuelle Ungenauigkeiten bitten wir zu entschuldigen. Ein Visualisierungssystem für beliebte Candlestick-Preisaktionsmuster. Nach dem Anbringen markiert der Indikator automatisch die nächsten Muster auf dem Diagramm: Pinocchio Bar – ein kleiner Körperriegel mit einer langen „Nase“, einem sehr bekannten umgek
PipFinite Exit EDGE
Karlo Wilson Vendiola
4.83 (115)
Did You Have A Profitable Trade But Suddenly Reversed? In a solid strategy, exiting a trade is equally important as entering. Exit EDGE helps maximize your current trade profit and avoid turning winning trades to losers. Never Miss An Exit Signal Again Monitor all pairs and timeframes in just 1 chart www.mql5.com/en/blogs/post/726558 How To Trade You can close your open trades as soon as you receive a signal Close your Buy orders if you receive an Exit Buy Signal. Close your Sell orde
Chart Patterns Detect 15 patterns (Ascending Triangle, Descending Triangle, Rising Wedge, Falling Wedge, Bullish Flag, Bearish Flag, Bullish Rectangle, Bearish Rectangle Symmetrical triangle, Head and Shoulders, Inverted Head and Shoulders, Triple top, Triple Bottom, Double Top, Double Bottom) Use historical data to calculate the probability of each pattern to succeed (possibility to filter notification according to the chance of success) gives graphic indication about the invalidation level and
Signal trend indicator. Detects the direction of the trend and is coloured accordingly.  Has built in audible and visual alerts when trends change. Can send notifications to your phone or email. Allows Trend and Counter-Trend trading. Works on all timeframes, all currency pairs, metals, indices and cryptocurrencies. Can be used with binary options. Distinctive features No re-drawing; Simple and clear settings; Four types of alerts; Works on all timeframes and all trading tools; Su
The Penta-O is a 6-point retracement harmonacci pattern which usually precedes big market movements. Penta-O patterns can expand and repaint quite a bit. To make things easier this indicator implements a twist: it waits for a donchian breakout in the right direction before signaling the trade. The end result is an otherwise repainting indicator with a very reliable trading signal. The donchian breakout period is entered as an input. [ Installation Guide | Update Guide | Troubleshooting | FAQ | A
Pin Bars
Yury Emeliyanov
5 (3)
Hauptzweck: "Pin Bars" wurde entwickelt, um Pin Bars auf Finanzmarktdiagrammen automatisch zu erkennen. Eine Stiftleiste ist eine Kerze mit einem charakteristischen Körper und einem langen Schwanz, die eine Trendumkehr oder -korrektur signalisieren kann. Funktionsweise: Der Indikator analysiert jede Kerze auf dem Diagramm und bestimmt die Größe von Körper, Schwanz und Nase der Kerze. Wenn eine Stiftleiste erkannt wird, die vordefinierten Parametern entspricht, markiert der Indikator sie auf d
FREE
Trend Ray
Andriy Sydoruk
The indicator shows the potential trend direction by cyclical-wave dependence. Thus, all the rays of the intersection will be optimal rays, in the direction of which the price is expected to move, taking into account the indicator period. Rays can be used as a direction for potential market movement. But we must not forget that the approach must be comprehensive, the indicator signals require additional information to enter the market.
This indicator prepared by using 57 days moving averagr and least square method. It can only work for 1 hr time interval. Once a signal created. It is creating order and 2 limit orders. It works in CFD pairs as well as in Forex pairs. You can fins our other products from link : https://www.mql5.com/en/users/drbastem/seller Also, you can ask all your questins from email : haskayafx@gmail.com or mobile : +90 530 867 5076 or @MehmetBastem on telegram application This system is for Long term and pr
Trend Scanner
Vladimir Kalendzhyan
4.33 (6)
By purchasing this indicator, you have the right to receive a free copy of one of   my other indicator's or advisor’s!  (All future updates are included. No limits) . To get it , please contact me by  mql5 message ! The Trend Scanner trend line indicator displays the trend direction and its changes. The indicator works on all currency pairs and  timeframes. The indicator simultaneously displays multiple readings on the price chart: the support and resistance lines of the currency pair, the exist
Trade History Drawer
David Leander Tschacher
Trade History Drawer ist ein Indikator für MetaTrader 4. Es werden Trades in benutzerdefinierten Farben auf den Chart gezeichnet. Ausserdem erstellt der Indikator eine Trade-History-Zusammenfassung und speichert sie in einem CSV-File ab; Für das selektierte Symbol oder für alle Symbole. Eingaben General Settings Number Trades : Anzahl der Trades die gezeichnet werden sollen, falls -1 alle Magic Number : Nur Trades mit dieser MagicNumber, falls -1 wird diese Eingabe ignoriert Line Style : Ar
The indicator allows you to trade binary options. The recommended time frame is М1 and the expiration time is 1,2,3 minutes. The indicator suitable for auto and manual trading. A possible signal is specified as a arrows above/under a candle. You should wait until the candle closes! Arrows are not re-painted Trade sessions: TOKYO section (Half-end) Currency pairs: USD/JPY Working time frame: M1 Expiration time: 1,2,3 minutes. The indicator also shows good results when using the martingale strateg
FREE
Käufer dieses Produkts erwarben auch
Gann Made Easy
Oleg Rodin
4.86 (83)
Gann Made Easy ist ein professionelles und einfach zu bedienendes Forex-Handelssystem, das auf den besten Handelsprinzipien unter Verwendung der Theorie von Mr. basiert. W.D. Gann. Der Indikator liefert genaue KAUF- und VERKAUFSsignale, einschließlich Stop-Loss- und Take-Profit-Levels. Mit PUSH-Benachrichtigungen können Sie auch unterwegs handeln. Bitte kontaktieren Sie mich nach dem Kauf! Ich werde meine Handelstipps und tolle Bonusindikatoren kostenlos mit Ihnen teilen! Wahrscheinlich haben Si
FX Volume
Daniel Stein
4.58 (33)
Erhalten Sie Ihr tägliches Marktupdate mit Details und Screenshots über unser Morning Briefing hier auf mql5 und auf Telegram ! FX Volume ist der ERSTE und EINZIGE Volumenindikator, der einen ECHTEN Einblick in die Marktstimmung aus Sicht eines Brokers bietet. Es bietet fantastische Einblicke in die Positionierung von institutionellen Marktteilnehmern, wie z.B. Brokern, auf dem Forex-Markt, viel schneller als COT-Berichte. Diese Informationen direkt auf Ihrem Chart zu sehen, ist der wahre Game
Enigmera
Ivan Stefanov
5 (3)
ENIGMERA: Der Kern des Marktes https://www.enigmera.com Einführung Dieser Indikator und dieses Handelssystem sind ein bemerkenswerter Ansatz für die Finanzmärkte. ENIGMERA nutzt die fraktalen Zyklen zur genauen Berechnung von Unterstützungs- und Widerstandsniveaus. Er zeigt die echte Akkumulationsphase an und gibt Richtung und Ziele vor.  Ein System, das funktioniert, egal ob wir uns in einem Trend oder in einer Korrektur befinden.  Wie funktioniert es? ENIGMERA besteht aus drei Linien: der
Gold Stuff
Vasiliy Strukov
4.89 (241)
Gold Stuff-Ein Trendindikator, der speziell für Gold entwickelt wurde, kann auch auf allen Finanzinstrumenten verwendet werden. Der Indikator wird nicht neu gezeichnet und verzögert sich nicht. Empfohlener Zeitrahmen H1. Nach diesem Indikator geschrieben EA Gold Stuff Berater, können Sie es in meinem Profil finden. WICHTIG! Kontaktieren Sie mich sofort nach dem Kauf, um Anweisungen und Bonus zu erhalten!   Sie können eine kostenlose Kopie unseres Strong Support- und Trendscanner-Indikators
Atomic Analyst
Issam Kassas
5 (2)
Zunächst einmal ist es erwähnenswert, dass dieser Handelsindikator nicht neu malt, nicht neu zeichnet und keine Verzögerung aufweist, was ihn sowohl für manuellen als auch für Roboterhandel ideal macht. Benutzerhandbuch: Einstellungen, Eingaben und Strategie. Der Atom-Analyst ist ein PA-Preisaktionsindikator, der die Stärke und das Momentum des Preises nutzt, um einen besseren Vorteil auf dem Markt zu finden. Ausgestattet mit fortschrittlichen Filtern, die helfen, Rauschen und falsche Signale z
FX Power MT4 NG
Daniel Stein
5 (13)
Erhalten Sie Ihr tägliches Marktupdate mit Details und Screenshots über unser Morning Briefing hier auf mql5 und auf Telegram ! FX Power MT4 NG ist die nächste Generation unseres langjährig sehr beliebten Währungsstärkemessers FX Power. Und was bietet dieser Stärkezähler der nächsten Generation? Alles, was Sie am ursprünglichen FX Power geliebt haben PLUS GOLD/XAU-Stärkeanalyse Noch präzisere Berechnungsergebnisse Individuell konfigurierbare Analysezeiträume Anpassbares Berechnungslimit für noc
Trend Punch
Mohamed Hassan
4.95 (19)
This indicator is unstoppable when combined with our other indicator called  Support & Resistance . After purchase, send us a message and you will get it   for  FREE as a BONUS! Introducing Trend Punch , the revolutionary forex trend indicator that will transform the way you trade! Trend Punch is uniquely designed to provide precise buy and sell arrows during strong market trends, making your trading decisions clearer and more confident. Whether you're trading major currency pairs or exotic sym
Gann Swing Structure
Kirill Borovskii
5 (1)
This indicator is based on the mathematics of the great trader W.D. Ganna. With its help, you can easily find strong levels by analyzing swings to find the optimal entry point. The indicator works on all instruments and all timeframes. The indicator is fully manual and has control buttons. All you need to do is press the NEW button, a segment will appear, which you can place on any movement, swing or even 1 candle that you want to analyze. By placing the segment, press the OK button. A grid (th
Scalper Inside PRO
Alexey Minkov
4.73 (56)
An exclusive indicator that utilizes an innovative algorithm to swiftly and accurately determine the market trend. The indicator automatically calculates opening, closing, and profit levels, providing detailed trading statistics. With these features, you can choose the most appropriate trading instrument for the current market conditions. Additionally, you can easily integrate your own arrow indicators into Scalper Inside Pro to quickly evaluate their statistics and profitability. Scalper Inside
Dynamic Forex28 Navigator
Bernhard Schweigert
5 (1)
Dynamic Forex28 Navigator – Das Forex-Handelstool der nächsten Generation AKTUELL 49 % RABATT. Dynamic Forex28 Navigator ist die Weiterentwicklung unserer seit langem beliebten Indikatoren und vereint die Leistung von drei in einem: Advanced Currency Strength28 Indicator (695 Bewertungen) + Advanced Currency IMPULSE mit ALERT (520 Bewertungen) + CS28 Combo Signals (Bonus) Details zum Indikator https://www.mql5.com/en/blogs/post/758844 Was bietet der Strength Indicator der nächsten Generation?
Derzeit 20% Rabatt! Die beste Lösung für jeden Neueinsteiger oder Expert Händler! Dieses Dashboard arbeitet mit 28 Währungspaaren. Es basiert auf 2 unserer Hauptindikatoren (Advanced Currency Strength 28 und Advanced Currency Impulse). Es bietet einen hervorragenden Überblick über den gesamten Forex-Markt. Es zeigt die Werte der Advanced Currency Strength, die Veränderungsrate der Währungen und die Signale für 28 Devisenpaare in allen (9) Zeitrahmen. Stellen Sie sich vor, wie sich Ihr Hande
Trend Screener
STE S.S.COMPANY
4.81 (88)
Trendindikator, bahnbrechende, einzigartige Lösung für Trendhandel und -filterung mit allen wichtigen Trendfunktionen in einem Tool! Es handelt sich um einen 100 % nicht neu zu malenden Multi-Timeframe- und Multi-Währungs-Indikator, der für alle Symbole/Instrumente verwendet werden kann: Forex, Rohstoffe, Kryptowährungen, Indizes und Aktien. ZEITLICH BEGRENZTES ANGEBOT: Der Support- und Resistance-Screener-Indikator ist für nur 50 $ und lebenslang verfügbar. (Ursprünglicher Preis 250 $) (Angebot
TPSproTREND PrO
Roman Podpora
4.79 (19)
TPSpro TREND PRO   ist ein Trendindikator, der den Markt automatisch analysiert und Informationen über den Trend und jede seiner Änderungen liefert sowie Signale für den Einstieg in Geschäfte ohne Neuzeichnung gibt! Der Indikator verwendet jede Kerze und analysiert sie separat. bezieht sich auf verschiedene Impulse – Aufwärts- oder Abwärtsimpuls. Exakte Einstiegspunkte in Transaktionen für Währungen, Krypto, Metalle, Aktien, Indizes! Version MT5                   VOLLSTÄNDIGE BESCHREIBUNG DES
Wir stellen Ihnen ON Trade Waves Patterns Harmonic Elliot Wolfe vor, einen fortschrittlichen Indikator, der entwickelt wurde, um verschiedene Markt-Muster mithilfe sowohl manueller als auch automatischer Methoden zu erkennen. Hier ist, wie er funktioniert: Harmonische Muster: Dieser Indikator kann harmonische Muster erkennen, die auf Ihrem Chart erscheinen. Diese Muster sind für Trader, die die Theorie des harmonischen Handels praktizieren, wie sie in Scott Carney's Buch "Harmonic Trading vol 1
Scalper Vault
Oleg Rodin
5 (27)
Scalper Vault ist ein professionelles Scalping-System, das Ihnen alles bietet, was Sie für erfolgreiches Scalping benötigen. Dieser Indikator ist ein komplettes Handelssystem, das von Forex- und Binäroptionshändlern verwendet werden kann. Der empfohlene Zeitrahmen ist M5. Das System liefert Ihnen genaue Pfeilsignale in Richtung des Trends. Es liefert Ihnen auch Top- und Bottom-Signale und Gann-Marktniveaus. Die Indikatoren bieten alle Arten von Warnungen, einschließlich PUSH-Benachrichtigungen.
Der Forex TPA Indikator deckt die wahren Aktionen der Marktmacher auf, immer dann wenn sie passieren. "Kämpfe nicht gegen die Marktmacher an, sondern folge ihnen", ist wohl der beste Rat, den ein Trader bekommen kann. Der TPA Indikator zeigt jedesmal seine Signale an wenn die Bullen definitiv stärker sind als die Bären und umgekehrt. Dieser Indikator wurde VON Tradern FÜR Trader gemacht und ist 100% NICHT NACHZEICHNEND! Signale werden STRENG am Schluss einer Kerze  generiert. Das sagen unsere Ku
Currency Strength Wizard ist ein sehr leistungsstarker Indikator, der Ihnen eine Komplettlösung für erfolgreichen Handel bietet. Der Indikator berechnet die Stärke dieses oder jenes Forex-Paares anhand der Daten aller Währungen in mehreren Zeitrahmen. Diese Daten werden in Form von benutzerfreundlichen Währungsindizes und Währungsstärkelinien dargestellt, anhand derer Sie die Stärke dieser oder jener Währung erkennen können. Sie müssen lediglich den Indikator an das Diagramm anhängen, mit dem Si
PRO Renko System ist ein hochpräzises Handelssystem, das speziell für den Handel mit RENKO-Charts entwickelt wurde. Dies ist ein universelles System, das auf verschiedene Handelsinstrumente angewendet werden kann. Das System neutralisiert effektiv so genannte Marktgeräusche, die Ihnen Zugang zu genauen Umkehrsignalen geben. Der Indikator ist sehr einfach zu bedienen und hat nur einen Parameter, der für die Signalerzeugung verantwortlich ist. Sie können das Tool einfach an jedes Handelsinstr
TPSpro RFI Levels
Roman Podpora
4.82 (22)
ANWEISUNGEN    Russland -    ENG    Die Empfehlung basiert auf dem Indikator -   TPSpro   TREND PRO -   Version MT5 Die wichtigsten Elemente in der Branche sind entweder in Zonen oder in der Fabrik enthalten, oder sie führen zu einer Lösung bei einem Kauf oder dem Verkauf eines anderen Instruments. Wenn viele Menschen ihre Rechte nicht auf dem Händlerkonto verschlüsseln, werden die Folgen nicht schnell genug sein. Ich habe es damit abgeschlossen, dass ich diese Folgen nun noch interpretieren un
Currency Strength Exotics
Bernhard Schweigert
4.87 (30)
Stärke von 8 Währungen plus EIN EXOTISCHES Paar oder Rohstoffe oder Indexe! Jedes Produkt kann als 9. Linie hinzugefügt werden. Fügen Sie Rohstoffe, Indexes oder exotische Währungen hinzu (Gold, Silber, Öl, DAX, US30, MXN, TRY, CNH ...). Eine neue noch nie dagewesene TRADING STRATEGIE  !!! Dieser Indikator ist einzigartig, weil wir eine Reihe von proprietäre Funktionen und neue Formeln eingebaut haben. Es funktioniert für alle Zeitrahmen. Basierend auf neuen zugrunde liegenden Algorithmen ist
Trend Pulse
Mohamed Hassan
5 (4)
Please contact me after purchase to immediately get your PDF strategy + documentation for Trend Pulse !  Introducing Trend Pulse , a unique and robust indicator capable of detecting bullish, bearish, and even ranging trends! Trend Pulse uses a special algorithm to filter out market noise with real precision. If the current symbol is moving sideways, Trend Pulse will send you a ranging signal, letting you know that it's not a good time to enter a trade. This excellent system makes Trend Pulse
MetaBands M4
Vahidreza Heidar Gholami
5 (2)
MetaBands verwendet leistungsstarke und einzigartige Algorithmen, um Kanäle zu zeichnen und Trends zu erkennen, sodass es Tradern potenzielle Punkte für den Einstieg und Ausstieg aus Trades bieten kann. Es ist ein Kanalindikator sowie ein leistungsstarker Trendindikator. Es umfasst verschiedene Arten von Kanälen, die einfach durch Verwendung der Eingabeparameter zusammengeführt werden können. MetaBands verwendet alle Arten von Warnmeldungen, um Benutzer über Marktereignisse zu informieren. Funkt
Gold Channel is a volatility-based indicator, developed with a specific timing algorithm for the XAUUSD pair, which consists of finding possible corrections in the market. This indicator shows two outer lines, an inner line (retracement line) and an arrow sign, where the theory of the channel is to help identify overbought and oversold conditions in the market. The market price will generally fall between the boundaries of the channel. If prices touch or move outside the channel it is a tra
Automated Trendlines
Georgios Kalomoiropoulos
5 (16)
Trendlinien sind das wichtigste Werkzeug der technischen Analyse im Devisenhandel. Leider zeichnen die meisten Händler sie nicht richtig. Der automatische Trendlinien-Indikator ist ein professionelles Tool für ernsthafte Trader, das Ihnen hilft, die Trendbewegung der Märkte zu visualisieren. Es gibt zwei Arten von Trendlinien Bullische Trendlinien und Bärische Trendlinien. Im Aufwärtstrend wird die Forex-Trendlinie durch die niedrigsten Swing-Punkte der Preisbewegung gezogen. Wenn man m
Reversal Sniper is designed to find the extreme reversals of the price. Indicator collects data of Cycle Sniper Indicator. NOTE: REVERSAL SNIPER Indicator is made for Cycle Sniper Users as an additional tool.  However, it can be used by the traders who look for finding out strong reversal levels. Indicator works on all timeframes and all instruments. Reversal  Sniper  Checks: Harmonic Patterns RSI Zig Zag and Harmonic Swings Cycle Sniper Indicator's Buy / Sell Signals The complex algo i
BITTE LESEN SIE DIE INFORMATIONEN UNTEN, BEVOR SIE DAS PRODUKT KAUFEN! Apollo Pips PLUS SP ist ein einzigartiges Produkt! ES IST FÜR ALLE, DIE MEINEN NEUEN „APOLLO PIPS“-INDIKATOR PLUS „SUPER PACK“-BONUS MIT ZUGRIFF AUF ALLE MEINE HANDELSINDIKATOREN ERHALTEN MÖCHTEN! Mit dem Kauf des Produkts Apollo Pips PLUS SP erwerben Sie tatsächlich eine völlig neue Version meines Apollo Pips-Indikators. Diese Version des Indikators verfügt über einen verbesserten Algorithmus und einen benutzerfreundlichen P
Introducing the South African Sniper indicator created by a small group of traders with a few years trading trading the financial market profitably . This is a plug and play indicator that provides you with  BUY and SELL (SNIPER ENTRY) signals with TARGET and trail stops. The indicator Works with all MT4 trading instruments. The indicator uses previous  chart data as receipt to speculate on future market moves.
Dieses Dashboard zeigt die neuesten verfügbaren harmonischen Muster für die ausgewählten Symbole, so dass Sie Zeit sparen und effizienter sein werden / MT5-Version . Kostenloser Indikator: Basic Harmonic Pattern Spalten des Indikators Symbol: die ausgewählten Symbole werden angezeigt Trend: bullish oder bearish Pattern : Art des Musters (Gartley, Schmetterling, Fledermaus, Krabbe, Hai, Cypher oder ABCD) Entry : Einstiegskurs SL: Stop-Loss-Kurs TP1: 1. Take-Profit-Kurs TP2: 2. Gewinnmitnah
PowerBall Signals ist ein KAUF-/VERKAUF-Signalindikator, der auf der Idee der Nutzung von Unterstützungs-/Widerstandszonen basiert. Der Indikator erkennt spezielle Umkehrmuster basierend auf Unterstützungs-/Widerstandszonen und stellt diese Signale auf Ihrem Chart bereit. Die Hauptidee des Indikators besteht darin, die MTF-Analyse (Multi Time Frame) zu verwenden und Signale basierend auf den Niveaus Ihres aktuellen und nächsthöheren Zeitrahmens bereitzustellen. Mit dieser Methode können mögliche
IX Power MT4
Daniel Stein
5 (5)
IX Power bringt die unschlagbare Präzision von FX Power endlich auch zu Nicht-Forex-Symbolen. Es bestimmt präzise die Intensität von kurz-, mittel- und langfristigen Trends in Ihren Lieblingsindizes, Aktien, Rohstoffen, ETFs und sogar Kryptowährungen. Sie können alles analysieren, was Ihr Terminal zu bieten hat. Probieren Sie es aus und erleben Sie, wie sich Ihr Timing beim Handel deutlich verbessert . IX Power Hauptmerkmale 100% präzise, nicht nachpinselnde Berechnungsergebnisse - für
Weitere Produkte dieses Autors
Ich empfehle Ihnen, den   Blog (Handbuch) des Produkts   von Anfang bis Ende zu lesen, damit von Anfang an klar ist, was der EA bietet. Dieser Expert Advisor erkennt, wann eine Divergenz zwischen dem Preis und einem Oszillator/Indikator auftritt. Es identifiziert sowohl reguläre/klassische (Trendumkehr) als auch versteckte (Trendfortsetzung) Divergenzen. Es verfügt über Angebots-/Nachfragezone, RSI, Bollinger, Stochastik, gleitenden Durchschnitt (regulärer MA und Hull MA), ADX und Volumenfilter
The indicator identifies when a divergence occurs between price and an indicator or oscillator. It identifies both regular and hidden divergences. Combined with your own rules and techniques, this indicator will allow you to create (or enhance) your own powerful system. Features Can detect divergences for the following oscillators/indicators:   MACD, OsMA, Stochastics, RSI, CCI, RVI, Awesome, ADX, ATR, OBV, Composite index, MFI and Momentum. Only one oscillator/indicator can be selected. Draws
FREE
Please if possible consider the  paid version  which I will continue to develop (there will be no future updates for this free version). This Expert Advisor identifies when a divergence occurs between price and an oscillator/indicator. It identifies both regular/classical (trend reversal) and hidden (trend continuation) divergences. It has RSI, bollinger, stochastics, moving average and ADX filter options which makes it possible to filter out only the strongest setups. The default settings ar
FREE
Dieser Multi-Time-Frame- und Multi-Symbol-Indikator kann die folgenden 5 Kreuze identifizieren: wenn ein sich schnell bewegender Durchschnitt eine Linie des langsamen gleitenden Durchschnitts kreuzt. wenn der Preis einen einzelnen gleitenden Durchschnitt erreicht hat (oben/unten geschlossen oder gerade abgesprungen). wenn eine Triple Moving Average Formation aufgetreten ist (alle 3 MA:s in aufeinanderfolgender Ausrichtung) wenn die MACD-Hauptlinie die Signallinie kreuzt. wenn die Signallinie die
This multi indicator/oscillator (hereafter indicator), multi time frame and multi symbol indicator identifies when a divergence occurs between price and one, two or three indicators. It identifies both regular/classical (trend reversal) and hidden (trend continuation) divergences. It has RSI and MA trend filter options which makes it possible to filter out only the strongest setups. Combined with your own rules and techniques, this indicator will allow you to create (or enhance) your own powerfu
I recommend you to read the   product's blog  (manual) from start to end so that it is clear from the beginning what the indicactor offers. This multi time frame and multi symbol divergence dashboard indicator sends an alert when one or two different divergences have been identified. It can be used with all time frames from M1 to MN. Maximum 9 time frames can be shown in the dashboard at the same time. It is possible to enable moving average, RSI or Bollinger bands trend filter to filter out on
I recommend you to read the   product's blog  (manual) from start to end so that it is clear from the beginning what the indicactor offers. This multi time frame and multi symbol indicator identifies double or triple top/bottom formations or a following neckline breakout (confirmed top/bottom). It offers filters for RSI overbought/oversold, candle patterns (pin bar, engulfing, tweezer, morning/evening star, three line strike) and divergences (MACD, OsMA, Awesome (AO), RSI, CCI, Stochastic) whic
Divergence dashboard
Jan Flodin
4.64 (11)
I recommend you to read the   product's blog  (manual) from start to end so that it is clear from the beginning what the indicactor offers. This multi time frame and multi symbol divergence dashboard indicator sends an alert when one or two different divergences have been identified. It can be used with all time frames from M1 to MN. It is possible to enable moving average or RSI trend filter to filter out only the strongest setups. It should be combined with your own confirmation rules, techni
Dieser Multisymbol- und Multi-Timeframe-Indikator kann nicht nur bullische und bärische Dreilinien-Strike-Formationen finden, sondern auch nach den folgenden Candlestick-Mustern suchen (siehe Screenshots zur Erklärung der Muster): Drei weiße Soldaten (Umkehrung>Fortsetzungsmuster) Drei schwarze Krähen (Umkehrung> Fortsetzungsmuster) Die Formationen erscheinen nicht sehr oft auf höheren Zeitrahmen, wenn die strikte Option in den Indikatoreinstellungen aktiviert ist. Aber wenn sie es tun, ist es e
This indicator can send alerts when a Heiken Ashi Smoothed color change occurs. Combined with your own rules and techniques, this indicator will allow you to create (or enhance) your own powerful system. Features Can send all types of alerts. Option to delay the alert one or more bars in order to confirm the color (trend) change. Input parameters Candle shift for alert: Default is 1. Setting it to 0 will alert you on color change on the current candle. This should be regarded as a pending (uncon
FREE
Der Indikator identifiziert, wenn eine Divergenz zwischen dem Preis und einem Oszillator/Indikator auftritt. Es identifiziert sowohl reguläre als auch versteckte Abweichungen. Es verfügt über eine RSI-Filteroption, die es ermöglicht, nur die stärksten Setups herauszufiltern. Der Indikator bietet auch Optionen zum Warten auf eine Engulfing-Formation, den Ausbruch des Donchian-Kanals oder bis der Preis einen gleitenden Durchschnitt überschreitet   (siehe Screenshot Nr. 3).       um die Divergenz z
The indicator identifies when a divergence occurs between price and an indicator or oscillator. It identifies bullish and bearish hidden or regular (classical) divergences. Combined with your own rules and techniques, this indicator will allow you to create (or enhance) your own powerful system. Features Can detect divergences for the following indicators/oscillators: MACD, OsMA (Moving average of Oscillator), Stochastics, RSI, CCI, RVI, Awesome (AO), ADX, ATR, OBV, MFI, Momentum and   Composi
FREE
This indicator can send alerts when a Heiken Ashi Smoothed color change occurs. Combined with your own rules and techniques, this indicator will allow you to create (or enhance) your own powerful system. Features Can send all types of alerts. Option to delay the alert one bar in order to confirm the color (trend) change. Input parameters Wait for candle close: 'true' or 'false'. Setting it to 'true' will delay the alert to the opening of the bar following the bar where the color change occurred.
FREE
Features This is an indicator that recognizes a special type of Inside Bar formation which is formed by a Master candle followed by 4 smaller candles (please see the strategy explanation below). Plots buy/sell stop lines on the chart as well as well as take profit and stop loss levels. The TP/SL levels are based on the Average True Range (ATR) indicator. Object colors are changeable. Sends you a real-time alert when a Master candle formation is identified - sound / pop-up / email / push notifica
I recommend you to read the  product's blog  (manual) from start to end so that it is clear from the beginning what the EA offers. This Expert Advisor (EA) is designed to trade on a rapid price movement following a news event. The EA trades multiple symbols from one single chart which must be a EURUSD H1 chart. It it advisable to remove all symbols you don't trade from the Market Watch to reduce the overall data demand. The 'Auto settings' input parameter value True must only be used you have s
Dieser Indikator mit mehreren Zeitrahmen und mehreren Symbolen identifiziert doppelte Top/Boden-, Kopf- und Schulter-, Wimpel-/Dreiecks- und Flaggenmuster. Es ist auch möglich, Alarme nur dann einzurichten, wenn ein Nackenlinien-/Dreiecks-/Fahnenmast-Ausbruch aufgetreten ist (Nackenlinien-Ausbruch = bestätigtes Signal für Top/Bottoms und Head & Shoulders).       Der Indikator kann auch im Single-Chart-Modus verwendet werden. Bitte lesen Sie mehr über diese Option in den Produktinformationen    
I recommend you to read the   product's blog  (manual) from start to end so that it is clear from the beginning what the indicactor offers. This multi time frame and multi symbol supply and demand zone dashboard indicator sends alerts when the price has reached a supply/demand zone. It is also possible to use it to be alerted about regular double tops/bottoms instead of zones. It can be used with all time frames from M1 to MN. It is possible to use RSI, divergence (MACD, OsMA, RSI or Awesome) a
Ich empfehle Ihnen, die zu lesen       Produkt-Blog   (Handbuch) von Anfang bis Ende damit       Es ist von Anfang an klar, was der EA bietet. Die Hauptstrategie dieses Expert Advisors (EA) besteht darin, Trades zu platzieren, wenn 3 gleitende Durchschnitte (MA) in aufeinanderfolgender Ausrichtung und in einem bestimmten Abstand voneinander sind (dies kann zum Beispiel für eine nicht sehr bekannte Strategie verwendet werden, die von einigen institutionellen Händlern verwendet wird , die die MAs
I recommend you to read the   product's blog  (manual) from start to end so that it is clear from the beginning what the indicactor offers. This multi time frame and multi symbol indicator identifies double or triple top/bottom formations or a following neckline breakout (confirmed top/bottom). It offers RSI, pin bar, engulfing, tweezer, morning/evening star filters as well divergence filter options which makes it possible to filter out only the strongest setups. The indicator can also be used
I recommend you to read the   product's blog  (manual) from start to end so that it is clear from the beginning what the indicactor offers. This indicator for Metatrader 4 identifies when a divergence occurs between price and an oscillator/indicator. It identifies both bullish and bearish divergences. It has a RSI filter option which makes it possible to filter out only the strongest setups. The indicator also offers options to wait for an Engulfing formation, Donchian channel breakout or for p
Dieser Multi-Timeframe- und Multi-Symbol-Indikator scannt nach Pin-Bars, Morgen-/Abendsternen, Engulfings, Tweezers, Three Line Strikes, Inside Bars und Wimpel und Dreiecken.   Der Indikator kann auch im Single-Chart-Modus verwendet werden. Bitte lesen Sie mehr über diese Option in den Produktinformationen       bloggen   .       In Kombination mit Ihren eigenen Regeln und Techniken ermöglicht Ihnen dieser Indikator, Ihr eigenes leistungsstarkes System zu erstellen (oder zu verbessern). Merkmale
This multi time frame and multi symbol indicator for MT5 alerts about Heiken Ashi Smoothed color changes. As a bonus it can also scan for Hull Moving Average color (trend) changes. Combined with your own rules and techniques, this indicator will allow you to create (or enhance) your own powerful system. Features Can monitor all symbols visible in your Market Watch window at the same time. Apply the indicator to just one chart and instantly monitor the entire market. Can monitor every time fram
Dieser Indikator mit mehreren Zeitrahmen und mehreren Symbolen erkennt, wann die Stochastik-Signallinie die Stochastik-Hauptlinie kreuzt. Alternativ kann es auch alarmieren, wenn die Stochastik einen überkauften/überverkauften Bereich verlässt (ohne dass die Signallinie die Hauptlinie kreuzt). Als Bonus kann es auch nach Bollinger-Bändern und überkauften/überverkauften RSI-Kreuzungen suchen. In Kombination mit Ihren eigenen Regeln und Techniken können Sie mit diesem Indikator Ihr eigenes leistun
I recommend you to read the   product's blog  (manual) from start to end so that it is clear from the beginning what the indicactor offers. This multi time frame and multi symbol indicator sends an alert when one or more trend reversal candle patterns have been identified on several time frames. It can be used with all time frames from M5 to MN. It is possible to enable moving average or RSI trend filter to filter out only the strongest setups. Combined with your own rules and techniques, this
This multi indicator/oscillator (hereafter indicator), multi time frame and multi symbol indicator identifies when a divergence occurs between price and one, two or three indicators. It identifies both regular/classical (trend reversal) and hidden (trend continuation) divergences. It has RSI and MA trend filter options which makes it possible to filter out only the strongest setups. Combined with your own rules and techniques, this indicator will allow you to create (or enhance) your own powerfu
This multi time frame and multi symbol indicator identifies fractals patterns. As a bonus it can also scan for Parabolic SAR (pSAR) trend changes. Combined with your own rules and techniques, this indicator will allow you to create (or enhance) your own powerful system. Features Can monitor all symbols visible in your Market Watch window at the same time. Apply the indicator to just one chart and instantly monitor the entire market. Can monitor every time frame, from M1 to MN, and sends you a
Averaging down EA
Jan Flodin
5 (1)
This cost averaging Expert advisor (EA) places additional trades in the same direction as the original (manually opened) order when the price goes against you. It can be used as a grid system or as pure martingale system (exponential increasing of lot size) or smoothed martingale (for instance linear increasing of the lot size). Due to the risk involved, this EA is more suitable for intermediate to advanced traders who are well aware of how to handle risk management and trading an already profit
This multi symbol indicator has been designed to automatically identify when price reaches major psychological levels. Also known as round numbers, whole numbers or key levels. As a bonus it can also scan for pivot point level on one selected time frame. Combined with your own rules and techniques, this indicator will allow you to create (or enhance) your own powerful system. Features Can write the signals to a file which can be used by an Expert Advisor for auto trading. Can monitor all symbol
This multi time frame and multi symbol indicator identifies high-probability breakout patterns. It does this by identifying strong, symmetrical pennants and triangles. This pattern  DOES NOT  appear very often on higher timeframes. But when it does, it is a very high-probability setup. The indicator also includes an Inside bars scanner. It can for example be used to detect a special type of Inside bars formation which is formed by a Master candle (MC) followed by 4 inside candles (please see the
This indicator recognizes a special type of Inside Bar formation which is formed by a big Master candle followed by 4 smaller candles (please see the strategy explanation below). Features Plots buy/sell stop lines on the chart as well as well as take profit and stop loss levels. The TP/SL levels are based on the Average True Range (ATR) indicator. Object colors are changeable. Sends you a real-time alert when a Master candle formation is identified - sound / popup / email / push notification. On
Auswahl:
Devonish
3038
Devonish 2023.02.28 15:40 
 

Der Benutzer hat keinen Kommentar hinterlassen

yamez
207
yamez 2023.02.02 05:39 
 

Great scanner with optional filters built in. Bonus is that it works with the authors free Signal EA too. I agree with other reviews, the author is very helpful.

Ian Straw
757
Ian Straw 2021.12.15 17:12 
 

Great indicator, very useful. Jan is a good honest helpful seller. 5 star +

CasiousD
814
CasiousD 2021.12.08 01:36 
 

Amazing indicator. Lots of customizations to set each candle sticks/pattern to your own specifications, to suit your own style of trading. New single chart mode works great, and the on screen indentifying stick/pattern labels are simple and clean, so keeps your chart from looking too busy and cluttered. Developer is very responsive, very easy to work with and extremlely helpful. Very honorable and stands by his products, he helped me to fully address the issues I was having and now indicator works perfectly! Thank you Jan!

MILAD ORANGI
117
MILAD ORANGI 2021.09.11 01:25 
 

It is an efficient and good tool for the trader, but I think it will be updated a little late and it could be better, both in terms of graphics and performance. I hope a new version will be ready after a year.

danceke
559
danceke 2021.05.19 15:09 
 

The product is excellent. Jan is responsive, provides great support, and is an honorable gentleman. I recommend this product and the seller highly!

Delboyuk
81
Delboyuk 2020.12.29 18:36 
 

Der Benutzer hat keinen Kommentar hinterlassen

Jan Flodin
124593
Antwort vom Entwickler Jan Flodin 2020.12.30 08:10
The buyer has misunderstood how to setup the symbols to scan. Each symbol in the input parameter has to be visible in the Market Watch window and also written in the exact way as they as they appear in the Market Watch window. This is further explained in the product's blog. If the broker for instance has symbols written like USDJPYi or USDJPY.pro then you will have to change it in the same way in the input parameter.
sunnychow
8932
sunnychow 2020.05.01 10:35 
 

Der Benutzer hat keinen Kommentar hinterlassen

Kiem Pham
1274
Kiem Pham 2020.04.11 04:36 
 

Der Benutzer hat keinen Kommentar hinterlassen

fxcommentary
1903
fxcommentary 2020.03.24 00:53 
 

Very good filters of setups, the tool is well thought off. Thanks to developer. Easily can be connected to separate EA and becomes fully operational EA.

Giordano
63
Giordano 2018.03.04 15:17 
 

I especially thank Jan that with professionalism and helpfulness has helped me to solve a problem that was not the indicator but of the MT4, but together we have solved everything even if today is Sunday, I recommend to all its services and its products.

Good trading

Ninja Trader
59
Ninja Trader 2018.01.04 12:57 
 

Great job on this indicator. Has many functions, extremely useful tool. Excellent communication with the developer.

Katayoun Mehrabian
631
Katayoun Mehrabian 2017.08.21 23:13 
 

Great Scanner use it every day.

dmposton
844
dmposton 2017.08.11 22:19 
 

Agree with other reviews. This scanner works as the overview states. It is a must when trading manually. Developer is knowledgeable friendly and quick to respond to questions.

Dennis

fabbry72
1350
fabbry72 2017.08.11 01:50 
 

Very good job.

Indicator works perfectly.

Thanks

Fab.

tomasoft
723
tomasoft 2017.07.18 15:50 
 

Der Benutzer hat keinen Kommentar hinterlassen

Antwort auf eine Rezension
Version 3.4 2023.10.06
*** IMPORTANT - please always make a backup of the existing indicator (the .ex4 file) before you make an update ***

Change log:
- bug fix regarding the panel visibility
- added the option to write the signals as to Global variables
Version 3.3 2022.06.08
*** Please always make a backup of the existing indicator (the .ex4 file) before you make an update ***

- corrected an issue with the reported trade direction (bull/bear) in the text file for inside bars breakouts
Version 3.2 2022.05.23
*** Please always make a backup of the existing indicator (the .ex5 file) before you make an update ***

- corrected an issue with the reported trade direction (bull/bear) in the alerts for inside bars breakouts
- added the possibility to set the colors in the panel
Version 3.1 2021.12.15
- bug fix
Version 3.0 2021.12.15
*** Please always make a backup of the existing indicator (the .ex4 file) before you make an update ***

- added the possibility to set a separate period for the Bollinger filter
Version 2.9 2021.12.07
*** Please always make a backup of the existing indicator (the .ex4 file) before you make an update ***

- added a possibility to use the indicator in single chart mode (checking only one symbol and time frame). It will then draw the patterns on the chart where the indicator is running. This option is in some ways limited though. More information in the product's blog.
- added the possibility to be alerted only when there has been a breakout from the Inside bars formation
- added the drawing of arrows for pin bar, engulfing, tweezer, star and TLS patterns when the chart is opened from the panel
- added the possibility to add a custom text to the pop-up, push and mail alerts
- added the possibility to set a custom panel title
Version 2.8 2020.08.21
- added the engulfing option Size candle B engulfs body candle A
- added the possibility to use RSI trend filter in combinaton with Bollinger bands. Both must be on overbought/oversold area.
Version 2.7 2019.11.11
- added the possibility to write the signals in the panel to a file. Could for instance be used by an Expert Advisor for automatical trading. For instance this product: https://www.mql5.com/en/market/product/43512
- added ADX filter
Version 2.6 2019.08.24
- added drawing of Tweezer and Three Line Strike formations in the strategy tester
- added moving average trend filter
Version 2.5 2019.08.13
- added scanning of Three Line Strike formations
Version 2.4 2019.07.17
- added the possibility to set a fixed time frame for the trend filter
Version 2.3 2019.07.10
- added the possibility to ignore wicks on the inside bars candles
Version 2.2 2019.07.09
- added the possibility to set minimum and/or maximum candle size for the master (first) bar in a inside bars formation
- lines will now be drawn on Inside bars and Pennant/Triangles formations when opening a chart from the panel
- added a parameter for the line color if the drawing mentioned above
Version 2.1 2019.03.24
- added an option to filter out small pin bars by using the average candle size for the past xx candles
- it is now possible to select to scan all visible symbols from the Market Watch window instead of using the 'Symbols' input
parameter.
- added a smiley in the upper right corner of the chart showing that the indicator is up and running properly
Version 2.0 2018.12.01
- added an option to use candle midpoint logic for pin bars
Version 1.9 2018.11.01
- added possibility to set the panel width. Useful for those with Windows font size set to 125%
- corrected an issue with the sound file for custom sound alerts
- made it possible to enable Tweezer scanning separately from Engulfing
- added Bollinger filter option which can be used instead of the RSI filter
Version 1.8 2018.04.17
- added scanning for morning/evening star candle formations
- added support for testing in the Strategy tester
- added possibility to set a custom sound file for alerts
Version 1.7 2018.04.05
- added time of alert to the panel
- added possibility to use a custom chart template when opening a chart from the panel
Version 1.6 2018.02.08
- added the close price to the alert text for pin bar and engulfing signals
Version 1.5 2018.01.12
- added panel for storing signals
- added possibility to set short text version for alerts
Version 1.4 2017.11.10
- added scanning for tweezer pattern
Version 1.3 2017.08.10
- added possibility to set RSI (candle) shift in the Engulfing scanner
Version 1.2 2017.07.03
- changed setting of minimum candle body size from points to percentage
- added filter for scanning bullish and/or bearish engulfing and pinbar
Version 1.1 2017.06.23
Changes in the engulfing part of the scanner:
- 1 minor bug fix
- It is now possible to set the minimum body size in percent for the engulfing candle
- The alert will now give information about which type of pattern you have selected. Please see screenshot.