• Übersicht
  • Bewertungen (4)
  • Diskussion (16)
  • Neue Funktionen

EZT Macd Pro

5
Softwarebeschreibung
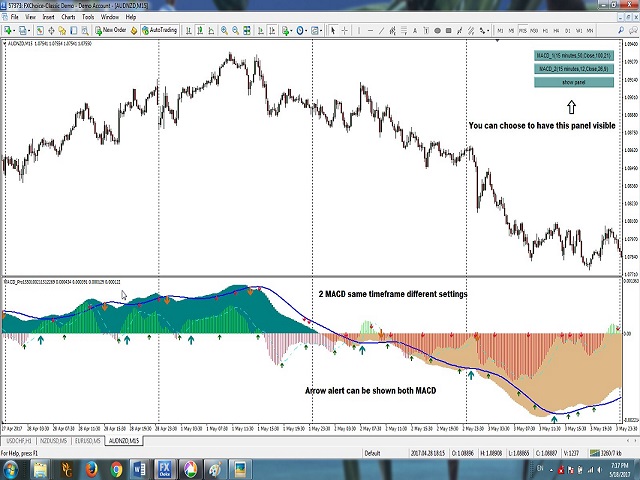
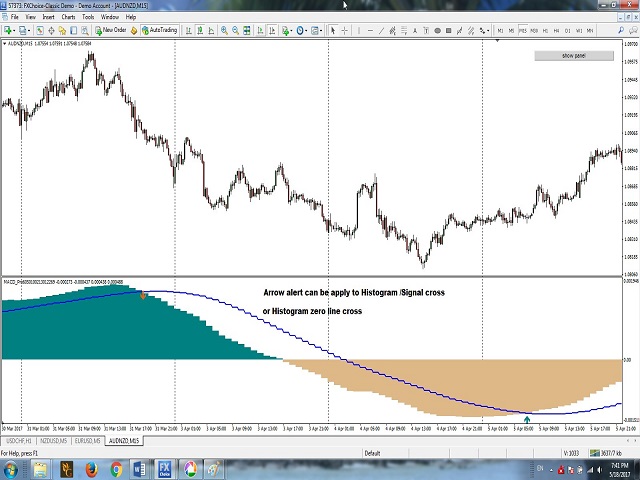
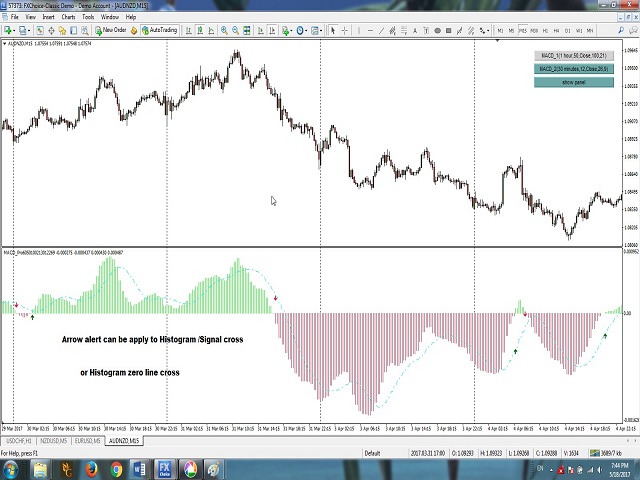
Dieser Indikator kann 1 oder 2 MACD-Indikatoren in verschiedenen Zeitrahmen und Einstellungen anzeigen. Es gibt eine KOSTENLOSE Version, die EMA zur Berechnung verwendet. Diese Pro-Version verwendet alle 4 gleitenden Durchschnittstypen zur Berechnung: Einfach, exponentiell, geglättet und linear gewichtet. Die aktiven Anzeigen können Popup-, Ton-, Push- oder E-Mail-Benachrichtigungen auslösen. Die Warnung der kostenlosen Version bezieht sich nur auf den Nullpunktdurchgang. Der Alarm dieser Pro-Version kann auf den Nullpunktdurchschnitt oder den Histogramm-Signalliniendurchschnitt eingestellt werden, wenn der Benutzer diese Option auswählt. Der Alarm kann für einen oder beide aktiven Indikatoren eingestellt werden, auch wenn der Zeitrahmen und die Periode jeweils unterschiedlich sind. Wenn zwei MACD-Indikatoren verwendet werden, kann die Warnung für jeden einzeln aktiviert werden.

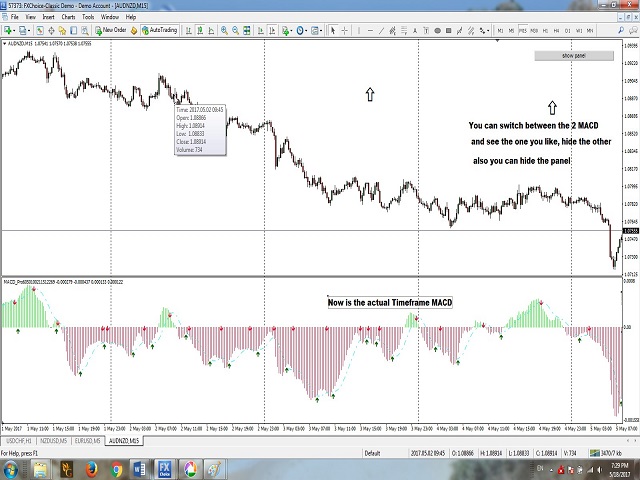
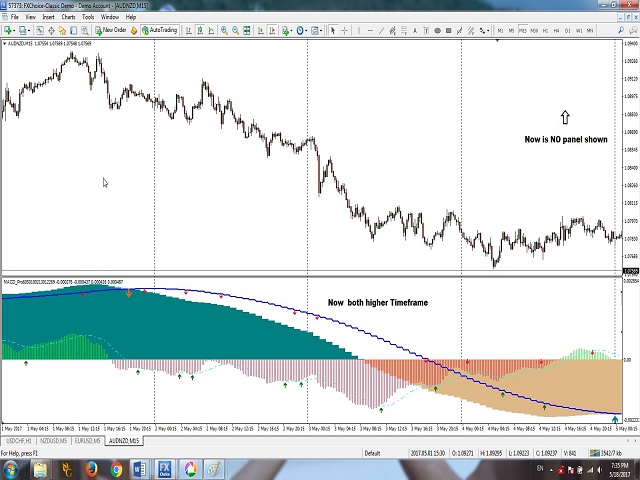
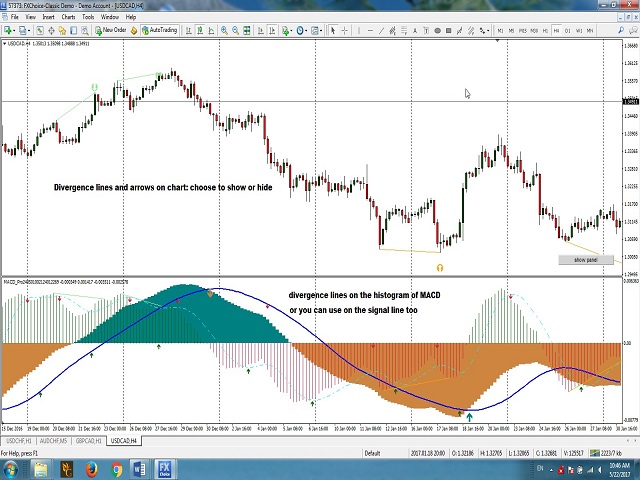
Auf dem Hauptdiagramm gibt es ein Anzeigefeld mit Schaltflächen, das die aktiven Indikatoren und ihre Einstellungen anzeigt. Es besteht die Möglichkeit, dieses Panel auszublenden. Mit den temporären Schaltflächen können Sie einen der aktiven MACD ausblenden

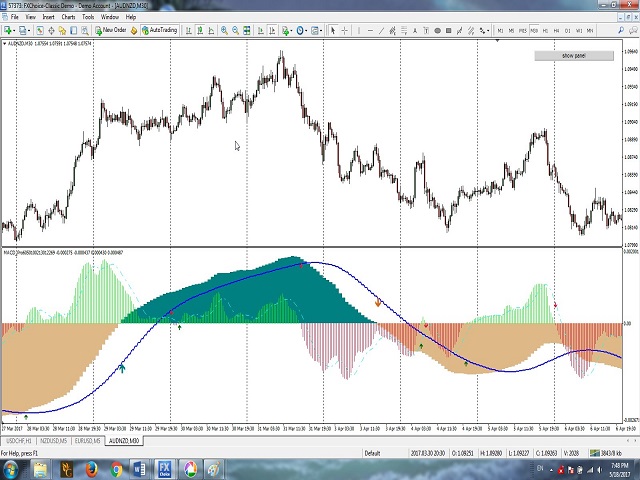
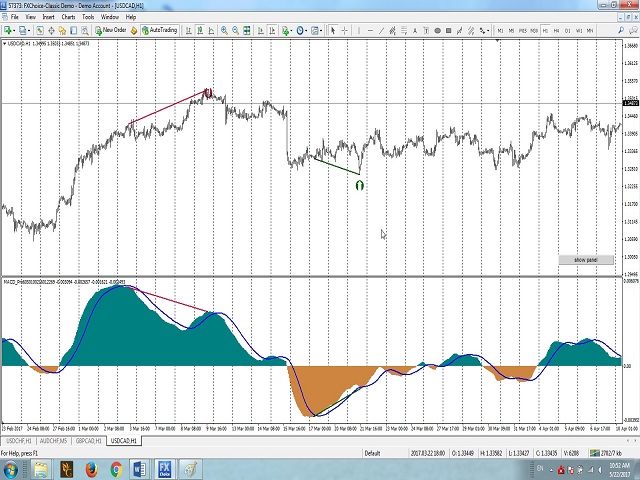
Zusätzliche Funktion hinzugefügt, die die kostenlose Version nicht hat: Divergenz. Sie können die Divergenz auf beiden MACDs anzeigen. Sie können zwischen regulärer und versteckter Divergenz oder beidem wählen. Sie können wählen, ob die Divergenz im Histogramm oder auf der Signallinie angezeigt werden soll. Sie können die Linien auch nur im MACD-Unterfenster oder im Preisdiagramm und im MACD anzeigen lassen. Auf dem Preisdiagramm können Sie auch Pfeile für die Divergenz anzeigen. Sie können die Warnungen für die beiden Arten der Divergenz separat einstellen. Vollständige Anpassung der Optionen für Farben und Linienstärke.


Einstellungen
Panel-Position – Das Anzeigefeld auf der Hauptkarte, in welcher Ecke Sie es sehen möchten.
Panel anzeigen – wahr oder falsch. Nur die Pro-Version verfügt über diese Option.
Panelgröße – Sie können zwischen normaler und großer Größe wählen.
Panel-Verschiebung – Wie weit Sie das Panel von der Seite entfernt haben möchten.
Farbe der aktiven MACD-Schaltfläche – Aktiver MACD.
Farbe der inaktiven MACD-Schaltfläche – Aktiver MACD, aber vorübergehend ausgeblendet.
Verwenden Sie MACD – wählen Sie nur einen oder beide: wahr/falsch.
MACD-Zeitrahmen – jeder MACD kann in einem anderen Zeitrahmen liegen.
Warnung – wahr/falsch: Popup-Benachrichtigung auf dem Pfeil.
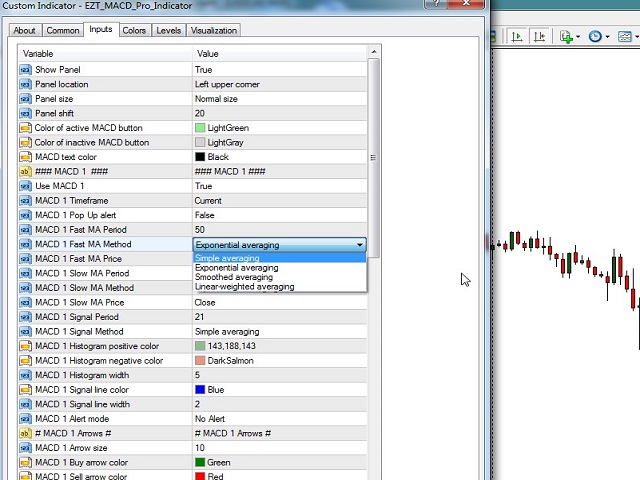
MA-Methode – Verwenden Sie einen der 4 gleitenden Durchschnitte: Einfach, exponentiell, geglättet, linear gewichtet / nur Pro-Version.
MA-Preis – Verwenden Sie einen der 7 Typen: Schluss, Offen, Hoch, Tief, Median, Typisch, Gewichtet.
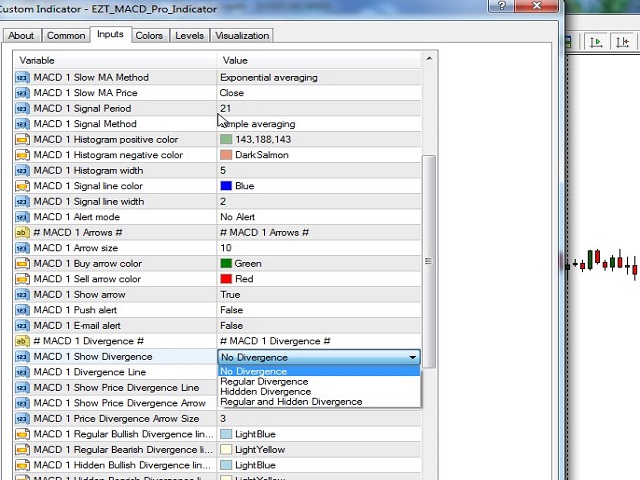
MACD Divergenz anzeigen – Wählen Sie Ihren Typ: Keine Divergenz, Regulär, Versteckt oder beides.
MACD-Divergenzlinie – Wenden Sie die Divergenzlinie auf das Histogramm oder die Signallinie an. Wählen Sie nur eine aus.
Preisdivergenzlinie anzeigen – Wenn diese Option auf „True“ eingestellt ist, wird die Divergenzlinie auch im Preisdiagramm angezeigt.
Preisdivergenzpfeil anzeigen – Wenn dieser Wert auf „True“ gesetzt ist, zeigt der Pfeil im Preisdiagramm die Divergenz an.
Alarmmodus – Sie können den Alarm für das Kreuzen der Histogramm-Nulllinie oder das Kreuzen der Histogramm-Signallinie oder für keine festlegen. Wählen Sie Ihren Benachrichtigungstyp.
Bitte helfen Sie meiner Arbeit, indem Sie eine Rezension oder Bewertung schreiben
Bewertungen 4
Larrydeelf
469
Larrydeelf 2024.03.07 17:07 
 

after watching the indicator perform this week I can say that this is a very good indicator it help me verify on my direction regarding price movement great job.

intan08
1381
intan08 2021.07.28 09:08 
 

Worth every penny.

Lasse Michael Holm
1318
Lasse Michael Holm 2020.05.20 01:44 
 

At last, a MACD indicator that works for me. Love the MTF capabilities and the possibilities for divergens on chart. Just grab this one 😃👍

Empfohlene Produkte
MACD Max
John Louis Fernando Diamante
A flexible 2-Line MACD indicator The default MACD indicator inside MT4, limits you to using the MACD with a fast-EMA, slow-EMA, and signal-SMA. This MACD indicator allows you to set your own MA-Method choices for these 3 components, separately! You can select from SMA-EMA-SMMA-LWMA-DEMA-TEMA, and can even use a separate method for each 3 fast-slow-signal periods. On-chart colored candles, with drawing condition types is included, with a show/hide button too. Features - MA Methods: SMA, EMA, S
MACD (short for Moving Average Convergence/Divergence) is one of the most famous and oldest indicators ever created and is widely used among beginners . However, there is a newer version of the MACD that is named Impulse MACD  which have less false signals than the standard MACD. Classic MACD helps us to identify potential trends by displaying crossovers between two lines. If MACD line crosses above the Signal line it shows us that the market is potentially up trending and that it would be a go
TT MACD Dashboard is multi-time frame and multi-currency market scanner. It is telling you the value of MACD and MACD histogram (a difference between MACD line and Signal line) in a form of small rectangle. If MACD value is above zero (MACD is bullish). Rectangle border color is bullish (Navy by default).  If MACD value is below zero (MACD is bearish). Rectangle border color is bearish (OrangeRed by default). If MACD histogram is rising and above zero (Bullish histogram). Rectangle color is bull
The indicator depends on the price action's analysis how is based on the rsi indicator and the moving average line from a platform containing multi symbols and different time-frames with the possibility to select your desired symbols and time-frames . Special Characteristics :  *  Real time analysis or at price close .  * The possibility to open several windows with the selected symbols .   *     Different alert systems .    Indicator  Characteristics :  * Multiple symbol and time frame with
Power Renko is an indicator which plots Renko bricks underneath the chart using a histogram. You can select the brick size and the timeframe of the Renko bricks as well as whether or not to use the close price or the high/low price of the candles. Renko bricks are based on price alone, not time, therefor the Renko bricks will not be aligned with the chart's time. They are extremely useful for trend trading and many different strategies can be formed from them. Buffers are provided allowing you t
Infinity Trend Pro
Yaroslav Varankin
1 (1)
This is a trend indicator without redrawing Developed instead of the binary options strategy (by the color of the Martingale candlestick) Also works well in forex trading When to open trades (binary options) A signal will appear in the place with a candle signaling the current candle It is recommended to open a deal for one candle of the current timeframe M1 and M5 When a blue dot appears, open a deal up When a red dot appears, open a trade down. How to open trades on Forex. When a signal is rec
ZhiBiCCI MT4
Qiuyang Zheng
5 (1)
[ZhiBiCCI] Indikatoren sind für alle Zyklusanwendungen und auch für alle Marktsorten geeignet. [ZhiBiCCI] Die grüne durchgezogene Linie ist eine Umkehrung der bullischen Divergenz. Die grüne gestrichelte Linie ist eine klassische bullische Divergenz. [ZhiBiCCI] Die durchgehende Linie zum Rot ist eine umgekehrte bearishe Divergenz. Die rote gepunktete Linie ist eine klassische bearishe Divergenz. [ZhiBiCCI] kann in den Parametern (Alert, Mail senden, Benachrichtigung senden) eingestellt wer
Owl smart levels
Sergey Ermolov
4.63 (54)
MT5-Version  |  FAQ Der   Owl Smart Levels Indikator   ist ein komplettes Handelssystem innerhalb eines Indikators, der so beliebte Marktanalysetools wie die   fortschrittlichen Fraktale von Bill Williams , Valable ZigZag, das die   richtige Wellenstruktur   des Marktes aufbaut, und   Fibonacci-Levels , die die genauen Einstiegslevels markieren, enthält in den Markt und Orte, um Gewinne mitzunehmen. Detaillierte Strategiebeschreibung Anleitung zur Verwendung des Indikators Berater-Assistent im
Basierend auf MACD-Indikatorwellen mit Standardparametern Wendet Fibonacci-Werte auf die letzten beiden MACD-Wellen an, jeweils positiv und negativ, wenn der MACD-Indikator im Moment keine negative Welle mehr hat - die Farbe ist grün, wenn der MACD-Indikator im Moment keine positive Welle mehr hat - die Farbe ist rot. Das Wave-Abschlusskriterium sind zwei Ticks mit unterschiedlichem MACD-Zeichen. Wendet Trendlinien auf die letzten vier MACD-Wellen an. Arbeitet gut mit dem Experten zus
Lyne
Maksim Kalachev
About the Lyne indicator Lyne is a Metatrader 4 (MT4) indicator, the essence of which is to transform the accumulated historical data. The Lyne indicator makes it possible to detect various features and patterns in price dynamics that are invisible to the naked eye. Based on this information, traders can anticipate further price movement and adjust their strategy accordingly. This indicator has proven itself in the scalping strategy. The indicator works without repainting.
PZ Trend Trading
PZ TRADING SLU
4.8 (5)
Trend Trading ist ein Indikator, der so weit wie möglich von den Markttrends profitiert, indem er Pullbacks und Breakouts zeitlich festlegt. Sie findet Handelsmöglichkeiten, indem sie analysiert, was der Preis während etablierter Trends tut. [ Installationsanleitung | Update-Anleitung | Fehlerbehebung | FAQ | Alle Produkte ] Handeln Sie mit Zuversicht und Effizienz an den Finanzmärkten Profitieren Sie von etablierten Trends, ohne ins Wanken zu geraten Profitable Pullbacks, Ausbrüche und vor
FXC iDeM-DivergencE MT4 Indicator This is an advanced DeMarker indicator that finds trend-turn divergences on the current symbol. The indicator detects divergence between the DeMarker and the price movements as a strong trend-turn pattern. Main features: Advanced divergence settings Price based on Close, Open or High/Low prices Give Buy/Sell open signals PUSH notifications E-mail sending Pop-up alert Customizeable Information panel Input parameters: DeM Period: The Period size of the DeMarke
The Stochastic Oscillator is a momentum indicator that uses support and resistance levels. The term "stochastic" refers to the point of a current price in relation to its price range over a period of time. You can use a New Stochastic in the same way as classical one: Overbought and Oversold areas to make a Buy or Sell orders. This new indicator shows all variety of Fibonacci Levels (from 23.6 to 76.4) which can be used as Overbought and Oversold levels as well as points to close an open positio
Garuda Fire MT4
Maldini Yoga Pratama
EA Garuda Fire MT4 .This is the logical development of EA Dragon Fire ultimate, with the addition of better logic and confirmation than before.   EA Garuda Fire MT4   is a trend following system for swing trading based on PLT indicator filtered by I-gentor LSMA. no need to add any indicators because everything is included in this EA code, so the trading decisions are simple and immediate without confusion that can result from the use of many indicators Only   10 download  of the EA left  at $6
The input parameter  counted_bars  determines on how many bars the indicator lines will be visible. The input parameter  barsNum is the period for bands calculation. When PriceClose for previous bar is above upper band a Long position may be opened. When PriceClose for previous bar is under lower band a Short position may be opened. If the current Price is between bands it is time to wait.
Mini Crypto Trading Dashboard
Opengates Success International
Micro Crypto Trading Dashboard This is a custom indicator created to give CRYPTO TRADERS a full view of what is going on in the Crypto market. It uses a real time data to access the market and display every bit of information needed to make successful trading. This is a Micro size of the Compact Crypto Market Trading Dashboard Indicator created mainly for trading Crypto Currencies Markets for a living. They practically perform the same operation but MicroMini FFMV Dashboard has a few feature
Forex Indicator "MACD with Trend ZigZag" for MT4 MACD   indicator itself is one of the most popular tool for trend trading "MACD with Trend ZigZag" is excellent for using   with Price Action entries or in combination with other indicators Use this indicator to select most accurate entry signals: - If MACD is above 0 (green color) and ZigZag line is upward - search only for Buy Price Action patterns -  If MACD is below 0 (pink color) and ZigZag line is downward - search only for Sell Price Action
Trend MACD mw
DMITRII GRIDASOV
T REND  MACD  Indicator for MT4  - is great & efficient trading tool! This indicator is great for Trend Traders who are focused to catch big price movements TREND MACD consist of 3 lines: Green line - shows  main trend direction , and Blue & Magenta lines for entry and exit. Indicator allows to maximize profit - not to exit from profitable trade too early Indicator has built-in Mobile and PC alerts HOW TO USE   indicator (see pictures): 1) Check if    Blue & Magenta lines both are above Green
Wave Wolf MT4
Andrei Salanevich
Der MT4 Wave Wold Forex Indikator wurde entwickelt, um Wulff-Wellen zu finden und sie im aktuellen Fenster des Handelsterminals anzuzeigen. Ein ausgezeichneter Indikator für Händler, die Wulff-Wellen im Handel verwenden. Seine Anwendung in Handelsstrategien wird ihre Effizienz und Rentabilität erheblich verbessern. INFORMATIONEN ZUM INDIKATOR Im Gegensatz zu anderen Wolfswellenindikatoren hat der MT4 Wave Wold Forex Indikator eine Reihe von Funktionen, die seine Effizienz erheblich verbessern
Concept Mean reversion is a concept in trading based on prices eventually returning to their mean or average level after a period of divergence or departure from the historical mean. Traders deploying mean reversion techniques typically wait for assets to diverge significantly from their mean values and then place trades on the assumption the price will return to the mean at some point in the future- this is also known as re-coupling or convergence. There are several mean reversion based trading
Insider Scalper Binary This tool is designed to trade binary options. for short temporary spends. to make a deal is worth the moment of receiving the signal and only 1 candle if it is m1 then only for a minute and so in accordance with the timeframe. for better results, you need to select well-volatile charts.... recommended currency pairs eur | usd, usd | jpy .... the indicator is already configured, you just have to add it to the chart and trade .... The indicator signals the next can
Noize Absorption Index MT4
Ekaterina Saltykova
5 (1)
Noize Absorption Index - is the manual trading system that measures the difference of pressure between bears forces and bulls forces. Green line - is a noize free index that showing curent situation. Zero value of index shows totally choppy/flat market.Values above zero level shows how powerfull bullish wave is and values below zero measures bearish forces.Up arrow appears on bearish market when it's ready to reverse, dn arrow appears on weak bullish market, as a result of reverse expectation. S
Der Indikator "Two Moving Average Crossover" für MetaTrader 4 (MT4) ist ein technisches Analysewerkzeug, das zwei gleitende Durchschnitte anzeigt und benachrichtigt, wenn sich die gleitenden Durchschnitte kreuzen. Der Indikator berechnet und stellt zwei gleitende Durchschnitte dar, von denen einer schneller und der andere langsamer ist. Wenn der schnellere gleitende Durchschnitt über dem langsameren gleitenden Durchschnitt kreuzt, gilt dies als Aufwärtssignal und deutet auf eine mögliche Trendu
The indicator detects and displays Shark harmonic pattern (see the screenshot). The pattern is plotted by the extreme values of the ZigZag indicator (included in the resources, no need to install). After detecting the pattern, the indicator notifies of that by a pop-up window, a mobile notification and an email. The indicator highlights the process of the pattern formation and not just the complete pattern. In the former case, it is displayed in the contour triangles. After the pattern is comple
An indicator of pattern #31 ("Long Island") from Encyclopedia of Chart Patterns by Thomas N. Bulkowski. The second gap is in the opposite direction. Parameters: Alerts - show alert when an arrow appears   Push - send a push notification when an arrow appears (requires configuration in the terminal) GapSize - minimum gap size in points ArrowType - a symbol from 1 to 17 ArrowVShift - vertical shift of arrows in points   ShowLevels - show levels ColUp - color of an upward line ColDn - color of
Forex Gump
Andrey Kozak
2.83 (6)
Forex Gump is a fully finished semi-automatic trading system. In the form of arrows, signals are displayed on the screen for opening and closing deals. All you need is to follow the instructions of the indicator. When the indicator shows a blue arrow, you need to open a buy order. When the indicator shows a red arrow, you need to open a sell order. Close orders when the indicator draws a yellow cross. In order to get the most effective result, we recommend using the timeframes H1, H4, D1. There
This product is a part of  ON Trade Waves Patterns Harmonic Elliot Wolfe you can test free version on EURJPY from this link  Wolf Waves Indicator E ntdecken Sie Wolf Waves - Ihr ultimatives Handelswerkzeug! Sind Sie auf der Suche nach einem leistungsstarken Tool, um Wolf Waves auf jedem Zeitrahmen leicht zu erkennen? Suchen Sie nicht weiter! Unser Wolf Waves-Indikator erledigt diese Aufgabe mühelos. Hier erfahren Sie, warum er perfekt für Sie ist: Hauptmerkmale: Automatische Erkennung: Unser
FXC iMACD-DivergencE MT4 Indicator This is an advanced MACD indicator that finds trend-turn divergences on the current symbol. The indicator detects divergence between the MACD and the price movements as a strong trend-turn pattern. Main features: Advanced divergence settings Price based on Close, Open or High/Low prices Give Buy/Sell open signals PUSH notifications E-mail sending Pop-up alert Customizeable Information panel Input parameters: MACD Fast-EMA: The Fast-EMA variable of the MACD
Chart Patterns Detect 15 patterns (Ascending Triangle, Descending Triangle, Rising Wedge, Falling Wedge, Bullish Flag, Bearish Flag, Bullish Rectangle, Bearish Rectangle Symmetrical triangle, Head and Shoulders, Inverted Head and Shoulders, Triple top, Triple Bottom, Double Top, Double Bottom) Use historical data to calculate the probability of each pattern to succeed (possibility to filter notification according to the chance of success) gives graphic indication about the invalidation level and
The indicator displays the data of the Stochastic oscillator from a higher timeframe on the chart. The main and signal lines are displayed in a separate window. The stepped response is not smoothed. The indicator is useful for practicing "manual" forex trading strategies, which use the data from several screens with different timeframes of a single symbol. The indicator uses the settings that are identical to the standard ones, and a drop-down list for selecting the timeframe. Indicator Parame
Käufer dieses Produkts erwarben auch
Gann Made Easy
Oleg Rodin
4.93 (80)
Gann Made Easy ist ein professionelles und einfach zu bedienendes Forex-Handelssystem, das auf den besten Handelsprinzipien unter Verwendung der Theorie von Mr. basiert. W.D. Gann. Der Indikator liefert genaue KAUF- und VERKAUFSsignale, einschließlich Stop-Loss- und Take-Profit-Levels. Mit PUSH-Benachrichtigungen können Sie auch unterwegs handeln. Bitte kontaktieren Sie mich nach dem Kauf! Ich werde meine Handelstipps und tolle Bonusindikatoren kostenlos mit Ihnen teilen! Wahrscheinlich haben Si
Atomic Analyst
Issam Kassas
5 (3)
Zunächst einmal ist es erwähnenswert, dass dieser Handelsindikator nicht neu malt, nicht neu zeichnet und keine Verzögerung aufweist, was ihn sowohl für manuellen als auch für Roboterhandel ideal macht. Benutzerhandbuch: Einstellungen, Eingaben und Strategie. Der Atom-Analyst ist ein PA-Preisaktionsindikator, der die Stärke und das Momentum des Preises nutzt, um einen besseren Vorteil auf dem Markt zu finden. Ausgestattet mit fortschrittlichen Filtern, die helfen, Rauschen und falsche Signale z
TPSpro RFI Levels
Roman Podpora
4.85 (20)
Reversal First Impulse levels (RFI)    INSTRUCTIONS        RUS       -       ENG              R ecommended to use with an indicator   -   TREND PRO -  Version MT5 A key element in trading is zones or levels from which decisions to buy or sell a trading instrument are made. Despite attempts by major players to conceal their presence in the market, they inevitably leave traces. Our task was to learn how to identify these traces and interpret them correctly. Main functions: Displaying active zones
DERZEIT 26% RABATT Die beste Lösung für jeden Newbie oder Expert Trader! Dieser Indikator ist ein einzigartiges, qualitativ hochwertiges und erschwingliches Trading-Tool, da wir eine Reihe von proprietären Funktionen und eine neue Formel integriert haben. Mit nur EINEM Chart können Sie die Währungsstärke für 28 Forex-Paare ablesen! Stellen Sie sich vor, wie sich Ihr Handel verbessern wird, weil Sie in der Lage sind, den genauen Auslösungspunkt eines neuen Trends oder einer Scalping-Gelegenh
Scalper Inside PRO
Alexey Minkov
4.74 (58)
An exclusive indicator that utilizes an innovative algorithm to swiftly and accurately determine the market trend. The indicator automatically calculates opening, closing, and profit levels, providing detailed trading statistics. With these features, you can choose the most appropriate trading instrument for the current market conditions. Additionally, you can easily integrate your own arrow indicators into Scalper Inside Pro to quickly evaluate their statistics and profitability. Scalper Inside
Gold Stuff
Vasiliy Strukov
4.89 (262)
Gold Stuff-Ein Trendindikator, der speziell für Gold entwickelt wurde, kann auch auf allen Finanzinstrumenten verwendet werden. Der Indikator wird nicht neu gezeichnet und verzögert sich nicht. Empfohlener Zeitrahmen H1. Nach diesem Indikator geschrieben EA Gold Stuff Berater, können Sie es in meinem Profil finden. WICHTIG! Kontaktieren Sie mich sofort nach dem Kauf, um Anweisungen und Bonus zu erhalten!   Sie können eine kostenlose Kopie unseres Strong Support- und Trendscanner-Indikators
Trend Punch
Mohamed Hassan
4.8 (15)
Manual guide:   Click here WEEK SALE PROMO:   $65 ONLY!  -- Next price is  $120 .  This indicator is unstoppable when combined with our other indicator called  Support & Resistance . After purchase, send us a message and you will get it   for  FREE as a BONUS! I like to use Trend Punch on XAUUSD on the M1 timeframe & higher ones!  Introducing Trend Punch , the revolutionary forex trend indicator that will transform the way you trade! Trend Punch is uniquely designed to provide pre
Derzeit 20% Rabatt! Die beste Lösung für jeden Neueinsteiger oder Expert Händler! Dieses Dashboard arbeitet mit 28 Währungspaaren. Es basiert auf 2 unserer Hauptindikatoren (Advanced Currency Strength 28 und Advanced Currency Impulse). Es bietet einen hervorragenden Überblick über den gesamten Forex-Markt. Es zeigt die Werte der Advanced Currency Strength, die Veränderungsrate der Währungen und die Signale für 28 Devisenpaare in allen (9) Zeitrahmen. Stellen Sie sich vor, wie sich Ihr Hande
Legacy of Gann
Pavel Zamoshnikov
4.83 (12)
The indicator very accurately determines the levels of the possible end of the trend and profit fixing. The method of determining levels is based on the ideas of W.D.Gann, using an algorithm developed by his follower Kirill Borovsky. Extremely high reliability of reaching levels (according to K. Borovsky  - 80-90%) Indispensable for any trading strategy – every trader needs to determine the exit point from the market! Precisely determines targets on any timeframes and any instruments (forex, met
Currency Strength Wizard ist ein sehr leistungsstarker Indikator, der Ihnen eine Komplettlösung für erfolgreichen Handel bietet. Der Indikator berechnet die Stärke dieses oder jenes Forex-Paares anhand der Daten aller Währungen in mehreren Zeitrahmen. Diese Daten werden in Form von benutzerfreundlichen Währungsindizes und Währungsstärkelinien dargestellt, anhand derer Sie die Stärke dieser oder jener Währung erkennen können. Sie müssen lediglich den Indikator an das Diagramm anhängen, mit dem Si
Zunächst einmal ist es wichtig zu betonen, dass dieses Handelstool ein Nicht-Repaint-, Nicht-Redraw- und Nicht-Verzögerungsindikator ist, was es ideal für professionelles Trading macht. Online-Kurs, Benutzerhandbuch und Demo. Der Smart Price Action Concepts Indikator ist ein sehr leistungsstarkes Werkzeug sowohl für neue als auch erfahrene Händler. Er vereint mehr als 20 nützliche Indikatoren in einem und kombiniert fortgeschrittene Handelsideen wie die Analyse des Inner Circle Traders und Stra
Werden Sie Breaker Trader und profitieren Sie von Änderungen der Marktstruktur, wenn sich der Preis umkehrt. Der Order Block Breaker Indikator zeigt an, wann sich eine Trend- oder Preisbewegung der Erschöpfung nähert und bereit ist, sich umzukehren. Es weist Sie auf Änderungen in der Marktstruktur hin, die normalerweise auftreten, wenn eine Umkehrung oder ein größerer Rückzug bevorsteht. Der Indikator verwendet eine proprietäre Berechnung, die Ausbrüche und Preisdynamik identifiziert. Jedes
TPSproTREND PrO
Roman Podpora
4.78 (18)
TPSpro TRENDPRO  - is a trend indicator that automatically analyzes the market and provides information about the trend and each of its changes, as well as giving signals for entering trades without redrawing! The indicator uses each candle, analyzing them separately. referring to different impulses - up or down impulse. Exact entry points into transactions for currencies, crypto, metals, stocks, indices!  -  Version MT5               DETAILED DESCRIPTION                R ecommended to use with
Enigmera
Ivan Stefanov
5 (3)
ENIGMERA: Der Kern des Marktes https://www.enigmera.com Einführung Dieser Indikator und dieses Handelssystem sind ein bemerkenswerter Ansatz für die Finanzmärkte. ENIGMERA nutzt die fraktalen Zyklen zur genauen Berechnung von Unterstützungs- und Widerstandsniveaus. Er zeigt die echte Akkumulationsphase an und gibt Richtung und Ziele vor.  Ein System, das funktioniert, egal ob wir uns in einem Trend oder in einer Korrektur befinden.  Wie funktioniert es? ENIGMERA besteht aus drei Linien: der
FX Power MT4 NG
Daniel Stein
5 (11)
Erhalten Sie Ihr tägliches Marktupdate mit Details und Screenshots über unser Morning Briefing hier auf mql5 und auf Telegram ! FX Power MT4 NG ist die nächste Generation unseres langjährig sehr beliebten Währungsstärkemessers FX Power. Und was bietet dieser Stärkezähler der nächsten Generation? Alles, was Sie am ursprünglichen FX Power geliebt haben PLUS GOLD/XAU-Stärkeanalyse Noch präzisere Berechnungsergebnisse Individuell konfigurierbare Analysezeiträume Anpassbares Berechnungslimit für noc
PRO Renko System ist ein hochpräzises Handelssystem, das speziell für den Handel mit RENKO-Charts entwickelt wurde. Dies ist ein universelles System, das auf verschiedene Handelsinstrumente angewendet werden kann. Das System neutralisiert effektiv so genannte Marktgeräusche, die Ihnen Zugang zu genauen Umkehrsignalen geben. Der Indikator ist sehr einfach zu bedienen und hat nur einen Parameter, der für die Signalerzeugung verantwortlich ist. Sie können das Tool einfach an jedes Handelsinstr
Advanced Supply Demand
Bernhard Schweigert
4.92 (313)
Derzeit 33% Rabatt! Die beste Lösung für jeden Anfänger oder erfahrenen Händler! Dieser Indikator ist ein einzigartiges, qualitativ hochwertiges und erschwingliches Trading-Tool, da wir eine Reihe von proprietären Funktionen und eine neue Formel integriert haben. Mit diesem Update werden Sie in der Lage sein, doppelte Zeitrahmenzonen anzuzeigen. Sie können nicht nur einen höheren TF (Zeitrahmen) anzeigen, sondern sowohl den Chart-TF als auch den höheren TF: SHOWING NESTED ZONES. Alle Supply Dema
Trend Screener
STE S.S.COMPANY
4.83 (88)
Trendindikator, bahnbrechende, einzigartige Lösung für Trendhandel und -filterung mit allen wichtigen Trendfunktionen in einem Tool! Es handelt sich um einen 100 % nicht neu zu malenden Multi-Timeframe- und Multi-Währungs-Indikator, der für alle Symbole/Instrumente verwendet werden kann: Forex, Rohstoffe, Kryptowährungen, Indizes und Aktien. Trend Screener ist ein effizienter Trendfolgeindikator, der Pfeiltrendsignale mit Punkten im Diagramm liefert. Die Funktionen, die im Trendanalysator-Indika
M1 Arrow
Oleg Rodin
5 (14)
Eine Intraday-Strategie, die auf zwei Grundprinzipien des Marktes basiert. Der Algorithmus basiert auf der Analyse von Volumina und Preiswellen mit zusätzlichen Filtern. Der intelligente Algorithmus des Indikators gibt nur dann ein Signal, wenn sich zwei Marktfaktoren zu einem vereinen. Der Indikator berechnet Wellen eines bestimmten Bereichs auf dem M1-Diagramm unter Verwendung der Daten des höheren Zeitrahmens. Und um die Welle zu bestätigen, verwendet der Indikator eine Volumenanalyse. Dieser
Wir stellen vor       Quantum Trend Sniper Indicator   , der bahnbrechende MQL5-Indikator, der die Art und Weise, wie Sie Trendumkehrungen erkennen und handeln, verändert! Entwickelt von einem Team erfahrener Händler mit über 13 Jahren Handelserfahrung,       Quantum Trend Sniper-Indikator       wurde entwickelt, um Ihre Trading-Reise mit seiner innovativen Methode zur Identifizierung von Trendumkehrungen mit extrem hoher Genauigkeit auf ein neues Niveau zu heben. ***Kaufe Quantum Trend Snipe
FX Volume
Daniel Stein
4.6 (35)
Erhalten Sie Ihr tägliches Marktupdate mit Details und Screenshots über unser Morning Briefing hier auf mql5 und auf Telegram ! FX Volume ist der ERSTE und EINZIGE Volumenindikator, der einen ECHTEN Einblick in die Marktstimmung aus Sicht eines Brokers bietet. Es bietet fantastische Einblicke in die Positionierung von institutionellen Marktteilnehmern, wie z.B. Brokern, auf dem Forex-Markt, viel schneller als COT-Berichte. Diese Informationen direkt auf Ihrem Chart zu sehen, ist der wahre Game
TakePropips Donchian Trend Pro
Eric John Pajarillaga Aldana
4.82 (17)
TakePropips Donchian Trend Pro   (MT4) ist ein leistungsstarkes und effektives Tool, das mithilfe des Donchian-Kanals automatisch die Richtung des Trends erkennt und Ihnen Handelssignale für den Ein- und Ausstieg liefert! Dieser Multifunktionsindikator umfasst einen Trendscanner, Handelssignale, ein statistisches Panel, einen Screener, Handelssitzungen und ein Dashboard für den Verlauf von Warnungen. Es wurde entwickelt, um Ihnen Handelssignale zu liefern und Ihnen Stunden beim Analysieren der C
Quantum Breakout Indicator PRO
Bogdan Ion Puscasu
4.96 (26)
Wir stellen vor       Quantum Breakout PRO   , der bahnbrechende MQL5-Indikator, der die Art und Weise, wie Sie mit Breakout-Zonen handeln, verändert!   Quantum Breakout PRO   wurde von einem Team erfahrener Händler mit über 13 Jahren Handelserfahrung entwickelt und soll Ihre Handelsreise mit seiner innovativen und dynamischen Breakout-Zonen-Strategie auf ein neues Niveau bringen. Der Quantum Breakout Indicator zeigt Ihnen Signalpfeile auf Breakout-Zonen mit 5 Gewinnzielzonen und Stop-Loss
DERZEIT 31% RABATT! Die beste Lösung für jeden Newbie oder Expert Trader! Dieser Indikator ist ein einzigartiges, qualitativ hochwertiges und erschwingliches Handelsinstrument, da wir eine Reihe von proprietären Funktionen und eine geheime Formel eingebaut haben. Mit nur EINEM Chart liefert er Alerts für alle 28 Währungspaare. Stellen Sie sich vor, wie sich Ihr Handel verbessern wird, weil Sie in der Lage sind, den genauen Auslösepunkt eines neuen Trends oder einer Scalping-Gelegenheit zu e
Indicator : RealValueIndicator Description : RealValueIndicator is a powerful tool designed specifically for trading on the EURUSD pair. This indicator analyzes all EUR and USD pairs, calculates their real currency strength values, and displays them as a single realistic value to give you a head start on price. This indicator will tell you moves before they happen if you use it right. RealValueIndicator allows you to get a quick and accurate overview of the EURUSD currency pair tops and bottoms,
Entdecken Sie das Geheimnis des erfolgreichen Forex -Handels mit unserem benutzerdefinierten MT4 -Indikator! Haben Sie sich jemals gefragt, wie Sie Erfolg auf dem Forex -Markt erzielen können und gleichzeitig Gewinne erzielen und gleichzeitig das Risiko minimieren können? Hier ist die Antwort, nach der Sie gesucht haben! Erlauben Sie uns, unseren proprietären MT4 -Indikator vorzustellen, der Ihren Handelsansatz revolutionieren wird. Einzigartige Vielseitigkeit Unser Indikator ist speziell
TrendDecoder Premium
Christophe Pa Trouillas
5 (6)
Identifizieren Sie Bereiche und die nächsten wahrscheinlichen Bewegungen   |  Erhalten Sie früheste Signale und die Stärke von Trends   |  Klare Ausstiegssignale vor Umkehrung   |  Erkennen Sie die Fibo-Levels, die der Kurs testen wird Indikator, der nicht zurückverfolgt, nicht verzögert - ideal für den manuellen und automatisierten Trading - geeignet für alle Vermögenswerte und Zeiteinheiten Zeitlich begrenztes Angebot   >> 50% OFF Nach dem Kauf,   bitte kontaktieren Sie mich auf diesem Kanal  
ICT, SMC, SMART MONEY CONCEPTS, SMART MONEY, Smart Money Concept, Support and Resistance, Trend Analysis, Price Action, Market Structure, Order Blocks, BOS/CHoCH,   Breaker Blocks ,  Momentum Shift,   Supply&Demand Zone/Order Blocks , Strong Imbalance, HH/LL/HL/LH,    Fair Value Gap, FVG,  Premium  &   Discount   Zones, Fibonacci Retracement, OTE, Buy Side Liquidity, Sell Side Liquidity, BSL/SSL Taken, Equal Highs & Lows, MTF Dashboard, Multiple Time Frame, BigBar, HTF OB, HTF Market Structure, 
Up down v6T
Guner Koca
5 (1)
Thise indicator is up down v6  comes with tradingwiev pinescript. purchased people, after installed on terminal ,contact me on mql5  to get BONUS  TradingView pinescript. up-down indicator is no repaint and works all pairs and lower than weekly time frames charts. it is suitable also 1 m charts for all pairs. and hold long way to signal. dont gives too many signals. when red histogram cross trigger line that is up signal.and price probably will down when blue histogram cross trigger line that
ECM Channel MT4
Paulo Rocha
5 (1)
ECM Elite Channel is a volatility-based indicator, developed with a specific time algorithm, which consists of finding possible corrections in the market. This indicator shows two outer lines, an inner line (retracement line) and an arrow sign, where the channel theory is to help identify overbought and oversold conditions in the market. The market price will generally fall between the boundaries of the channel. If prices touch or move outside the channel, it's a trading opportunity. The
Weitere Produkte dieses Autors
EZT_Ichimoku_MTF Multitimeframe Ichimoku indicator. Display up to 4 different Ichimoku on the chart. Every line of every ichimoku is customizable, you can turn off/on or choose different thickness or color. You can choose to see only the cloud in multiple ichimokus. Optional info panel to identify the different Ichimokus. Works the same way like the original Ichimoku indicator.
EZT Trend
Tibor Rituper
4 (1)
Der EZT-Trendindikator zeigt Ihnen den Trend, den Rückzug und die Einstiegsmöglichkeiten. Optionale Filterung und alle Arten von Warnungen sind verfügbar. E-Mail- und Push-Benachrichtigungsbenachrichtigungen werden hinzugefügt. Wir entwickeln auch einen EA basierend auf diesem Indikator, der bald verfügbar sein wird. Es handelt sich um einen multifunktionalen Indikator, der aus zwei Farbhistogrammen und einer Linie besteht. Es handelt sich um eine visuelle Darstellung der Richtung und Stärke
The FREE version works on Demo account and only CADCHF and NZDCHF pairs. The indicator predict the future candles direction, by scanning past candle movement. Based on the principal: “ The history repeat itself”. Programmed according to Kendall Correlation. In the settings menu, different scanning options are available. When the indicator find a match, start painting future candles from the current candle to the right, also from the current candle to the left as well, showing you the candle
FREE
EZT MultiTF MACD
Tibor Rituper
5 (8)
This indicator can display 1 or 2 MACD indicator on different time-frames and settings. Uses EMA for calculation. The active indicators can give visual and sound alert on zero-level-cross if the user choose that option. Alert can be set on one or both active indicator, even if the time-frame, and the period different on each. When alert set to both, the two MACD histogram must be on the same size of the 0 level to get an arrow. There is a display panel with buttons on the main chart, what is sho
FREE
EZT Bollinger Trendline Indicator based on multiple settings of Bollinger Band. In the menu you can choose the similar settings than bollinger band indicator. Trend period and trend deviations. Also paint and arrow on chart when direction change. Three different kind of alert , such as pop up, e-mail and push notification. Try different settings on different timeframes. Please help my work and rate and comment my products!
FREE
This is a free version of our Great tool with limited functions. The ChartChanger is a great utility tool to reduce the number of open charts on your terminal. There is three section to it: Symbols, Time frames and Templates. You need only one chart to be open and still you can scroll up to multiple ones. Symbols: With the push of a button you can change from one symbol to another, and your applied indicators will stay on the next chart. For the symbols there is an auto detection mode, or you ca
FREE
This indicator can display 1-6 RSI indicator on different timeframes and settings. The active indicators can give visual and sound alert on oversold/overbought level if the user choose that option. Alert can be set on one or all active indicator, even if the timeframe, the period and the oversold/overbought level different on each.There is a display panel with buttons on the main chart, what is show the active indicators and their settings.There is an option to hide this panel. With the buttons
This indicator can display 1-3 CCI indicator on different time frames and settings. The active indicators can give visual and sound alert on oversold/overbought level if the user choose that option. Alert can be set on one or all active indicator, even if the time frame, the period and the oversold/overbought level different on each. There is a display panel with buttons on the main chart, what is show the active indicators and their settings. There is an option to hide this panel. With the butt
Der ChartChanger ist ein großartiges Hilfsprogramm, um die Anzahl geöffneter Karten auf Ihrem Terminal zu reduzieren. Es gibt drei Abschnitte: Symbole, Zeitrahmen und Vorlagen. Es muss nur ein Diagramm geöffnet sein und Sie können dennoch zu mehreren Diagrammen scrollen. Symbole: Mit einem Knopfdruck können Sie von einem Symbol zum anderen wechseln und Ihre angewendeten Indikatoren bleiben im nächsten Diagramm erhalten. Für die Symbole gibt es einen automatischen Erkennungsmodus, oder Sie können
Dies ist eine Pin-Bar-Alarmanzeige für mehrere Zeitrahmen. Sie können nur den aktuellen Zeitrahmen oder alle Zeitrahmen von 1 Minute bis zum Monat verwenden. Wenn Sie alle Zeitrahmen auswählen, erhalten Sie eine Benachrichtigung über den aktuellen Zeitrahmen, in dem Ihr Diagramm geöffnet ist, und über die oben genannten Zeitrahmen. Für jeden ausgewählten Zeitrahmen gibt es separate Popup-, E-Mail- und Push-Benachrichtigungen. Der Indikator platziert einen Pfeil auf dem Preisdiagramm. Bei
Dies ist ein Kerzenalarmindikator mit mehreren Zeitrahmen. Sie können nur den aktuellen Zeitrahmen oder alle Zeitrahmen von 1 Minute bis zum Monat verwenden. Dies ist ein nicht neu streichbarer MTF-Indikator. Wenn Sie die ausgewählte Zeitrahmenoption (MultiTimeframe-Modus) verwenden, können Sie Signale im tatsächlichen aktuellen Zeitrahmen und darüber sehen. Für jeden ausgewählten Zeitrahmen gibt es separate Popup-, E-Mail- und Push-Benachrichtigungen. Der Indikator platziert einen Punk
This is a great utility tool to see valuable information on your chart. The panel is free-floating, grab with your mouse and move around on the chart with ease. Also the panel is collapsible so you can save space, and you can see only the information you wish. There is three section to the panel, when is closed you can see the top section only. Here the list of information you can see on the panel, from the top to bottom: The first part of the panel: Price : The color is changing according to
EZT Stochastic
Tibor Rituper
5 (2)
EZT_Stochastic   This is a Multi Timeframe stochastic indicator, with colored background. The colored background can be set to different colors based on the K and D line, (moving up, or down), and also about the position of the lines. In the oversold or overbought zones you can choose different colors.   Settings: You can choose the time-frame you want to see the stochastic. Set the regular parameters in a same way like in the original stochastic. Histogram style: The style. Histogram width: The
EZT Trade History This is a great tool to analyze past trades or follow current ongoing trades, especially when you using an EA to manage your transactions. You will see the exact candle where the trade was opened and closed. Collapsible floating panel on the chart, free to move anywhere with your mouse. When you using multiple EA’s with different magic numbers, you have 5 options to separate those trades, so you will know which EA opened specific transactions. You can set the day limits how fa
The indicator predict the future candles direction, by scanning past candle movement. Based on the principal: “ The history repeat itself”. Programmed according to Kendall Correlation. In the settings menu, different scanning options are available. When the indicator find a match, start painting future candles from the current candle to the right, also from the current candle to the left as well, showing you the candle pattern what the actual signal is based on. The left side candle are option
Auswahl:
Larrydeelf
469
Larrydeelf 2024.03.07 17:07 
 

after watching the indicator perform this week I can say that this is a very good indicator it help me verify on my direction regarding price movement great job.

intan08
1381
intan08 2021.07.28 09:08 
 

Worth every penny.

Lasse Michael Holm
1318
Lasse Michael Holm 2020.05.20 01:44 
 

At last, a MACD indicator that works for me. Love the MTF capabilities and the possibilities for divergens on chart. Just grab this one 😃👍

Muhammet Simsek
925
Muhammet Simsek 2018.07.02 09:19 
 

Very good!

Antwort auf eine Rezension
Version 1.12 2021.11.24
Compatibility update.
Version 1.10 2018.07.11
Issue with objects is fixed.