DEMA Trend
- Indikatoren
- Pavel Gotkevitch
- Version: 1.1
- Aktualisiert: 25 März 2022
- Aktivierungen: 5
The DEMA Trend indicator is based on two DEMA (Double Exponential Moving Average) - fast and slow.
The advantage of the DEMA moving average is that it eliminates false signals at the saw-toothed price movement and allows saving a position at a strong trend.
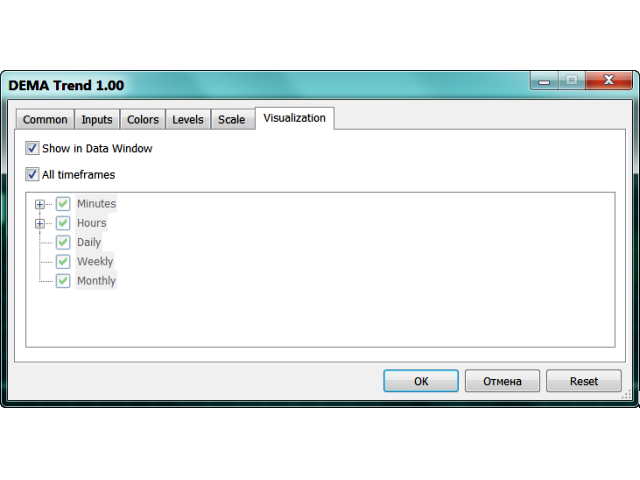
The indicator allows determining the direction and strength of the trend, and it can work on any timeframe.
Uptrends are shown by blue color of the indicator line, downtrends by the red color.
Close a short position and open a long one if the line color changes from red to blue.
Close a long position and open a short one if the line color changes from blue to red.
Use a small stop loss, as the line itself may suddenly change its color and direction.
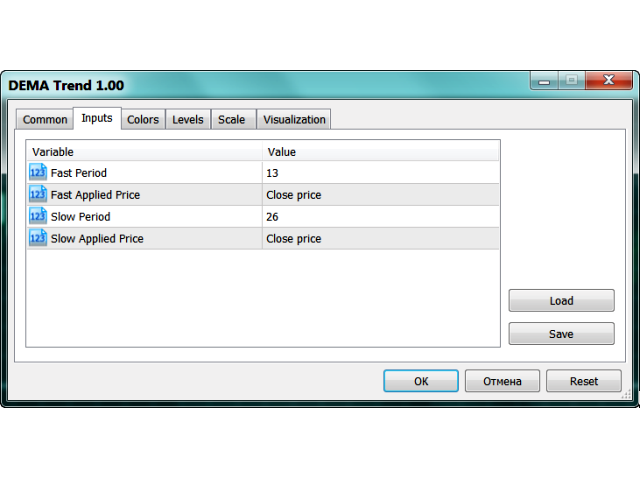
The following can be set in the DEMA indicator's Inputs tab:
- period (Fast Period, Slow Period);
- price used calculations (Close, Open, High, Low, Median, Typical, Weighted).
The Colors tab allows to choose the color, width and line style of the indicator.
Parameters
- fast period - number of bars used for fast DEMA calculation;
- fast applied price - applied price type for the fast DEMA;
- slow period - number of bars used for slow DEMA calculation;
- slow applied price - applied price type for the slow DEMA.


Der Benutzer hat keinen Kommentar hinterlassen