Force Multi
- Indikatoren
- Dmitriy Susloparov
- Version: 1.1
- Aktualisiert: 17 November 2021
- Aktivierungen: 5
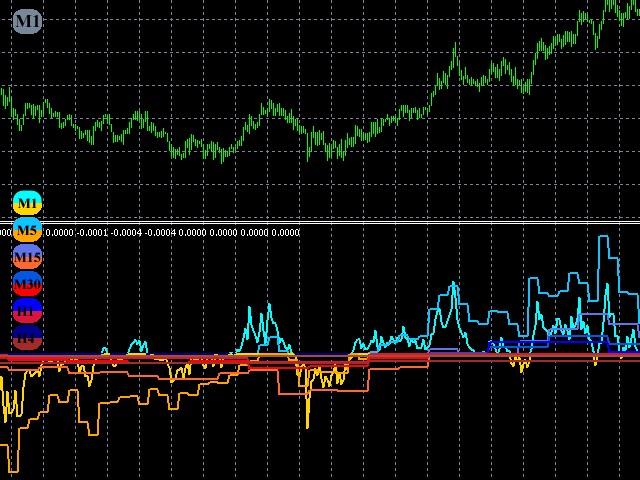
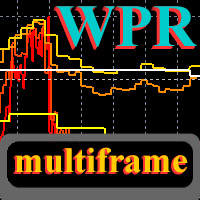
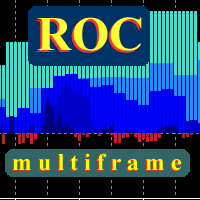
This is a multitimeframe version of the popular Force index oscillator.
Interpretation of the conventional version of the indicator is relatively complex, therefore, its multitimeframe representation is especially relevant. Monitoring different periods becomes comfortable and the indicator turns out to be more informative. It provides the ability to show or hide any graphs, from minute to daily inclusive. It is also possible to select the oscillator plotting style: line, section or histogram.
You can also freely switch both towards the higher and smaller timeframes. At the same time, all selected graphs will be correctly converted to the current time scale.
To improve the indicator readability, lowering coefficients are applied to the higher timeframes so that the lower graphs remain dominant.
The indicator is tested on Just2trade
Parameter of the indicator
- Period - averaging period of the Force index indicator
- Method - calculation method of the moving average
- Mode - oscillator plotting style
- M1 - show/hide the 1-minute graph
- M5 - show/hide the 5-minute graph
- M15 - show/hide the 15-minute graph
- M30 - show/hide the 30-minute graph
- H1 - show/hide the hourly graph
- H4 - show/hide the 4-hour graph
- D1 - show/hide the daily graph
