Mood
- Indikatoren
- Gevorg Hakobyan
- Version: 1.1
- Aktualisiert: 8 April 2020
- Aktivierungen: 10
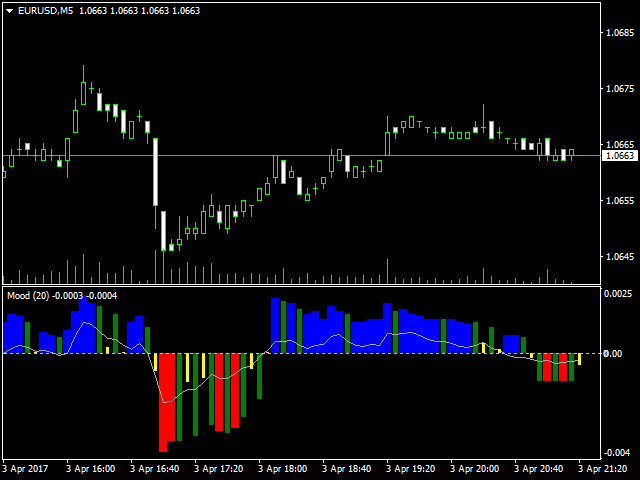
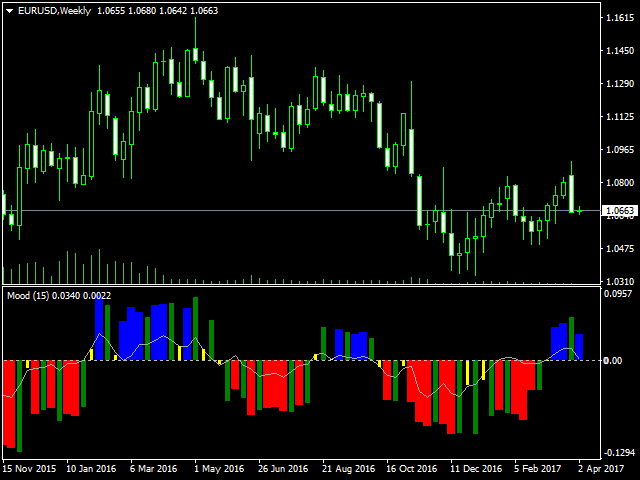
This indicator is designed for trend trading and it helps in determining the best entry points. To identify the points, it is necessary to follow the signal line. Once the line crosses the zero level upwards - buy, and when it crosses downwards - sell. In addition to the signal line, the indicator also displays the so-called market "mood" in real time in the form of a histogram. The indicator works on all timeframes and with all instruments. The indicator operation required the Moving Average indicator to be available in the terminal. The indicator is very easy to use, simply follow the signal line. The histograms are intended to confirm the trend. The blue color of the histogram means the formation of an uptrend, red - downtrend. Yellow histogram indicates all kinds of further development of the price, namely, uncertainty. When the green histogram has a positive value, a correlation of the uptrend is currently being formed. And when the green histogram has a negative value - a correlation of the downtrend. In order to determine the trend and correlations, the indicator uses the candlestick analysis, Highs and Lows for the selected period and a proprietary algorithm, identifying probable reversals. The calculations start from the historical High or Low on the current timeframe, and the histogram displays the uncertainty areas prior to that. This makes the indicator more efficient and facilitates the filtering of short-term signals.
Features
- Minimization of the false and short-term signals
- Does not lag
- Does not redraw (after candle closes)
- Works in real time
- Easy to use
Input Parameter
- Period - period, the number of bars/candles for indicator calculations (minimum 2)

