Gartley Projection D
- Indikatoren
- Oleksandr Medviediev
- Version: 3.23
- Aktualisiert: 22 August 2017
- Aktivierungen: 20
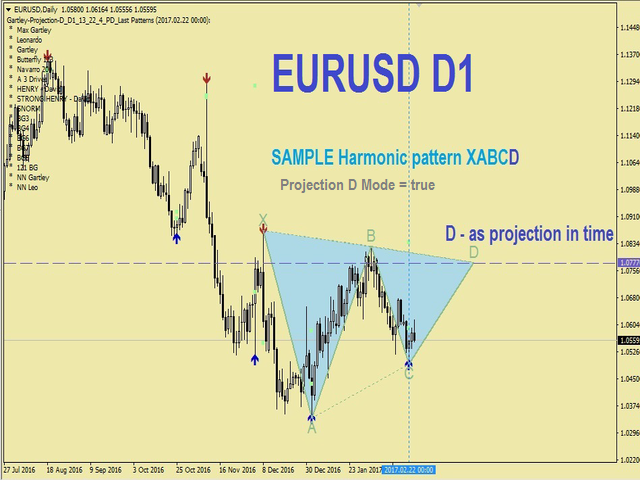
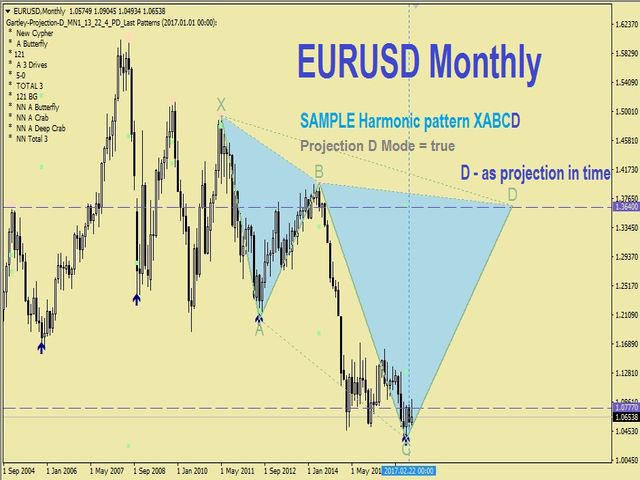
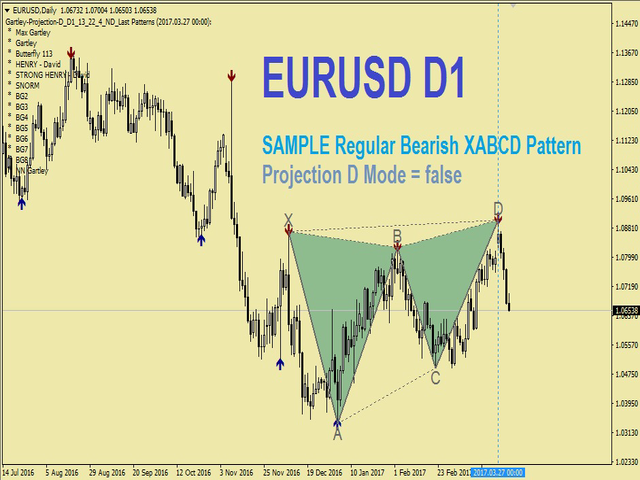
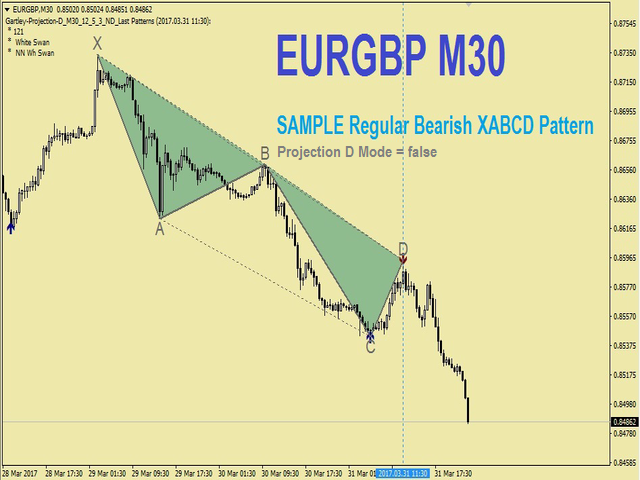
Der Indikator identifiziert die harmonischen Muster (XABCD) gemäß den Entwicklungen von H.M. Gartley („Profits in the Stock Market“, 1935г).
Der D-Punkt wird als Punkt in der perspektivischen Projektion projiziert (geben Sie in den Einstellungen ProjectionD_Mode = true an).
Wird nicht neu gezeichnet. Wenn ein Balken des Arbeitszeitraums schließt und sich der identifizierte Musterpunkt während der Balken von Patterns_Fractal_Bars nicht bewegt hat, erscheint ein Pfeil auf dem Diagramm (in Richtung der erwarteten Preisbewegung). Von diesem Moment an bleibt der Pfeil dauerhaft auf dem Diagramm.
2-3 und mehr Pfeile hintereinander – dies verändert die Marktbedingungen, NICHT neu streichen/neu zeichnen (Zeitrahmen dürfen nicht hin- und herwechseln).
HINWEIS: 2-3 oder mehr Pfeile hintereinander – dies verändert die Marktbedingungen, NICHT eine Neuzeichnung.
Die Gesamtzahl der Muster beträgt 85 (einschließlich Gartley-222 und Gartley-222WS; die vollständige Liste ist im Abschnitt „Kommentare“ verfügbar). Von allen identifizierten Mustern wird nur das zuletzt identifizierte Muster mit einer Volltonfarbe gefüllt.
Parameter
DrawPatterns (true/false) – Zeichne ein Muster mit einer Volltonfarbe
ProjectionD_Mode (true/false) – Modus zum Definieren des D-Punkts als perspektivische Projektion
Patterns_Fractal_Bars – die Anzahl der Arbeitszeitrahmen-Balken, während derer der zuletzt identifizierte Musterpunkt fixiert bleiben muss, damit er als gebildetes Fraktal betrachtet wird (auf dem Diagramm erscheint ein Pfeil)
Patterns_Deviation – zulässige prozentuale Abweichung von den Referenzwerten der Seitenproportionen in einem Muster (erlaubter Wertebereich)
Patterns_XA_MinLength_Bars – die minimal zulässige Anzahl von Balken im Anfangssegment XA
Patterns_XA_MinHeight_Points – die minimal zulässige Größe des Anfangssegments XA in Punkten
ZigZag_Depth – Parameter des ZigZag-Indikators
ZigZag_Deviation – Parameter des ZigZag-Indikators
ZigZag_Backstep – Parameter des ZigZag-Indikators
ShowInfo (true/false) – zeigt die Liste der identifizierten Muster auf der linken Seite des Diagramms an
PrintInfo (true/false) – Informationen im Protokoll ausdrucken


Updated review: I rented this indicator awhile back but came back to started using it once again because if you really study these patterns use both True and False settings it will allow you to see the whole picture of the particular pair you're trading.........This is just the way i like to use it following the False setting to trade but also using the True setting to be able to calculate my exit area to take profit at........Simply the best out there recommend is 1,000%!!! Thanks for your hard work on this huge winner, Oleksandr!!
Awesome Indicator, Great Work!! Truly no repainting arrows plus nice Gartley patterns respecting prices as far as I can see I can't wait to use it long term but short term I've had it already had a couple of winners following longer 1h,4h time frames THANKS!