RSI Panel MTF
- Indikatoren
- Yurij Izyumov
- Version: 2.3
- Aktualisiert: 18 Januar 2022
- Aktivierungen: 20
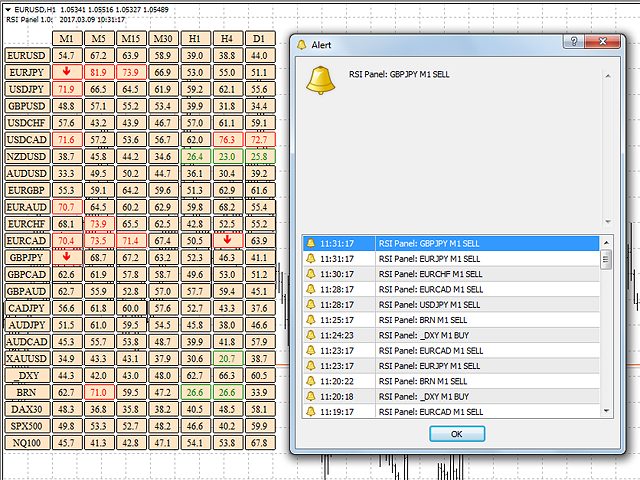
The RSI Panel MTF indicator has been created in order to have the ability to monitor the values of the standard RSI indicator from a multitude of timeframes and symbols on a single chart, as well as to receive timely notifications about the trading opportunities using an audio signal or a notification.
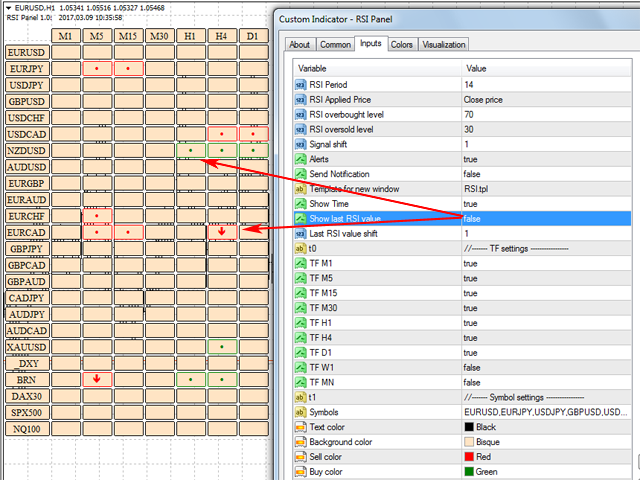
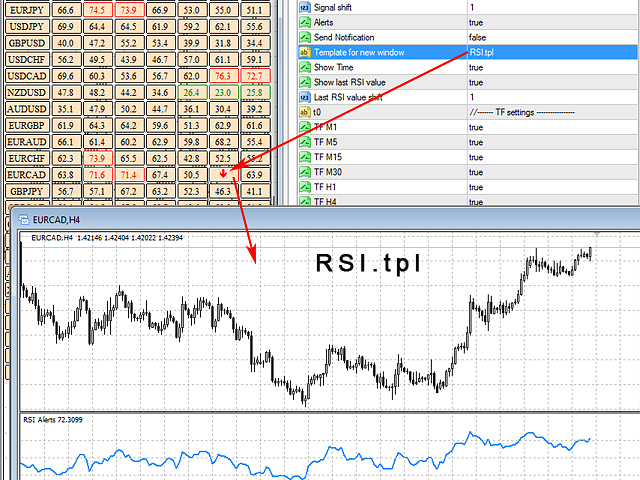
The indicator can output both the indicator values, and only the indicator signals (confirmed and expected). A user-friendly feature for selecting the required symbol has been implemented - simply click a cell of the signals table, and a new window with the selected symbol and timeframe will be opened. In addition, the indicator template selected in the settings will be automatically applied to this window (see the demo video).
Currently implemented signals
- indicator crossing the overbought level downwards, the level is set in the settings;
- indicator crossing the oversold level upwards, the level is set in the settings.
If it is necessary to monitor the RSI crossing other levels - 50, oversold and overbought - use the RSI Alerts indicator, but it can only monitor one symbol and timeframe on a single chart.
The indicator appearance can be customized to any color scheme of the charts.
Indicator parameters
- RSI Period - period of the RSI indicator;
- RSI Applied Price - price type to use for plotting the RSI indicator;
- RSI overbought level - overbought level (default: 70);
- RSI oversold level - oversold level (default: 30);
- Signal shift - number of the candle to take the values to generate signals (arrows and alerts);
- Alerts - enable/disable audio notifications with on-screen pop-up windows;
- Send Notification - send notifications to mobile terminals, with the MetaQuotes ID configured in advance ( how to do it);
- Start Hour for Alerts - The start time of Alerts and Notification, if Start Hour for Alerts is equal to End Hour for Alerts - then notifications will work without time limits.
- End Hour for Alerts - The end time of Alerts and Notification, if Start Hour for Alerts is equal to End Hour for Alerts - then notifications will work without time limits.
- Template for new window - name of the template to apply to the newly opened windows;
- Show Time - show the time and indicator name above the table;
- Show last RSI value - display the latest changes of the RSI indicator in the table. If false - only the arrows (signals) and dots (expected signals) will be drawn;
- Last RSI value shift - number of the candle to take the values of Show last RSI value, 0 = current candle, 1 = previous candle.
Timeframe settings
- TF M1 - enable the M1 timeframe;
- TF M5 - enable the M5 timeframe;
- TF M15 - enable the M15 timeframe;
- TF M30 - enable the M30 timeframe;
- TF H1 - enable the H1 timeframe;
- TF H4 - enable the H4 timeframe;
- TF D1 - enable the D1 timeframe;
- TF W1 - enable the W1 timeframe;
- TF MN - enable the MN timeframe;
Settings for expecting the overbought and/or oversold signals
- Crossed from the bottom up Max level (default 70)
- Crossed from top to bottom Max level (default 70)
- Crossed from the bottom up Min level (default 30)
- Crossed from top to bottom Min level (default 30)
- Crossed from the bottom up level 50
- Crossed from top to bottom level 50
SYMBOLS SETTINGS
- Symbols - symbols to collect the data from, separated by commas (example - EURUSD, EURJPY, USDJPY);
- Text color - color of the text in the table;
- Background color - color of the table background;
- Sell color - color of the sell signals;
- Buy color - color of the buy signals;
- Update time - the indicator update time (default is 1 second).

