Keltner RSI Linear Channels
- Indikatoren
- Igor Semyonov
- Version: 1.21
- Aktualisiert: 5 April 2020
- Aktivierungen: 8
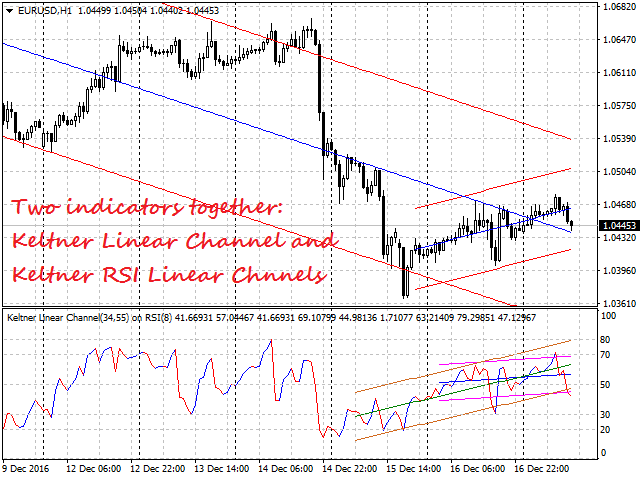
This is a color indicator of linear channel for RSI.
The indicator and its calculations are based on Keltner's methodology. It is used for making trading decisions and analyzing market sentiment.
Input parameters allow the user to customize the channel/channels.
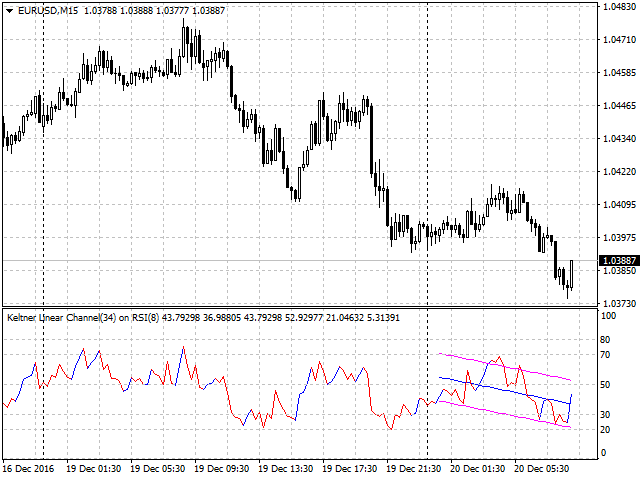
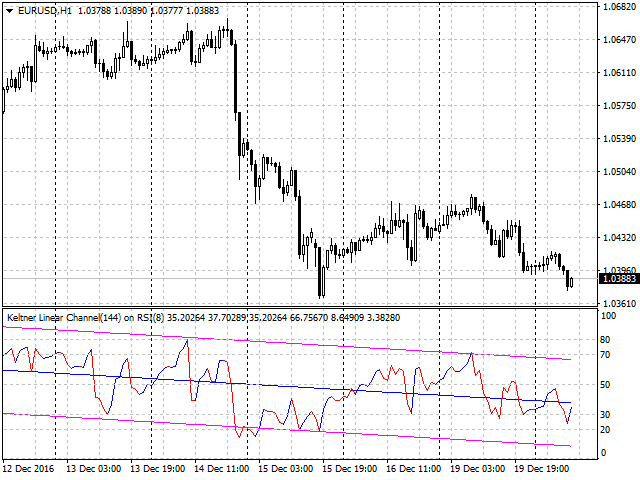
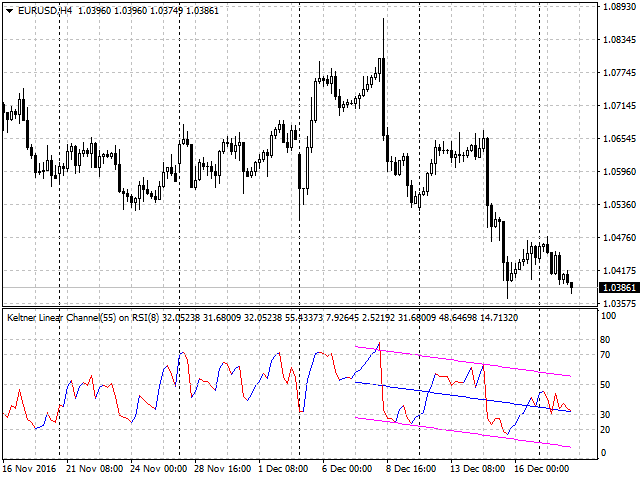
The indicator allows drawing two channels on a single chart of the RSI indicator.
Possible options for channel drawing are shown in the screenshots.
Purpose
The indicator can be used for manual or automated trading within an Expert Advisor. Values of indicator buffer of the double type can be used for automated trading:
- The RSI indicator line - buffer 0.
- The middle line of the first channel - buffer 1.
- The line of the bullish RSI sentiment - buffer 2.
- The line of the bearish RSI sentiment - buffer 3.
- The upper border line of the first channel - buffer 4.
- The bottom border line of the first channel - buffer 5.
- The middle line of the second channel - buffer 7.
- The upper border line of the second channel - buffer 8.
- The bottom border line of the second channel - buffer 9.
The values of the indicator buffers connected with linear channels must not be equal to zero.
The values of the indicator buffers connected with the RSI indicator must not be equal to EMPTY_VALUE.
Input Parameters
- Two Channels - drawing two channels:
- true - yes.
- false - no.
- Colored Basic Indicator - coloring of the bullish and bearish sentiment of RSI:
- true - yes.
- false - no.
- Bars Number - the number of bars for the calculation of the first channel.
- Bars Number 2 - the number of bars for the calculation of the second channel.
- Calculation Method - channel calculation method:
- Keltner_Basic - basic (Keltner).
- Kelner_Improved - improved (Keltner).
- Custom - using the following parameters.
- Channel Width Factor 1
- Channel Width Factor 2
- Custom ATR Period
- RSI Period
- MA Method - MA averaging method.
- Applied Price - price used for calculation.
- Shift - shift of the indicator in relation to the price chart.
