BaseLine Balance
- Indikatoren
- Petr Plechac
- Version: 1.2
- Aktualisiert: 22 November 2021
- Aktivierungen: 5
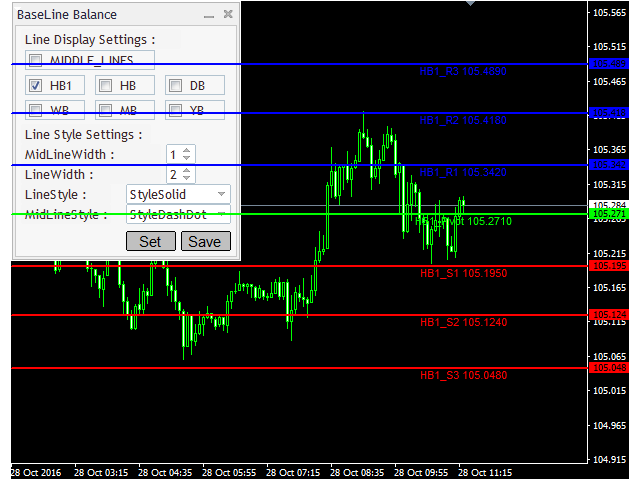
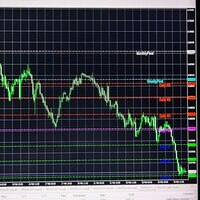
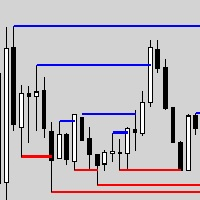
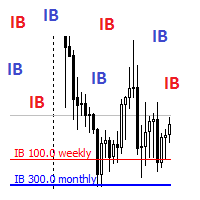
The Baseline Balance tool shows multiple pivot lines for short, mid and long time market cycles. Thus trader can easy identify local or global S/R (support/resistance) levels for better timing of investments and entries to the market. Due to the multifunctional menu directly on chart the settings is fast and accurate. Pivot lines are generated for H1, H4, Daily, Weekly, Monthly, Yearly timeshares.
Menu on chart shows following settings:
Line Display Settings
- Middle_Lines – shows middle calculation levels for selected time frame
- HB1 - shows pivot lines calculation, hour time frame
- HB - shows pivot lines calculation, four-hour time frame
- DB - shows pivot lines calculation, daily time frame
- WB - shows pivot lines calculation, weekly time frame
- MB - shows pivot lines calculation, monthly time frame
- YB - shows pivot lines calculation, yearly time frame
Line Style Settings
- MidLineWidth – setting of line width for middle lines
- LineWidth – setting of line width for pivot lines
- LinesStyle – setting of line style – solid, dot, dash , dot-and-dash
- MidLinesStyle – setting of line style – solid, dot, dash , dot-and-dash
Internal settings
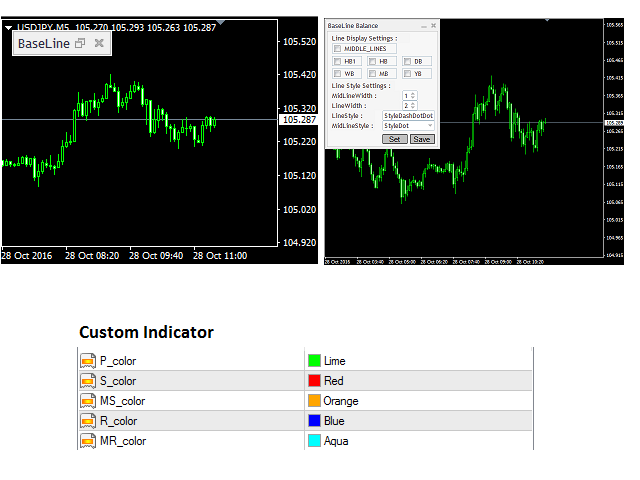
- P_color – color settings for main pivot lines
- S_color - color settings for support pivot lines
- MS_color - color settings for middle support lines
- R_color - color settings for resistance pivot lines
- MR_color - color settings for middle resistance lines
