FiboPlus MT5
- Indikatoren
- Sergey Malysh
- Version: 2.1
- Aktualisiert: 27 Juni 2017
- Aktivierungen: 5
Automatische Auflegung und Begleitung von Fibonacci-Retracements für Verkauf und Kauf für jedes Instrument (Symbol) und auf jedem Abschnitt des Graphs.
FiboPlus demonstriert:
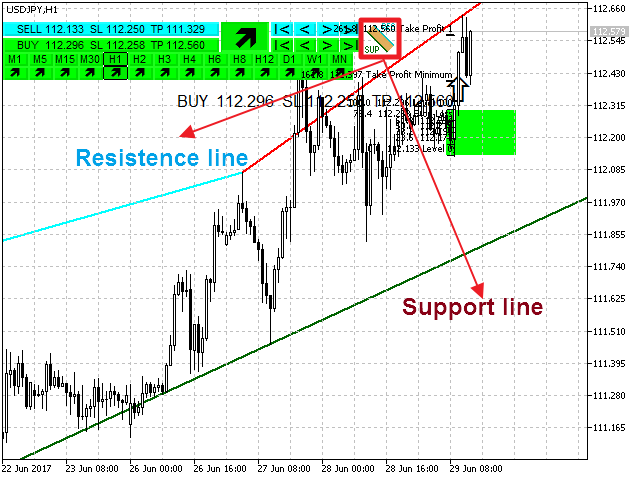
- Fibonacci-Retracements von möglichen Bewegungen des Preises hinauf oder hinab;
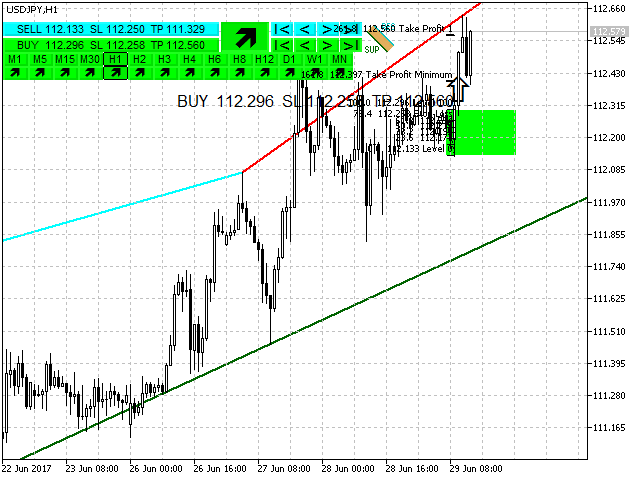
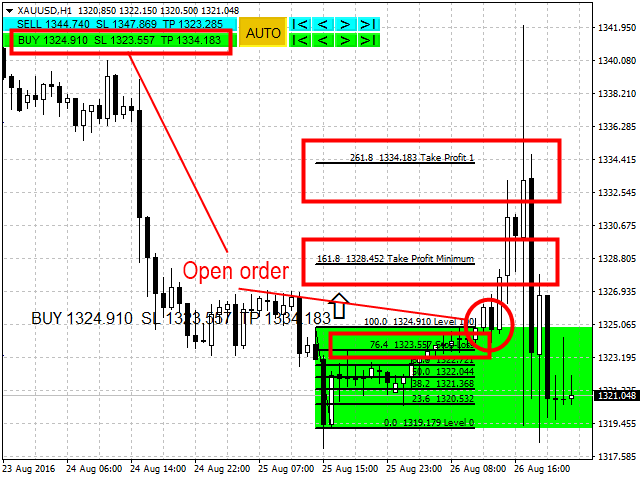
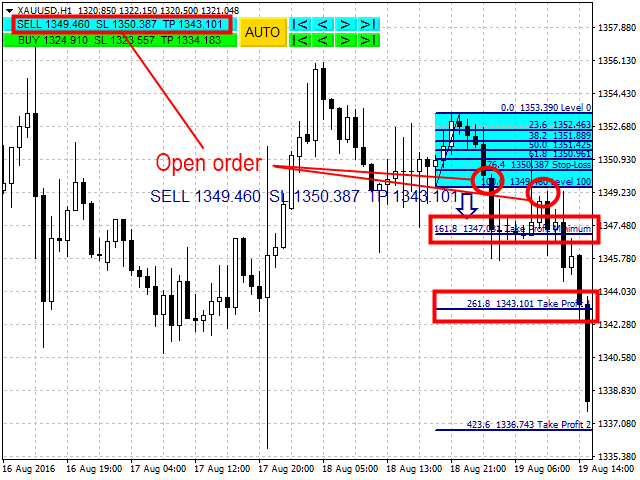
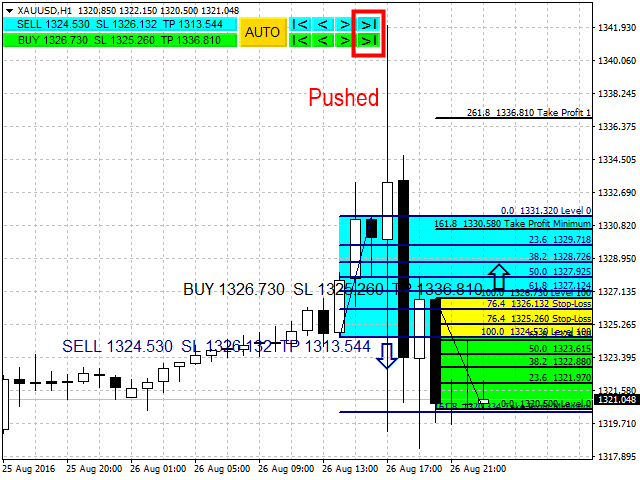
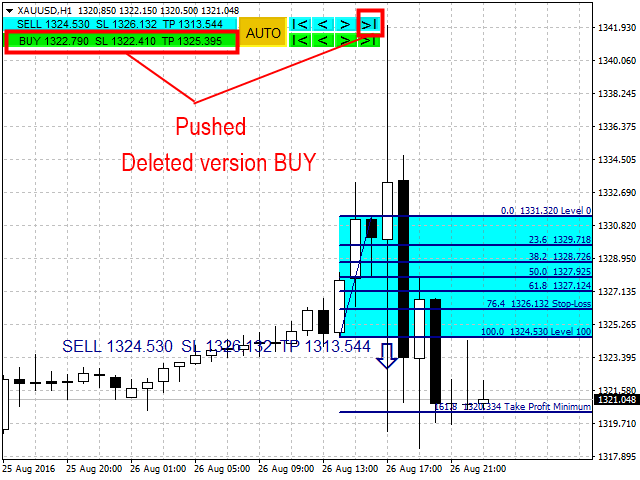
- Eintrittspunkte sind mit Symbolen "Zeiger nach oben", "Zeiger nach unten" gezeigt, die Information ist mit Drucktasten dubliert SELL, BUY;
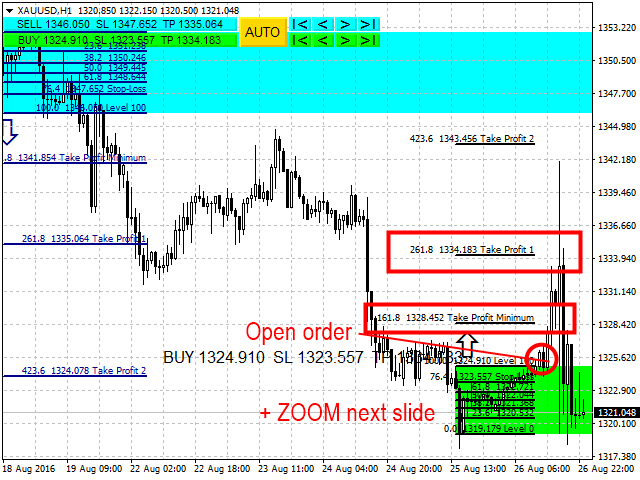
- rechteckiger Bereich, der durch Ebenen von 0 bis 100 begrenzt ist; Handel von einer Ebene zur anderen (kein Trend).
Besonderheiten
- Prognose der Preisbewegung, des Markteintrittspunkts, stop loss und take profit für Aufträge;
- fertiges Handelssystem;
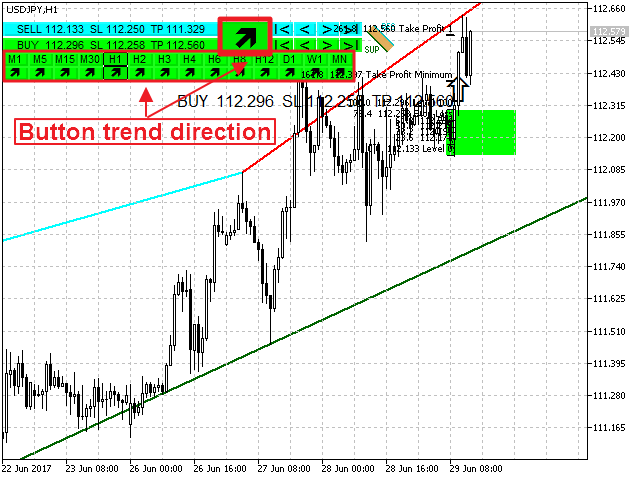
- Bedienungstasten lassen eine der Fibonacci-Varianten zu wählen;
- Variante für Verkauf oder Kauf zu verbergen;
- andere Abschnitte des Graphs zu sehen;
- mit Tasten «+» «-» kann der Graph vergrößert, verkleinert werden, dabei werden die Ebenen automatisch umgerechnet;
- verschiedene Fibonacci-Retracements;
- verschiedene Farbgebungen;
- Übertragung der Tasten in bequeme Bereiche des Graphs.
Parameter
- Language (Russian, English, Deutsch, Espanol, Portugues)
- Variantendes Auflegens von Fibonacci-Retracements:
- Best - nach Kerzen einer Farbe bis zur ersten Kerze der gegenteiligen Farbe;
- Standard - standardmäßige Auflegung;
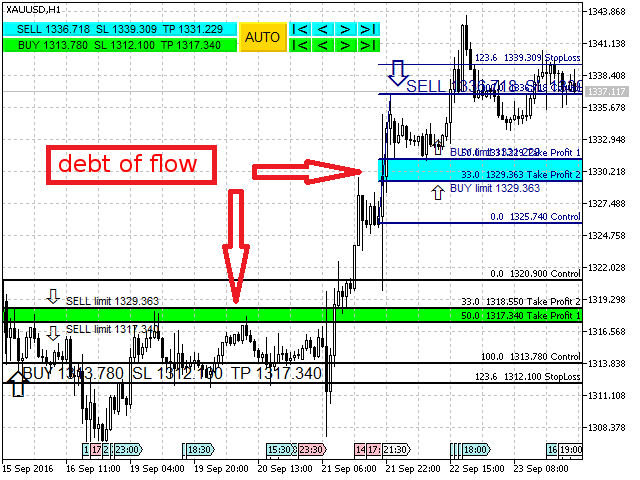
- debt of flow - sofortige Schuld des Market Makers, die bei Aktivierung von starken Markt-Deformationen erhalten wird.
- FarblichesSchema (voreingestellte Farben):
- White background - für weißen Hintergrund;
- Black background - für schwarzen Hintergrund;
- Custom background - Benutzereinstellungen aller Farben.
- FIBO Custom (wert der Retracements durch «,»)
- customcolors: Benutzereinstellungen der Farben;
- coordinatesX, Y buttons to snap pixels (koordinaten Х, Y zum Anknüpfen der Tasten an den Graph)
Tasten
- SELL. Variante des Markteintritts für Verkauf. Mit Drücken der Taste SELL kann man Fibonacci-Retracements für Verkauf verbergen/zeigen.
- |< Erste Variante des Markteintritts für Verkauf.
- < Vorherige Variante des Markteintritts für Verkauf.
- > Nächste Variante des Markteintritts für Verkauf.
- >| Letzte Variante des Markteintritts für Verkauf + automatische Begleitung.
- BUY. Variante des Markteintritts für Kauf. Mit Drücken der Taste BUY kann man Fibonacci-Retracements für Kauf verbergen/zeigen.
- |<Erste Variante des Markteintritts für Kauf.
- < Vorherige Variante des Markteintritts für Kauf.
- > Nächste Variante des Markteintritts für Kauf.
- >| Letzte Variante des Markteintritts für Kauf + automatische Begleitung.
- AUTO. Automatische Kalkulation und Begleitung im Markt neuer Fibonacci-Retracements für Kauf und Verkauf.
Handelssystem auf der Grundlage von Indikator FiboPlus
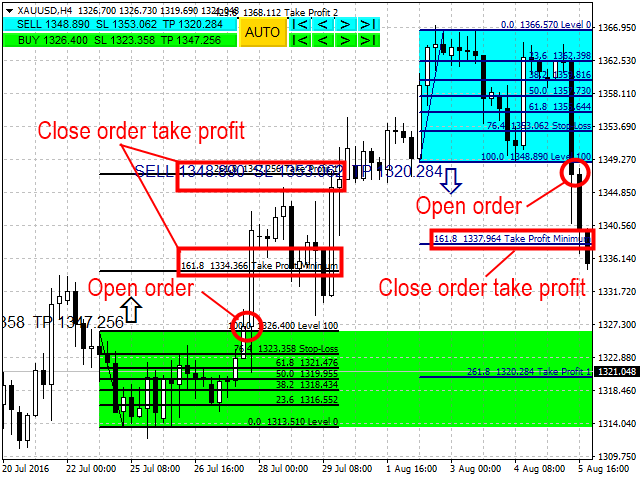
- Verkauf. Kerze hat sich unter der Ebene 100, stop loss über der Ebene 76.4 geschlossen, take profit minimum 161.8, take profit 1 - 261.8, take profit 2 - 423.6.
- Kauf. Kerze hat sich über der Ebene 100, stop loss unter der Ebene 76.4 geschlossen, take profit minimum 161.8, take profit 1 - 261.8, take profit 2 — 423.6.
- Kauf/Verkauf im rechteckigen Bereich, der durch Ebenen von 0 bis 100 begrenzt ist. Handel von einer Ebene zur anderen (kein Trend).
- Variante "debt of flow". FiboPlus legt Ebenen "debt of flow" des Market Makers auf, der Preis kehrt zu diesen Ebenen mit hoher Wahrscheinlichkeit zurück. Handel von der Ebene 100 bis take profit 1 - 50, take profit 2 - 33. Zweite Variante der Arbeit, Auflegung der weggelegten Limitaufträge auf den Ebenen 50% und 33% nach dem Trend.
Es wird empfohlen, vor Auflegung des Indikators auf den laufenden Graph des Instrumentes Daten zu aktualisieren (indem auf die Abschnitte konsequent gedrückt wird M1, M5, M15, M30, H1, H2, H3, H4, H6, H8, H12, D1, W1, MN).