• Übersicht
  • Bewertungen
  • Diskussion (5)
  • Neue Funktionen

PZ Chart Overlay

5

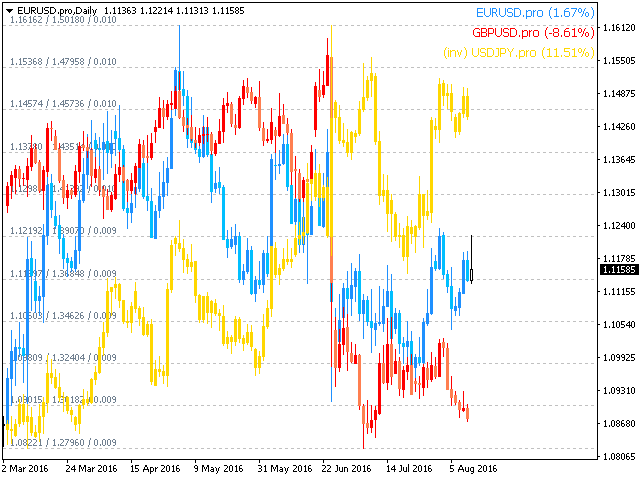
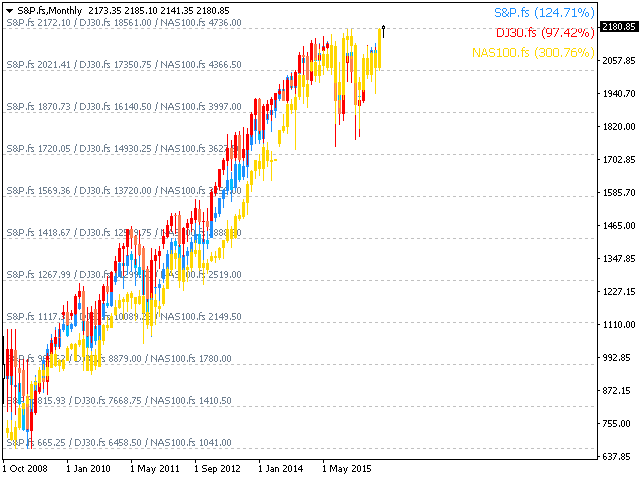
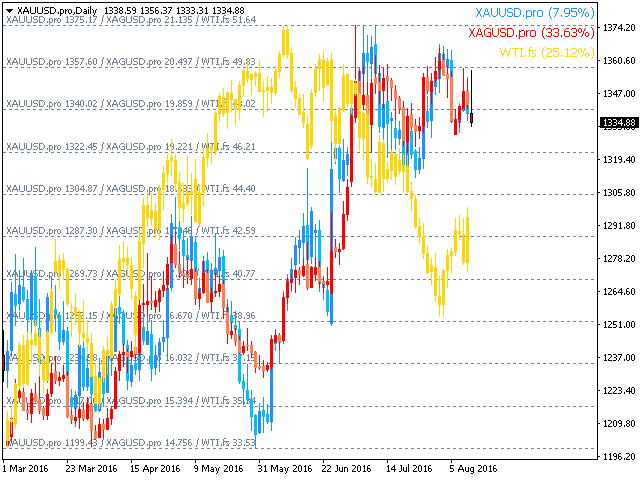
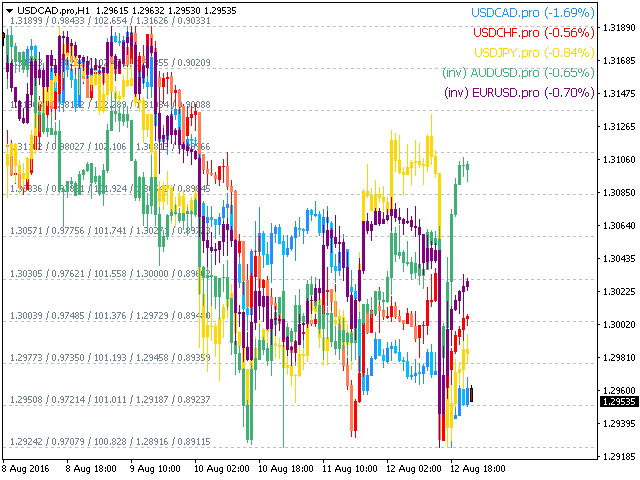
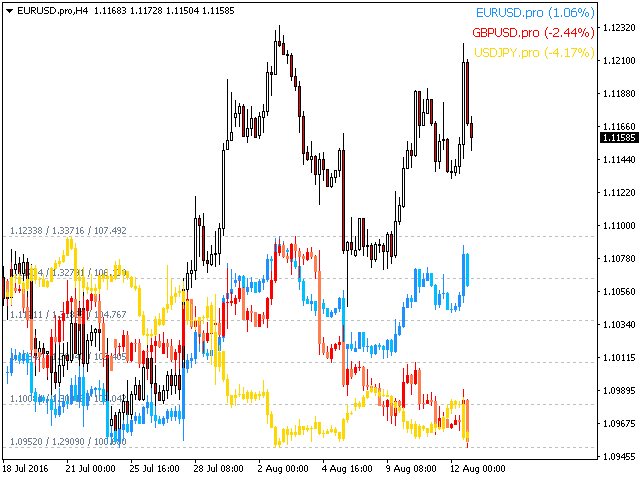
Der Chart-Overlay- Indikator zeigt die Kursbewegungen mehrerer Instrumente auf demselben Chart an, sodass Sie auswerten können, wie unterschiedlich die Währungspaare im Verhältnis zueinander schwanken.

[ Installationsanleitung | Update-Anleitung | Fehlerbehebung | FAQ | Alle Produkte ]

  • Finden Sie leicht überkaufte oder überverkaufte Währungspaare
  • Zeichnen Sie bis zu sechs Währungspaare auf ein und demselben Diagramm
  • Zeigen Sie bei Bedarf invertierte Symbole an
  • An Diagrammgröße, Zoom und Zeitrahmen anpassen
  • Automatische Berechnung des Preisniveaus
  • Anpassbare Preisniveaudichte
  • Anpassbare Farben und Größen


Was ist das Invertieren eines Währungspaares?

Ein Währungspaar umkehren bedeutet, den Wechselkurs zwischen zwei Währungen anzuzeigen, die die Hauptwährung der Transaktion umkehren. Wenn Sie beispielsweise EURUSD, GBPUSD und USDJPY in dasselbe Overlay-Diagramm zeichnen möchten, ist es sinnvoll, USDJPY zu invertieren, damit der Preis den inversen Kurs widerspiegelt: JPYUSD. Auf diese Weise bewegt sich der JPYUSD-Preis in positiver Korrelation mit den anderen beiden Symbolen des Overlay-Diagramms, wodurch das Diagramm leichter zu studieren ist.


Indikator testen

Dieser Indikator verwendet Kursdaten aus mehreren Symbolen, um auf einem einzigen Chart zu zeichnen. Da der MetaTrader 4 Tester (zum Zeitpunkt des Schreibens) keine Backtests für mehrere Währungen unterstützt, kann der Indikator nicht zurückgetestet werden, da er keine Anführungszeichen von den anderen Symbolen erhält, die überlagert werden sollen. Um es zu testen, leihen Sie es bitte für einen Monat.


Eingänge

  • Symboleinstellungen - Geben Sie die Namen der Währungspaare oder Symbole ein, die im Overlay-Diagramm angezeigt werden sollen. Sie müssen mindestens eines davon eingeben, damit das Overlay-Diagramm zwei Währungspaare (einheimisch und ausländisch) enthält. Wenn ein Symbol leer gelassen wird oder auf der Plattform nicht vorhanden ist, wird es ignoriert.
  • Einstellungen invertieren - invertiert das Diagramm und den Namen eines oben eingegebenen Währungspaares. Sie können beispielsweise USDJPY als JPYUSD anzeigen, wodurch der Indikator das Preisdiagramm invertiert, den inversen Wechselkurs berechnet und im Overlay-Diagramm entsprechend anzeigt.
  • Visuelle Einstellungen - Passen Sie die Anzahl der angezeigten Preislinien sowie die Farben und Größen für Etiketten und Linien an.


Autor

Arturo Lopez Perez, privater Investor und Spekulant, Softwareentwickler und Gründer von Point Zero Trading Solutions.

Empfohlene Produkte
Trade with Gann on your side!! MASTER CIRCLE 360 CIRCLE CHART, originally created by Gann admitted that this is “The Mother of all charts”. It is one of the last studies that this great trader left for us. The numeric tab le is apparently quite simple like all the tables and is based on square numbers, the SQUARE OF 12 and is by evolution, one of the most important square numbers. Here we can find CYCLE, PRICE AND TIME thanks to angles and grades, to show past and future support and resistance.
TWO PAIRS SQUARE HEDGE METER INDICATOR Try this brilliant 2 pairs square indicator It draws a square wave of the relation between your two inputs symbols when square wave indicates -1 then it is very great opportunity to SELL pair1 and BUY Pair2 when square wave indicates +1 then it is very great opportunity to BUY pair1 and SELL Pair2 the inputs are : 2 pairs of symbols         then index value : i use 20 for M30 charts ( you can try other values : 40/50 for M15 , : 30 for M30 , : 10 for H1 ,
Trend Deviation
VLADISLAV AKINDINOV
Trend indicator with calculation of dynamic levels and signaling their intersection. Description of input parameters: StepTF = true; - Calculation of the indicator by closing the bar (true) or by each tick (false) BarsCount = 300; - Number of settlement bars Price = PRICE_CLOSE; - Type of price used TimeFrame = PERIOD_CURRENT; - Estimated timeframe TrendPeriod = 9; - Trend calculation period TrendDeviations = 4.9; - coefficient of deviation PeriodTrendSmooth = 1; - Trend smoothing perio
Master Scalping M1 ist ein innovativer Indikator, der einen Algorithmus verwendet, um den Trend schnell und genau zu bestimmen. Der Indikator berechnet den Zeitpunkt zum Öffnen und Schließen von Positionen, die Indikatoralgorithmen ermöglichen es Ihnen, die idealen Zeitpunkte für den Einstieg in einen Handel (Kauf oder Verkauf eines Vermögenswerts) zu finden, was den Erfolg von Transaktionen für die meisten Händler erhöht. Vorteile des Indikators: Einfach zu bedienen, überladen Sie das Diagramm
Der DYJ BoS MT4-Indikator identifiziert und markiert automatisch die wesentlichen Elemente von Marktstrukturverschiebungen, darunter: Ausbruch aus der Struktur (BoS): Wird erkannt, wenn der Preis eine signifikante Bewegung macht und einen vorherigen Strukturpunkt durchbricht. Es markiert mögliche Aufwärtstrendlinien und Abwärtstrendlinien (UP & DN, d. h. kontinuierliche neue Hochs und neue Tiefs), und sobald der Preis diese Linien durchbricht, markiert es rote (BEAR) und grüne (BULL) Pfeile
What are Heiken Ashi Candles? Heiken Ashi, derived from the Japanese term 'Heikin Ashi,' translates to average price bars. It's an indicator depicting price bars on a chart. Formula for Heiken Ashi candles: - Heiken Ashi opening price: (previous candle's opening + closing price) / 2 - Closing price Heiken Ashi: (opening + high + low + closing) / 4 - Heiken Ashi peak: Max of high, opening, or closing price - Heiken Ashi bottom price: Min of low, opening, or closing price How to Read Heiken A
Noize Absorption Index MT4
Ekaterina Saltykova
5 (1)
Noize Absorption Index - is the manual trading system that measures the difference of pressure between bears forces and bulls forces. Green line - is a noize free index that showing curent situation. Zero value of index shows totally choppy/flat market.Values above zero level shows how powerfull bullish wave is and values below zero measures bearish forces.Up arrow appears on bearish market when it's ready to reverse, dn arrow appears on weak bullish market, as a result of reverse expectation. S
An indicator of pattern #31 ("Long Island") from Encyclopedia of Chart Patterns by Thomas N. Bulkowski. The second gap is in the opposite direction. Parameters: Alerts - show alert when an arrow appears   Push - send a push notification when an arrow appears (requires configuration in the terminal) GapSize - minimum gap size in points ArrowType - a symbol from 1 to 17 ArrowVShift - vertical shift of arrows in points   ShowLevels - show levels ColUp - color of an upward line ColDn - color of a
Owl smart levels
Sergey Ermolov
4.28 (36)
MT5-Version  |  FAQ Der   Owl Smart Levels Indikator   ist ein komplettes Handelssystem innerhalb eines Indikators, der so beliebte Marktanalysetools wie die   fortschrittlichen Fraktale von Bill Williams , Valable ZigZag, das die   richtige Wellenstruktur   des Marktes aufbaut, und   Fibonacci-Levels , die die genauen Einstiegslevels markieren, enthält in den Markt und Orte, um Gewinne mitzunehmen. Detaillierte Strategiebeschreibung Anleitung zur Verwendung des Indikators Berater-Assistent im
Infinity Trend Pro
Yaroslav Varankin
1 (1)
This is a trend indicator without redrawing Developed instead of the binary options strategy (by the color of the Martingale candlestick) Also works well in forex trading When to open trades (binary options) A signal will appear in the place with a candle signaling the current candle It is recommended to open a deal for one candle of the current timeframe M1 and M5 When a blue dot appears, open a deal up When a red dot appears, open a trade down. How to open trades on Forex. When a signal is rec
Point61 Indicator
Evgeniy Machok
5 (1)
The Point61 indicator is the result of many years of monitoring of price behavior of currency pairs and metals. It is not a secret, that in times of uncertainty, traders are looking for possible levels of support and resistance - the point, where price should stop its movement. There are 2 possible scenarios at these points: 1. Reverse (correction) to the opposite direction; 2. Breakthrough to continue movement. Very often these points are used to set stop orders - TakeProfit or StopLoss
Are you tired of the uncertainty that arises when your orders fail to stop at a specific line due to the spread? Look no further! Introducing our  indicator that plots candlesticks based on the Ask price instead of the traditional bid-based chart commonly used in MQL4. With this indicator, you can say goodbye to the frustrations caused by the bid-based chart, as it provides you with a more accurate representation of market movements. By utilizing the Ask price, which represents the price at whic
The indicator displays the data of the Stochastic oscillator from a higher timeframe on the chart. The main and signal lines are displayed in a separate window. The stepped response is not smoothed. The indicator is useful for practicing "manual" forex trading strategies, which use the data from several screens with different timeframes of a single symbol. The indicator uses the settings that are identical to the standard ones, and a drop-down list for selecting the timeframe. Indicator Paramet
All Symbols   AND  All Time frames Scan                                                                                                                 Document Introduction   The ABCD is a basic harmonic pattern. The ABCD pattern is a visual, geometric chart pattern comprised of three consecutive price swings. It looks like a diagonal lightning bolt and can indicate an upcoming trading opportu
Laguerre SuperTrend Clouds adds an Adaptive Laguerre averaging algorithm and alerts to the widely popular SuperTrend indicator. As the name suggests, Laguerre SuperTrend Clouds (LSC) is a trending indicator which works best in trendy (not choppy) markets. The SuperTrend is an extremely popular indicator for intraday and daily trading, and can be used on any timeframe. Incorporating Laguerre's equation to this can facilitate more robust trend detection and smoother filters. The LSC uses the impro
Trendiness Index
Libertas LLC
5 (3)
"The trend is your friend" is one of the best known sayings in investing, because capturing large trendy price movements can be extremely profitable. However, trading with the trend is often easier said than done, because many indicators are based on price reversals not trends. These aren't very effective at identifying trendy periods, or predicting whether trends will continue. We developed the Trendiness Index to help address this problem by indicating the strength and direction of price trend
RTrends
Nikolay Likhovid
The RTrends indicator does two things: first, it automatically draws the layout of the price chart by plotting trend lines and, secondly, it produces bearish and bullish signals. The layout reflects the fractal nature of the market. Trends from different time horizons are applied simultaneously on the chart. Thus, from a single chart a trader can see trend lines of higher timeframes. The lines, depending on the horizon, differ in color and width: the older the horizon, the thicker the line is. T
EZZ Elite Zig Zag is an indicator for the MetaTrader 4 terminal. This indicator traces the peak of the trend based on the market reversal, thus showing various opportunities in the financial market. EZZ Elite Zig Zag is a visual tool, intuitive, and easy to understand and use.  Test it Yourself by Downloading it for Free. Author Paulo Rocha all rights reserved
Daily Candle Predictor ist ein Indikator, der den Schlusskurs einer Kerze vorhersagt. Der Indikator ist in erster Linie für die Verwendung in D1-Charts gedacht. Dieser Indikator eignet sich sowohl für den traditionellen Devisenhandel als auch für den Handel mit binären Optionen. Der Indikator kann als eigenständiges Handelssystem oder als Ergänzung zu Ihrem bestehenden Handelssystem verwendet werden. Dieser Indikator analysiert die aktuelle Kerze und berechnet bestimmte Stärkefaktoren innerhalb
Dies ist der Rolling VWAP-Indikator für MetaTrader. Er berechnet den volumengewichteten Durchschnittspreis (VWAP) basierend auf dem Tickvolumen über eine bestimmte Anzahl von Kerzen, mit optionalen Standardabweichungsbändern für eine tiefere Marktanalyse. Dieser Indikator wird nicht neu gezeichnet und ist nicht verankert. Indikatorübersicht Berechnung des Rolling VWAP : Die Hauptlinie (aqua) berechnet den VWAP für eine bestimmte Anzahl von Balken ( barsToCalculate ). Dieser VWAP wird angepasst,
Trend Oscillator – ist ein erweiterter benutzerdefinierter Crypto_Forex-Indikator, ein effizientes Handelstool! - Es wird eine erweiterte neue Berechnungsmethode verwendet – 20 Optionen für den Parameter „Preis für Berechnung“. - Der sanfteste Oszillator, der je entwickelt wurde. - Grüne Farbe für Aufwärtstrends, Rote Farbe für Abwärtstrends. - Überverkaufte Werte: unter 5, überkaufte Werte: über 95. - Es gibt viele Möglichkeiten, selbst Standardstrategien mit diesem Indikator zu verbessern. -
Wave Wolf MT4
Andrei Salanevich
Der MT4 Wave Wold Forex Indikator wurde entwickelt, um Wulff-Wellen zu finden und sie im aktuellen Fenster des Handelsterminals anzuzeigen. Ein ausgezeichneter Indikator für Händler, die Wulff-Wellen im Handel verwenden. Seine Anwendung in Handelsstrategien wird ihre Effizienz und Rentabilität erheblich verbessern. INFORMATIONEN ZUM INDIKATOR Im Gegensatz zu anderen Wolfswellenindikatoren hat der MT4 Wave Wold Forex Indikator eine Reihe von Funktionen, die seine Effizienz erheblich verbessern:
Super Reversal Pattern
Parfait Mujinga Ndalika
Super Reversal Pattern Indicator Unlock the power of advanced pattern recognition with our Super Reversal Pattern Indicator. Designed for traders seeking precision and reliability, this indicator identifies one of the most effective reversal patterns in technical analysis, offering a significant edge in your trading strategy. Key Features: Non-Repainting Accuracy: Enjoy the confidence of non-repainting technology. Once a Super Reversal Pattern is detected, it remains static, providing consiste
Blahtech Market Profile
Blahtech Limited
4.53 (15)
Was: $249  Now: $149   Market Profile defines a number of day types that can help the trader to determine market behaviour. A key feature is the Value Area, representing the range of price action where 70% of trading took place. Understanding the Value Area can give traders valuable insight into market direction and establish the higher odds trade. It is an excellent addition to any system you may be using. Blahtech Limited presents their Market Profile indicator for the MetaTrader community. In
Kangaroo Tailz
Brenden Caleb Luebeck
Looking for an indicator that identifies high-probability price action patterns? Love counter-trend trading? The Kangaroo Tailz indicator might be just for you. This indicator is meant to be used as a reversal detector. I personally would rather enter a position at the beginning of a trend rather than catch the last couple of moves. This indicator does a good job of alerting when price may reverse by identifying price action patterns that occur frequently in markets. Even though this indicator i
Matrixs
Andriy Sydoruk
Matrix is a Forex arrow indicator. Displays signals simply and clearly! The arrows show the direction of the transaction, and are colored accordingly, which can be seen in the screenshots. As you can see, trading with such an indicator is easy. I waited for an arrow to appear in the desired direction - I opened a deal. An arrow formed in the opposite direction - closed the deal. The indicator also displays the lines with the help of which the arrow signals are formed, taking into account the int
Gann Square of 144
Taras Slobodyanik
5 (5)
The Gann Box (or Gann Square) is a market analysis method based on the "Mathematical formula for market predictions" article by W.D. Gann. This indicator can plot three models of Squares: 90, 52(104), 144. There are six variants of grids and two variants of arcs. You can plot multiple squares on one chart simultaneously. Parameters Square — selection of a square model: 90 — square of 90 (or square of nine); 52 (104) — square of 52 (or 104); 144 — universal square of 144; 144 (full) — "full" v
The Th3Eng PipFinite indicator is based on a very excellent analysis of the right trend direction with perfect custom algorithms. It show the true direction and the best point to start trading. With StopLoss point and Three Take Profit points. Also it show the right pivot of the price and small points to order to replace the dynamic support and resistance channel, Which surrounds the price. And Finally it draws a very helpful Box on the left side on the chart includes (take profits and Stop loss
This indicator studies price action as an aggregation of price and time vectors, and uses the average vector to determine the direction and strength of the market. This indicator highlights the short-term directionality and strength of the market, and can be used to capitalize from short-term price movements by trading breakouts or binary options. [ Installation Guide | Update Guide | Troubleshooting | FAQ | All Products ] Find market direction easily Confirm with breakouts or other indicators D
Stratos Pali
Michela Russo
5 (1)
Stratos Pali Indicator   is a revolutionary tool designed to enhance your trading strategy by accurately identifying market trends. This sophisticated indicator uses a unique algorithm to generate a complete histogram, which records when the trend is Long or Short. When a trend reversal occurs, an arrow appears, indicating the new direction of the trend. Important Information Revealed Leave a review and contact me via mql5 message to receive My Top 5 set files for Stratos Pali at no cost! Dow
Käufer dieses Produkts erwarben auch
Gann Made Easy
Oleg Rodin
4.79 (112)
Gann Made Easy ist ein professionelles und einfach zu bedienendes Forex-Handelssystem, das auf den besten Handelsprinzipien unter Verwendung der Theorie von Mr. basiert. W.D. Gann. Der Indikator liefert genaue KAUF- und VERKAUFSsignale, einschließlich Stop-Loss- und Take-Profit-Levels. Mit PUSH-Benachrichtigungen können Sie auch unterwegs handeln. Bitte kontaktieren Sie mich nach dem Kauf! Ich werde meine Handelstipps und tolle Bonusindikatoren kostenlos mit Ihnen teilen! Wahrscheinlich haben Si
Dynamic Forex28 Navigator
Bernhard Schweigert
5 (4)
Dynamic Forex28 Navigator – Das Forex-Handelstool der nächsten Generation AKTUELL 49 % RABATT. Dynamic Forex28 Navigator ist die Weiterentwicklung unserer seit langem beliebten Indikatoren und vereint die Leistung von drei in einem: Advanced Currency Strength28 Indicator (695 Bewertungen) + Advanced Currency IMPULSE mit ALERT (520 Bewertungen) + CS28 Combo Signals (Bonus) Details zum Indikator https://www.mql5.com/en/blogs/post/758844 Was bietet der Strength Indicator der nächsten Generation?
Gold Stuff
Vasiliy Strukov
4.86 (248)
Gold Stuff-Ein Trendindikator, der speziell für Gold entwickelt wurde, kann auch auf allen Finanzinstrumenten verwendet werden. Der Indikator wird nicht neu gezeichnet und verzögert sich nicht. Empfohlener Zeitrahmen H1. Nach diesem Indikator geschrieben EA Gold Stuff Berater, können Sie es in meinem Profil finden. WICHTIG! Kontaktieren Sie mich sofort nach dem Kauf, um Anweisungen und Bonus zu erhalten!   Sie können eine kostenlose Kopie unseres Strong Support- und Trendscanner-Indikators er
-   Real price is 80$   - 40% Discount ( It is 49$ now ) - Lifetime update free Contact me for instruction, add group and any questions! Related Products:  Bitcoin Expert , Gold Expert - Non-repaint - I just sell my products in Elif Kaya profile, any other websites are stolen old versions, So no any new updates or support. Introduction The breakout and retest strategy is traded support and resistance levels. it involves price breaking through a previous level.  The break and retest strategy is
Gold Venamax MT4
Sergei Linskii
5 (1)
Gold Venamax   – das ist der beste technische Indikator für Aktien. Der Indikatoralgorithmus analysiert die Preisbewegung eines Vermögenswerts und spiegelt die Volatilität und potenzielle Einstiegszonen wider. Indikatorfunktionen: Dies ist ein Super-Indikator mit Magic und zwei Blöcken von Trendpfeilen für komfortables und profitables Trading. Auf dem Diagramm wird eine rote Schaltfläche zum Wechseln von Blöcken angezeigt. Magic ist in den Indikatoreinstellungen eingestellt, sodass Sie den In
Lux Trend
Mohamed Hassan
5 (3)
The starting price is $75. It will increase to $120 after 30 sales. 17 copies left. After purchase, please contact me to get your trading tips + more information for a great bonus!   Lux Trend is a professional strategy based on using Higher Highs and Lower Highs to identify and draw Trendline Breakouts! Lux Trend  utilizes two Moving Averages to confirm the overall trend direction before scanning the market for high-quality breakout opportunities, ensuring more accurate and reliable trade s
Scalper Inside PRO
Alexey Minkov
4.76 (63)
!SPECIAL SALE! An exclusive indicator that utilizes an innovative algorithm to swiftly and accurately determine the market trend. The indicator automatically calculates opening, closing, and profit levels, providing detailed trading statistics. With these features, you can choose the most appropriate trading instrument for the current market conditions. Additionally, you can easily integrate your own arrow indicators into Scalper Inside Pro to quickly evaluate their statistics and profitability
Currency Strength Wizard ist ein sehr leistungsstarker Indikator, der Ihnen eine Komplettlösung für erfolgreichen Handel bietet. Der Indikator berechnet die Stärke dieses oder jenes Forex-Paares anhand der Daten aller Währungen in mehreren Zeitrahmen. Diese Daten werden in Form von benutzerfreundlichen Währungsindizes und Währungsstärkelinien dargestellt, anhand derer Sie die Stärke dieser oder jener Währung erkennen können. Sie müssen lediglich den Indikator an das Diagramm anhängen, mit dem Si
Golden Trend Indicator
Noha Mohamed Fathy Younes Badr
4.9 (10)
Golden Trend indicator  is The best indicator for predicting trend movement this indicator never lags and never repaints and never back paints    and give  arrow buy and sell    before the candle appear  and it will help you and  will make your trading decisions clearer its work on all currencies and  gold and crypto and all time frame This unique  indicator uses very secret algorithms to catch the  trends, so you can trade using this indicator and see the trend clear on charts  manual guide and
FX Levels MT4
Daniel Stein
5 (2)
FX Levels: Außerordentlich präzise Unterstützungs- und Widerstandszonen für alle Märkte Kurzüberblick Suchen Sie eine verlässliche Methode, um Support- und Resistance-Level in jedem Markt zu identifizieren—egal ob Währungspaare, Indizes, Aktien oder Rohstoffe? FX Levels vereint die traditionelle „Lighthouse“-Methode mit einem modernen dynamischen Ansatz und bietet nahezu universelle Genauigkeit. Durch unsere Erfahrung mit echten Brokern sowie automatischen täglichen und Echtzeit-Updates hilft
Smart Set up Levels
Mohit Dhariwal
5 (1)
Smart Set up leve l is a very powerful indicator based on the concept of order blocks and set up entries with proper fvg and breakouts to make a very nice level to enter like a pro trader. Very easy to use interface and friendly to enter on buy and sell signals. Works Best on M15 Time frame on Gold, Bitcoin and Fx pairs. Daily 4-5 trades on each pair  Works great on gold like a pro on M15 It is non repainting nor lagging It is very powerful indicator giving precise entries and prop acts can be c
Scalper Vault
Oleg Rodin
5 (29)
Scalper Vault ist ein professionelles Scalping-System, das Ihnen alles bietet, was Sie für erfolgreiches Scalping benötigen. Dieser Indikator ist ein komplettes Handelssystem, das von Forex- und Binäroptionshändlern verwendet werden kann. Der empfohlene Zeitrahmen ist M5. Das System liefert Ihnen genaue Pfeilsignale in Richtung des Trends. Es liefert Ihnen auch Top- und Bottom-Signale und Gann-Marktniveaus. Die Indikatoren bieten alle Arten von Warnungen, einschließlich PUSH-Benachrichtigungen.
IX Power MT4
Daniel Stein
4.71 (7)
IX Power: Markteinblicke für Indizes, Rohstoffe, Kryptowährungen und Forex Überblick IX Power ist ein vielseitiges Tool zur Analyse der Stärke von Indizes, Rohstoffen, Kryptowährungen und Forex-Symbolen. Während FX Power die höchste Präzision für Währungspaare bietet, indem es alle verfügbaren Paardaten einbezieht, konzentriert sich IX Power ausschließlich auf die Marktdaten des zugrunde liegenden Symbols. Dies macht IX Power zu einer hervorragenden Wahl für Nicht-Forex-Märkte und zu einem zuv
MTF Supply Demand Zones
Georgios Kalomoiropoulos
4.83 (23)
Automatisierte Angebots- und Nachfragezonen der nächsten Generation. Neuer und innovativer Algorithmus, der bei jedem Diagramm funktioniert. Alle Zonen werden dynamisch entsprechend der Preisbewegung des Marktes erstellt. ZWEI ARTEN VON WARNUNGEN --> 1) WENN DER PREIS EINE ZONE ERREICHT 2) WENN EINE NEUE ZONE BILDET WIRD Sie erhalten keinen weiteren nutzlosen Indikator. Sie erhalten eine vollständige Handelsstrategie mit nachgewiesenen Ergebnissen.     Neue Eigenschaften:     Warnungen, w
Easy Breakout
Mohamed Hassan
5 (9)
After your purchase, feel free to contact me for more details on how to receive a bonus indicator called VFI, which pairs perfectly with Easy Breakout for enhanced confluence!   Easy Breakout is a powerful price action trading system built on one of the most popular and widely trusted strategies among traders: the Breakout strategy ! This indicator delivers crystal-clear Buy and Sell signals based on breakouts from key support and resistance zones. Unlike typical breakout indicators, it levera
PRO Renko System ist ein hochpräzises Handelssystem, das speziell für den Handel mit RENKO-Charts entwickelt wurde. Dies ist ein universelles System, das auf verschiedene Handelsinstrumente angewendet werden kann. Das System neutralisiert effektiv so genannte Marktgeräusche, die Ihnen Zugang zu genauen Umkehrsignalen geben. Der Indikator ist sehr einfach zu bedienen und hat nur einen Parameter, der für die Signalerzeugung verantwortlich ist. Sie können das Tool einfach an jedes Handelsinstrum
FX Volume
Daniel Stein
4.59 (34)
FX Volume: Erleben Sie den echten Marktüberblick aus der Sicht eines Brokers Kurzüberblick Möchten Sie Ihre Handelsstrategie auf das nächste Level bringen? FX Volume liefert Ihnen Echtzeit-Einblicke in die Positionierung von Retail-Tradern und Brokern — lange bevor verzögerte Berichte wie der COT verfügbar sind. Ob Sie nach beständigen Gewinnen streben oder einfach einen tieferen Vorteil am Markt suchen, FX Volume hilft Ihnen, große Ungleichgewichte zu erkennen, Breakouts zu bestätigen und Ihr
Gold Trend   - dies ist ein guter technischer Indikator für Aktien. Der Algorithmus des Indikators analysiert die Preisbewegung eines Vermögenswerts und spiegelt die Volatilität und mögliche Einstiegszonen wider. Die besten Indikatorsignale: - Für VERKAUFEN = rotes Histogramm + roter SHORT-Zeiger + gelber Signalpfeil in dieselbe Richtung. - Für KAUFEN = blaues Histogramm + blauer LONG-Zeiger + aquafarbener Signalpfeil in dieselbe Richtung. Vorteile des Indikators: 1. Der Indikator erzeugt
Entdecken Sie das Geheimnis des erfolgreichen Forex -Handels mit unserem benutzerdefinierten MT4 -Indikator! Haben Sie sich jemals gefragt, wie Sie Erfolg auf dem Forex -Markt erzielen können und gleichzeitig Gewinne erzielen und gleichzeitig das Risiko minimieren können? Hier ist die Antwort, nach der Sie gesucht haben! Erlauben Sie uns, unseren proprietären MT4 -Indikator vorzustellen, der Ihren Handelsansatz revolutionieren wird. Einzigartige Vielseitigkeit Unser Indikator ist speziell für
Beast Super Signal
Dustin Vlok
4.73 (89)
Suchen Sie nach einem leistungsstarken Indikator für den Devisenhandel, der Ihnen dabei helfen kann, profitable Handelsmöglichkeiten mit Leichtigkeit zu erkennen? Suchen Sie nicht weiter als das Beast Super Signal. Dieser benutzerfreundliche trendbasierte Indikator überwacht kontinuierlich die Marktbedingungen, sucht nach neuen sich entwickelnden Trends oder springt auf bestehende Trends ein. Das Beast Super Signal gibt ein Kauf- oder Verkaufssignal, wenn alle internen Strategien aufeinander ab
Wir stellen Ihnen ON Trade Waves Patterns Harmonic Elliot Wolfe vor, einen fortschrittlichen Indikator, der entwickelt wurde, um verschiedene Markt-Muster mithilfe sowohl manueller als auch automatischer Methoden zu erkennen. Hier ist, wie er funktioniert: Harmonische Muster: Dieser Indikator kann harmonische Muster erkennen, die auf Ihrem Chart erscheinen. Diese Muster sind für Trader, die die Theorie des harmonischen Handels praktizieren, wie sie in Scott Carney's Buch "Harmonic Trading vol 1
System Trend Pro
Aleksandr Makarov
5 (2)
System Trend Pro - This is the best trend trading indicator!!! You can get this indicator for free -  Quantum Entry PRO The indicator no repaint!!!  The indicator has   MTF   mode, which adds confidence to trading on the trend (   no repaint   ). How to trade? Everything is very simple, we wait for the first signal (big arrow), then wait for the second signal (small arrow) and enter the market in the direction of the arrow. (See screens 1 and 2.) Exit on the opposite signal or take 20-30 pips
FX Power MT4 NG
Daniel Stein
4.94 (18)
FX Power: Analysieren Sie die Stärke von Währungen für intelligentere Handelsentscheidungen Übersicht FX Power ist Ihr unverzichtbares Werkzeug, um die tatsächliche Stärke von Währungen und Gold unter allen Marktbedingungen zu verstehen. Indem Sie starke Währungen kaufen und schwache verkaufen, vereinfacht FX Power Ihre Handelsentscheidungen und deckt Chancen mit hoher Wahrscheinlichkeit auf. Ob Sie Trends folgen oder extreme Delta-Werte nutzen, um Umkehrungen zu prognostizieren, dieses Tool p
M1 Arrow
Oleg Rodin
5 (16)
Eine Intraday-Strategie, die auf zwei Grundprinzipien des Marktes basiert. Der Algorithmus basiert auf der Analyse von Volumina und Preiswellen mit zusätzlichen Filtern. Der intelligente Algorithmus des Indikators gibt nur dann ein Signal, wenn sich zwei Marktfaktoren zu einem vereinen. Der Indikator berechnet Wellen eines bestimmten Bereichs auf dem M1-Diagramm unter Verwendung der Daten des höheren Zeitrahmens. Und um die Welle zu bestätigen, verwendet der Indikator eine Volumenanalyse. Dieser
MetaBands M4
Vahidreza Heidar Gholami
5 (3)
MetaBands verwendet leistungsstarke und einzigartige Algorithmen, um Kanäle zu zeichnen und Trends zu erkennen, sodass es Tradern potenzielle Punkte für den Einstieg und Ausstieg aus Trades bieten kann. Es ist ein Kanalindikator sowie ein leistungsstarker Trendindikator. Es umfasst verschiedene Arten von Kanälen, die einfach durch Verwendung der Eingabeparameter zusammengeführt werden können. MetaBands verwendet alle Arten von Warnmeldungen, um Benutzer über Marktereignisse zu informieren. Funkt
Enigmera
Ivan Stefanov
5 (7)
ENIGMERA: Der Kern des Marktes Wichtig: Die MQL5.com-Demo wird im Strategy Tester ausgeführt und spiegelt möglicherweise nicht vollständig die Funktionalität von Enigmera wider. Überprüfen Sie die Beschreibung, Screenshots und das Video für Details. Zögern Sie nicht, mir bei Fragen eine Nachricht zu senden! Der Code des Indikators wurde vollständig neu geschrieben. Version 3.0 fügt neue Funktionen hinzu und behebt Fehler, die seit der Einführung des Indikators aufgetreten sind. Einführung Dies
Advanced Supply Demand
Bernhard Schweigert
4.91 (294)
Derzeit 33% Rabatt! Die beste Lösung für jeden Anfänger oder erfahrenen Händler! Dieser Indikator ist ein einzigartiges, qualitativ hochwertiges und erschwingliches Trading-Tool, da wir eine Reihe von proprietären Funktionen und eine neue Formel integriert haben. Mit diesem Update werden Sie in der Lage sein, doppelte Zeitrahmenzonen anzuzeigen. Sie können nicht nur einen höheren TF (Zeitrahmen) anzeigen, sondern sowohl den Chart-TF als auch den höheren TF: SHOWING NESTED ZONES. Alle Supply Dema
Apollo BuySell Predictor ist ein professionelles Handelssystem, das mehrere Handelsmodule umfasst. Es bietet einem Trader einzigartige Breakout-Zonen, Fibonacci-basierte Unterstützungs- und Widerstandsniveaus, Pivot-Trendlinie, Pullback-Volumensignale und andere hilfreiche Funktionen, die jeder Trader täglich benötigt. Das System funktioniert mit jedem Paar. Empfohlene Zeitrahmen sind M30, H1, H4. Der Indikator kann jedoch auch mit anderen Zeitrahmen arbeiten, mit Ausnahme der Zeitrahmen höher a
Supply Demand Analyzer
Suvashish Halder
5 (5)
Supply Demand Analyzer is an advanced trading indicator meticulously designed for the precise identification, analysis, and management of supply and demand zones. By integrating real-time data and advanced algorithms, this tool enables traders to recognize market phases, price movements, and structural patterns with unparalleled accuracy. It simplifies complex market dynamics into actionable insights, empowering traders to anticipate market behavior, identify trading opportunities, and make info
Trend Screener
STE S.S.COMPANY
4.78 (93)
Trendindikator, bahnbrechende, einzigartige Lösung für Trendhandel und -filterung mit allen wichtigen Trendfunktionen in einem Tool! Es handelt sich um einen 100 % nicht neu zu malenden Multi-Timeframe- und Multi-Währungs-Indikator, der für alle Symbole/Instrumente verwendet werden kann: Forex, Rohstoffe, Kryptowährungen, Indizes und Aktien. ZEITLICH BEGRENZTES ANGEBOT: Der Support- und Resistance-Screener-Indikator ist für nur 50 $ und lebenslang verfügbar. (Ursprünglicher Preis 250 $) (Angebot
Weitere Produkte dieses Autors
PZ Trend Trading MT5
PZ TRADING SLU
3.8 (5)
Trend Trading ist ein Indikator, der so weit wie möglich von den Markttrends profitiert, indem er Pullbacks und Breakouts zeitlich festlegt. Sie findet Handelsmöglichkeiten, indem sie analysiert, was der Preis während etablierter Trends tut. [ Installationsanleitung | Update-Anleitung | Fehlerbehebung | FAQ | Alle Produkte ] Handeln Sie mit Zuversicht und Effizienz an den Finanzmärkten Profitieren Sie von etablierten Trends, ohne ins Wanken zu geraten Profitable Pullbacks, Ausbrüche und vorze
PZ Swing Trading MT5
PZ TRADING SLU
5 (5)
Swing Trading ist der erste Indikator, der Schwankungen in Trendrichtung und mögliche Umkehrschwankungen erkennt. Es wird der in der Handelsliteratur weit verbreitete Baseline-Swing-Trading-Ansatz verwendet. Der Indikator untersucht mehrere Preis- und Zeitvektoren, um die aggregierte Trendrichtung zu verfolgen und erkennt Situationen, in denen der Markt überverkauft oder überkauft ist und zur Korrektur bereit ist. [ Installationsanleitung | Update-Anleitung | Fehlerbehebung | FAQ | Alle Produkte
Dies ist die neueste Iteration meines berühmten Scalpers Goldfinch EA, der vor fast einem Jahrzehnt zum ersten Mal veröffentlicht wurde. Sie lenkt den Blick auf plötzliche Volatilitätsausweitungen, die in kurzen Zeiträumen stattfinden: Sie geht davon aus, dass die Trägheit der Preisbewegung nach einer plötzlichen Preisbeschleunigung ausgenutzt wird, und versucht, sie zu nutzen. Diese neue Version wurde vereinfacht, damit der Händler die Optimierungsfunktion des Testers leicht nutzen kann, um die
Dies ist wahrscheinlich der vollständigste Indikator für die automatische Erkennung der harmonischen Preisbildung, den Sie für die MetaTrader-Plattform finden können. Es erkennt 19 verschiedene Muster, nimmt Fibonacci-Projektionen genauso ernst wie Sie, zeigt die potenzielle Umkehrzone (PRZ) an und findet geeignete Stop-Loss- und Take-Profit-Werte. [ Installationsanleitung | Update-Anleitung | Fehlerbehebung | FAQ | Alle Produkte ] Es erkennt 19 verschiedene harmonische Preisbildungen Darges
PZ Harmonacci Patterns
PZ TRADING SLU
3.17 (6)
Dies ist wahrscheinlich der vollständigste Indikator für die automatische Erkennung der harmonischen Preisbildung, den Sie für die MetaTrader-Plattform finden können. Es erkennt 19 verschiedene Muster, nimmt Fibonacci-Projektionen genauso ernst wie Sie, zeigt die potenzielle Umkehrzone (PRZ) an und findet geeignete Stop-Loss- und Take-Profit-Werte. [ Installationsanleitung | Update-Anleitung | Fehlerbehebung | FAQ | Alle Produkte ] Es erkennt 19 verschiedene harmonische Preisbildungen Darges
PZ Trend Trading
PZ TRADING SLU
4.8 (5)
Trend Trading ist ein Indikator, der so weit wie möglich von den Markttrends profitiert, indem er Pullbacks und Breakouts zeitlich festlegt. Sie findet Handelsmöglichkeiten, indem sie analysiert, was der Preis während etablierter Trends tut. [ Installationsanleitung | Update-Anleitung | Fehlerbehebung | FAQ | Alle Produkte ] Handeln Sie mit Zuversicht und Effizienz an den Finanzmärkten Profitieren Sie von etablierten Trends, ohne ins Wanken zu geraten Profitable Pullbacks, Ausbrüche und vorze
PZ Support Resistance
PZ TRADING SLU
3.33 (3)
Sind Sie es leid, Unterstützungs- und Widerstandslinien zu zeichnen? Der Unterstützungswiderstand ist ein Multi-Zeitrahmen-Indikator, der Unterstützungs- und Widerstandslinien mit einer sehr interessanten Wendung automatisch erkennt und zeichnet: Wenn das Preisniveau im Laufe der Zeit getestet wird und seine Bedeutung zunimmt, werden die Linien dicker und dunkler. [ Installationsanleitung | Update-Anleitung | Fehlerbehebung | FAQ | Alle Produkte ] Steigern Sie Ihre technische Analyse über Nacht
This is a smooth and responsive accelerometer which reveals the market trend and strength. [ Installation Guide | Update Guide | Troubleshooting | FAQ | All Products ] Two moving averages indicate trend direction The histogram represents strength of the price movement It draws buy and sell zones as colored vertical lines Should be used as a confirmation indicator Customizable line widths and colors It implements alerts of all kinds This indicator is similar to MACD but aims to react faster to
Dieser Expertenberater implementiert das ursprüngliche Handelssystem von Dennis und Eckhardt, das allgemein als The Turtle Trader bekannt ist. Es handelt genau wie die ursprünglichen Turtles und kann von erfahrenen Tradern verwendet werden, um Trends in auf- oder absteigenden Märkten zu erfassen. [ Installationsanleitung | Update-Anleitung | Fehlerbehebung | FAQ | Alle Produkte ] Einfach zu bedienen und zu überwachen Vollständig konfigurierbare Strategieeinstellungen Voll konfigurierbare Handel
PZ Day Trading MT5
PZ TRADING SLU
2.83 (6)
Dieser Indikator erkennt Preisumkehrungen im Zick-Zack, wobei nur Preisaktionsanalysen und ein Donchian-Kanal verwendet werden. Es wurde speziell für den kurzfristigen Handel entwickelt, ohne dass ein Nachlackieren oder ein Backpainting erforderlich ist. Es ist ein fantastisches Werkzeug für clevere Trader, die darauf abzielen, das Timing ihrer Operationen zu verbessern. [ Installationsanleitung | Update-Anleitung | Fehlerbehebung | FAQ | Alle Produkte ] Erstaunlich einfach zu handeln Es biet
PZ Swing Trading
PZ TRADING SLU
5 (3)
Swing Trading ist der erste Indikator, der Schwankungen in Trendrichtung und mögliche Umkehrschwankungen erkennt. Es wird der in der Handelsliteratur weit verbreitete Baseline-Swing-Trading-Ansatz verwendet. Der Indikator untersucht mehrere Preis- und Zeitvektoren, um die aggregierte Trendrichtung zu verfolgen und erkennt Situationen, in denen der Markt überverkauft oder überkauft ist und zur Korrektur bereit ist. [ Installationsanleitung | Update-Anleitung | Fehlerbehebung | FAQ | Alle Produkte
Tired of plotting trendlines? The PZ TrendLines indicator applies a mechanical approach to the construction of trend lines for you! [ Installation Guide | Update Guide | Troubleshooting | FAQ | All Products ] It can draw up to 18 trendlines Trendlines can be optionally based on fractals Each line represents a breakout level Each trendline can be broken or rejected Configurable amount of lines Configurable colors Author Arturo López Pérez, private investor and speculator, software engineer and
This indicator analyzes price action patterns and helps you to make positive equity decisions in the binary options market. [ Installation Guide | Update Guide | Troubleshooting | FAQ | All Products ] Easy to trade Trade both call and put options No crystal ball and no predictions The indicator is non-repainting The only strategy suitable for binary options is applying a mathematical approach, like professional gamblers do. It is based on the following principles: Every binary option represents
PZ Risk Management
PZ TRADING SLU
5 (1)
This indicator monitors the vital constants of your trading account to keep it healthy and away from excessive risks. It monitors all trades, absolute exposure, account floating point and leverage currently in use, using different color codes for your interpretation.  [ Installation Guide | Update Guide | Troubleshooting | FAQ | All Products ] Amazingly easy to understand The indicator is clean and simple It calculates exposure by pairs and currencies Keep your used leverage controlled at all ti
PZ Goldfinch Scalper EA
PZ TRADING SLU
1 (4)
Dies ist die neueste Iteration meines berühmten Scalpers Goldfinch EA, der vor fast einem Jahrzehnt zum ersten Mal veröffentlicht wurde. Sie lenkt den Blick auf plötzliche Volatilitätsausweitungen, die in kurzen Zeiträumen stattfinden: Sie geht davon aus, dass die Trägheit der Preisbewegung nach einer plötzlichen Preisbeschleunigung ausgenutzt wird, und versucht, sie zu nutzen. Diese neue Version wurde vereinfacht, damit der Händler die Optimierungsfunktion des Testers leicht nutzen kann, um die
PZ Turtle Trading EA MT5
PZ TRADING SLU
2.33 (3)
Dieser Expertenberater implementiert das ursprüngliche Handelssystem von Dennis und Eckhardt, das allgemein als The Turtle Trader bekannt ist. Es handelt genau wie die ursprünglichen Turtles und kann von erfahrenen Tradern verwendet werden, um Trends in auf- oder absteigenden Märkten zu erfassen. [ Installationsanleitung | Update-Anleitung | Fehlerbehebung | FAQ | Alle Produkte ] Einfach zu bedienen und zu überwachen Vollständig konfigurierbare Strategieeinstellungen Voll konfigurierbare Handel
PZ Wolfe Waves
PZ TRADING SLU
1 (1)
Wolfe Waves sind natürlich vorkommende Handelsmuster, die an allen Finanzmärkten vorhanden sind und einen Kampf um einen Gleichgewichtspreis darstellen. Diese Muster können sich über kurze und lange Zeiträume entwickeln und sind eines der zuverlässigsten prädiktiven Umkehrmuster, die es gibt und die normalerweise starken und langen Kursbewegungen vorausgehen. [ Installationsanleitung | Update-Anleitung | Fehlerbehebung | FAQ | Alle Produkte ] Klare Handelssignale Erstaunlich einfach zu handeln
Sind Sie es leid, Unterstützungs- und Widerstandslinien zu zeichnen? Der Unterstützungswiderstand ist ein Multi-Zeitrahmen-Indikator, der Unterstützungs- und Widerstandslinien mit einer sehr interessanten Wendung automatisch erkennt und zeichnet: Wenn das Preisniveau im Laufe der Zeit getestet wird und seine Bedeutung zunimmt, werden die Linien dicker und dunkler. [ Installationsanleitung | Update-Anleitung | Fehlerbehebung | FAQ | Alle Produkte ] Steigern Sie Ihre technische Analyse über Nacht
Dieser Indikator erkennt über 30 japanische Candlestick-Muster und hebt sie wunderschön auf der Karte hervor. Es ist einfach einer dieser Indikatoren, auf die Preisaktionshändler nicht verzichten können. Steigern Sie Ihre technische Analyse über Nacht Erkennen Sie leicht japanische Kerzenmuster Handeln Sie zuverlässig und mit universellen Umkehrmustern Springen Sie mithilfe von Fortsetzungsmustern sicher auf etablierte Trends Der Indikator ist nicht neu lackiert und implementiert Warnungen Der
Dieser Indikator analysiert vergangene Preisbewegungen, um den Kauf- und Verkaufsdruck auf dem Markt zu antizipieren. Dabei wird in die Vergangenheit zurückgeschaut und Preisspitzen und -täler um den aktuellen Preis analysiert. Es ist ein Bestätigungsindikator auf dem neuesten Stand der Technik. [ Installationsanleitung | Update-Anleitung | Fehlerbehebung | FAQ | Alle Produkte ] Prognostizieren Sie den Kauf- und Verkaufsdruck auf dem Markt Vermeiden Sie den Kauf und Verkauf von Raserei Keine Ei
This is the latest iteration of my famous indicator, Reversal Fractals, published for the first time almost a decade ago. It examines the price structure of fractals to determine possible reversal points in the market, providing timing to positional traders that already have a fundamental or technical valuation model. [ Installation Guide | Update Guide | Troubleshooting | FAQ | All Products ] Reversal fractals can start long trends The indicator is non repainting It implements alerts of all ki
This indicator displays pivot points in the chart, including historical vales, and supports many calculation modes for Pivot Points and S/R levels. [ Installation Guide | Update Guide | Troubleshooting | FAQ | All Products ] It plots historical levels for backtesting purposes It allows you to select the reference timeframe It implements different Pivot Point calculation modes It implements different SR calculation modes It implements customizable colors and sizes Calculation Modes The indicato
Enhance your price action strategy: inside bar breakouts at your fingertips This indicator detects inside bars of several ranges, making it very easy for price action traders to spot and act on inside bar breakouts. [ Installation Guide | Update Guide | Troubleshooting | FAQ | All Products ] Easy to use and understand Customizable color selections The indicator implements visual/mail/push/sound alerts The indicator does not repaint or backpaint An inside bar is a bar or series of bars which is/a
PZ Correlation
PZ TRADING SLU
5 (1)
In the world of finance, correlation is a statistical measure of how two securities move in relation to each other. Correlations are used in advanced portfolio management. This indicator measures how different securities move in relation to a reference one, thus making portfolio management easier.  [ Installation Guide | Update Guide | Troubleshooting | FAQ | All Products ] Avoid concurrent trades in highly correlated instruments Find trading opportunities among highly correlated instruments Cor
This indicator finds Three Drives patterns. The Three Drives pattern is a 6-point reversal pattern characterised by a series of higher highs or lower lows that complete at a 127% or 161.8% Fibonacci extension. It signals that the market is exhausted and a reversal can happen. [ Installation Guide | Update Guide | Troubleshooting | FAQ | All Products ] Customizable pattern sizes Customizable colors and sizes Customizable breakout periods Customizable 1-2-3 and 0-A-B ratios It implements visual/s
This indicator evaluates the market sentiment using raw price action measurements, and it is an amazing trading confirmation. It can be used to take a trend-trade approach or a contrarian approach using reversal patterns. [ Installation Guide | Update Guide | Troubleshooting | FAQ | All Products ] Find early reversals Confirm short-term trades Detect indecision on the market Take contrarian trades near support and resistance levels Trade inside bars confirmed by overall direction of the market T
PZ Day Trading
PZ TRADING SLU
3.67 (3)
Dieser Indikator erkennt Preisumkehrungen im Zick-Zack, wobei nur Preisaktionsanalysen und ein Donchian-Kanal verwendet werden. Es wurde speziell für den kurzfristigen Handel entwickelt, ohne dass ein Nachlackieren oder ein Backpainting erforderlich ist. Es ist ein fantastisches Werkzeug für clevere Trader, die darauf abzielen, das Timing ihrer Operationen zu verbessern. [ Installationsanleitung | Update-Anleitung | Fehlerbehebung | FAQ | Alle Produkte ] Erstaunlich einfach zu handeln Es biet
This is a smooth and responsive accelerometer which reveals the market trend and strength. [ Installation Guide | Update Guide | Troubleshooting | FAQ | All Products ] Two moving averages indicate trend direction The histogram represents strength of the price movement It draws buy and sell zones as colored vertical lines Should be used as a confirmation indicator Customizable line widths and colors It implements alerts of all kinds This indicator is similar to MACD but aims to react faster to
PZ Turtle Trading
PZ TRADING SLU
5 (3)
The Turtle Trading Indicator implements the original Dennis Richards and Bill Eckhart trading system, commonly known as The Turtle Trader. This trend following system relies on breakouts of historical highs and lows to take and close trades: it is the complete opposite to the "buy low and sell high" approach. The main rule is "Trade an N-day breakout and take profits when an M-day high or low is breached (N must me above M)". [ Installation Guide | Update Guide | Troubleshooting | FAQ | All Prod
Dieser Indikator bewertet gleichzeitig die Volatilität und die Kursrichtung, wobei die folgenden Ereignisse ermittelt werden. [ Installationsanleitung | Update-Anleitung | Fehlerbehebung | FAQ | Alle Produkte ] Entscheidende und plötzliche Preisbewegungen Große Hämmer / Sternschnuppenmuster Starke Ausbrüche, die von den meisten Marktteilnehmern unterstützt werden Unentschlossene, aber volatile Marktsituationen Es ist ein extrem einfach zu verwendender Indikator ... Das blaue Histogramm repräsen
Auswahl:
Erdinç Yıldız
539
Erdinç Yıldız 2017.11.30 11:22 
 

Der Benutzer hat keinen Kommentar hinterlassen

Antwort auf eine Rezension
Version 5.2 2020.10.20
- Recompiled with minor changes
Version 4.0 2016.08.17
- Added absolute gain/loss stats
- Added chart size selection
- Added selection of chart type -bar or line charts-
- Selection of location of price labels
- Improved price levels
- Improved drawing