Colored Candles Demo
- Indikatoren
- Alexander Nikolaev
- Version: 1.1
- Aktualisiert: 28 November 2021
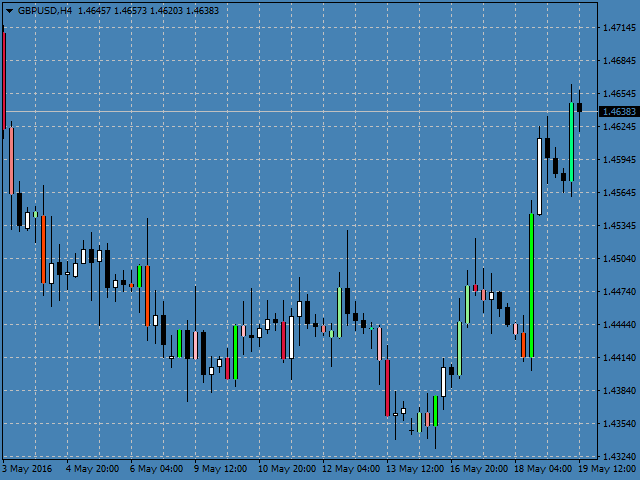
The demo version of the Colored Candles indicator - calculates the parameters of each candle, as well as its volume. After that, it paints the candles depending on their strength and direction. Bullish candles are colored green and bearish candles - red. The greater the power of the bulls or the bears, the brighter the color. You can change the colors if you want. The indicator helps to analyze the price movement, as well as market entry points. The more accurate signals are formed on the higher timeframes. It is possible and desirable ti use it in conjunction with other MetaTrader indicators.
This is a demo version of the indicator, and it works only on the H4 timeframe. To work on all timeframes, purchase the full version:
https://www.mql5.com/en/market/product/16268
Parameters
- History - the number of history bars to analyze and paint;
- Minimum length candle - the minimum length of the analyzed candle;
- PeriodADX - ADX indicator period;
- ADX and high-low relation - relation of the ADX indicator and the minimum candlestick length;
- CountCandlesVolume - the number of candlesticks to compare the volume (if set to 0, the candlestick volume is not analyzed);
- ColorBuy1 - color of weak bullish candles;
- ColorBuy2 - color of medium strength bullish candles;
- ColorBuy3 - color of strong bullish candles;
- ColorBuy4 - color of the strongest bullish candles;
- ColorSell1 - color of weak bearish candles;
- ColorSell2 - color of medium strength bearish candles;
- ColorSell3 - color of strong bearish candles;
- ColorSell4 - color of the strongest bearish candles;
- CandlesWidth - candle painting width.

































Der Benutzer hat keinen Kommentar hinterlassen