• Übersicht
  • Bewertungen
  • Diskussion
  • Neue Funktionen

PZ Lopez Pressure

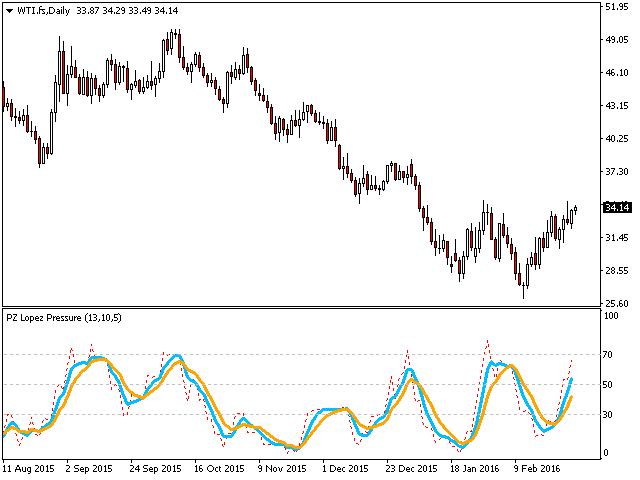
Dieser Indikator prognostiziert Preisumkehrungen und analysiert den Aufwärts- und Abwärtsdruck auf dem Markt. Der Kaufdruck ist die Summe aller Akkumulationsbalken über eine bestimmte Anzahl von Tagen, multipliziert mit dem Volumen. Der Verkaufsdruck ist die Summe aller Verteilungen über die gleiche Anzahl von Barren, multipliziert mit dem Volumen.

[ Installationsanleitung | Update-Anleitung | Fehlerbehebung | FAQ | Alle Produkte ]

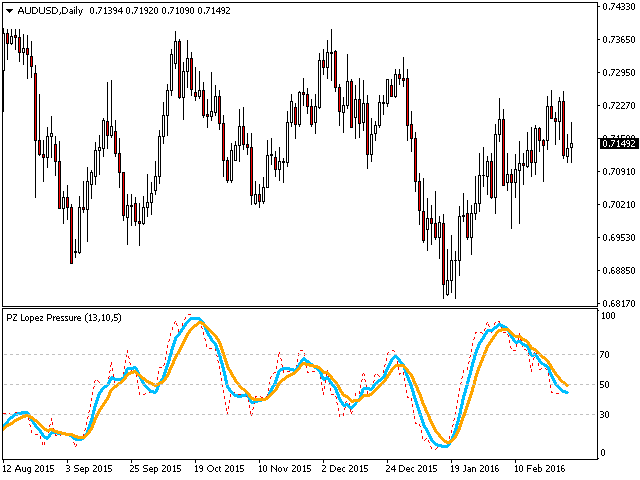
Das Indikatorverhältnis gibt Ihnen ein Maß für den Kaufdruck als Prozentsatz der Gesamtaktivität, dessen Wert von 0 bis 100 schwanken sollte. Es implementiert zwei gleitende Durchschnittswerte, schnell und langsam, um Änderungen in der Druckentwicklung zu erkennen und nach entsprechenden Trades zu suchen.

  • Eine Quote von 50 bedeutet, dass der Markt ausgeglichen ist
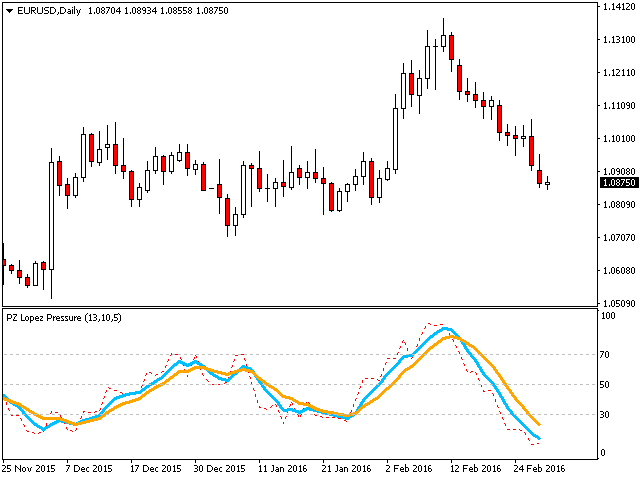
  • Eine Quote über 70 bedeutet, dass der Markt überkauft ist
  • Eine Quote unter 30 bedeutet, dass der Markt überverkauft ist
  • Die rot gepunktete Linie gibt das aktuelle Verhältnis an
  • Die blaue Linie ist die Signalleitung
  • Die orange Linie ist die Hauptlinie

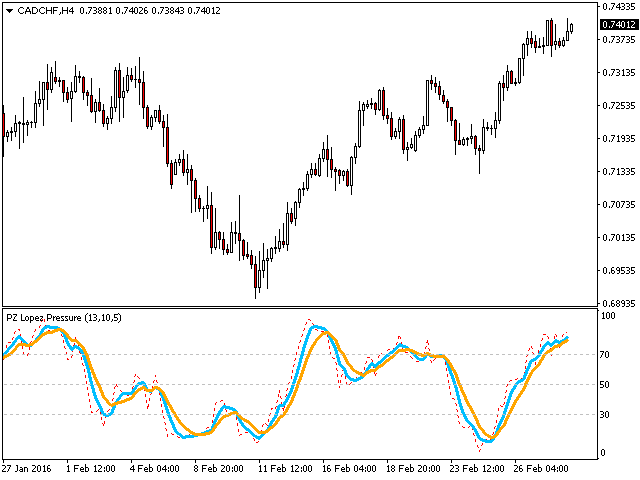
Dies hat direkte Auswirkungen auf den Handel.

  • Suchen Sie nach Kaufmöglichkeiten, wenn der Markt überverkauft ist
  • Suchen Sie nach Verkaufschancen, wenn der Markt überkauft ist
  • Befindet sich die Signalleitung über der Hauptleitung, ist der Druck bullisch
  • Befindet sich die Signalleitung unterhalb der Hauptleitung, ist der Druck bärisch


Eingabeparameter

  • Zeitraum: Anzahl der zur Berechnung des Drucks untersuchten Balken
  • Fast MA: Schnelle Mittelungsperiode für das Histogramm
  • Slow MA: Langsame Mittelungsperiode für das Histogramm

Autor

Arturo López Pérez, privater Investor und Spekulant, Softwareentwickler und Gründer von Point Zero Trading Solutions.

Empfohlene Produkte
American Hunters
Mehmet Ozhan Hastaoglu
This indicator guides you like a hunter. Tacheprofit and StopLoss levels. See the difference in the experiment. Works in all periods. Works at all rates. You can win with this system. The crossing of the mean and the re-test were done according to the rule. You can see the transactions by moving backwards on the strategy test screen. The whole system is automatically calculated.
Introduction to Fractal Pattern Scanner Fractal Indicator refers to the technical indicator that makes use of the fractal geometry found in the financial market. Fractal Pattern Scanner is the advanced Fractal Indicator that brings the latest trading technology after the extensive research and development work in the fractal geometry in the financial market. The most important feature in Fractal Pattern Scanner is the ability to measure the turning point probability as well as the trend probabi
Ska ZigZag BuySell
NKATEKO VUKOSI LEROY MASANGO
Ska ZigZag BuySell indicator determines the overbought and oversold regions within a trend. The indicator determines the overbought region by the candlestick high and the oversold region by the candlestick low. This indicator only gives signals with arrow and audible alerts each and every time when a new candlestick appear. To utilize the full strategy i recommend using "Ska ZigZag BuySell" together with "Ska ZigZag Line". The Ska ZigZag Line indicator is available for free. NOTE: Indicator is h
Market Profile
Artem Titarenko
5 (1)
The "Market Profile" indicator displays the profiles and volumes of periods – weekly, daily, session (8-hour), 4-hour, hour, summary. The VAH/VAL price area is automatically highlighted by a dotted line for each profile (except for the summary). The indicator includes chroma Delta, which colors the profile areas. The areas of prevailing Buys is colored in green, that of Sells - in red. The intensity histogram features blue/red respectively. In the filter mode, the indicator displays the volume a
Please contact me at telegram  https://t.me/smartforex7 After purchasing SmartForex Indicator then Use This Indicator...................... SMART EXIT PROFIT LINE Indicator is very Helpful with SmartForex Indicator ........................................ SMART EXIT PROFIT LINE Indicator Attach with SmartForex Indicator after then Red Line Show Exit buy Profit , Green Line show Exit Sell Profit................
FREE
Cancer
Vitalii Zakharuk
Cancer indicator is great for trend trading! An intelligent indicator algorithm with high probability shows the points of potential market reversal. If you are trading in a trend, then a trading strategy built on the basis of this indicator is perfect for you. The indicator filters out market noise, almost everything and all the necessary functions for working with a thread are built into one tool. It works on all currency pairs and on all timeframes, indicator setting - according to your desire
Introducing the Range Predictor : Your Ultimate Guide to Future Trading Ranges! Imagine having the power to see into the future of market moves— Range Predictor brings this dream to life. Designed to deliver real-time, predictive support and resistance levels , this tool goes beyond standard indicators, offering trend direction insights and precise range forecasts . Whether you're a day trader or a swing trader, the Range Predictor is your all-in-one toolkit for mastering the markets. MT5 Ver
Awesome Oscillator by Bill Williams with the ability to fine-tune and replace the averaging algorithms of the indicator, which significantly expands the possibilities of using this oscillator in algorithmic trading and brings it closer in its properties to such an indicator as the MACD. To reduce price noise, the final indicator is processed with an additional Smooth averaging. The indicator has the ability to give alerts, send mail messages and push signals when the direction of movement of th
Range Exhaustion
Robert Gerald Wood
Spannenerschöpfung tritt auf, wenn der Preis die erwartete Spanne für den aktuellen Zeitraum erreicht oder überschreitet. Auf diesen Niveaus beginnt der Preis im Vergleich zu früher im Berichtszeitraum an Dynamik zu verlieren, daher ist es ein guter Zeitpunkt, um sicherzustellen, dass Sie keine neuen Positionen eingehen. Dieser Indikator zeigt Ihnen, wo dies in Ihrem Diagramm wahrscheinlich passieren wird, und zeigt die Niveaus für tägliche, wöchentliche und monatliche Zeiträume an. Wenn Sie seh
Cupid Signal Fx
Damrongwit Kongtong
The principle of this indicator is very simple: detecting the return point with Stochastic Oscillator, then monitoring the trend by using the Moving Average and finally predicting BUY and SELL signal with arrows, alerts and notifications. The parameters are fixed and automatically calculated on each timeframe. Example: If you install indicator on EURUSD, the indicator will detect the return point when the Stochastic Oscillator show "cross up" of the main line/signal line at the below position of
Trend Analysis in act
Ihab Mohamed Kamal Fouda
The Trend Analysis Indicator is an innovative tool designed for traders and investors who seek to navigate the complexities of the financial markets with greater precision and insight. This powerful indicator is engineered to adeptly identify whether a market is trending or not, offering users a vital edge in their trading strategy. Key Features: Accurate Trend Detection : The core functionality of the Trend Analysis Indicator lies in its ability to accurately detect market trends. It analyzes p
Introduction In the fast-paced world of financial market trading, success often hinges on the ability to spot and leverage trends. Among the various strategies available, momentum trading stands out as a powerful tool for traders seeking to capitalize on market movements. In this article, we will delve into the concept of momentum, its significance in trading, and the numerous benefits it offers to traders. What is Momentum? Momentum in trading refers to the tendency of assets to continue moving
The Market Structures Pro indicator finds and displays 5 (five) patterns of the Smart Money Concepts (SMC) system on the chart, namely: Break Of Structures (BoS)       Change of character (CHoCH) Equal Highs & Lows Premium, Equilibrium and Discount zones with Fibo grid High-high, Low-low, High-low and Low-high extremes Patterns are displayed for two modes - Swing and Internal and are easily distinguished by color on the chart. Internal mode features higher contrast colors, finer lines, and smal
Ugenesys AI MT4
Odaine Ramon Mcmillan
5 (1)
uGenesys AI - 90% Accurate Daytrading Indicator Introducing the ultimate forex trading indicator system, uGenesys AI, powered by cutting-edge AI technology and advanced analytical techniques, including Time-Series Analysis and Genetic Algorithms. Our AI-powered trading system leverages the power of time-series analysis to identify trends and patterns in historical price data, allowing traders to make informed predictions about future market movements. By analyzing vast amounts of data, our syst
Bei diesem Indikator handelt es sich um einen Indikator für die automatische Wellenanalyse, der sich perfekt für den praktischen Handel eignet! Fall... Hinweis:   Ich bin es nicht gewohnt, westliche Namen für die Welleneinstufung zu verwenden. Aufgrund des Einflusses der Namenskonvention von Tang Lun (Tang Zhong Shuo Zen) habe ich die Grundwelle als   Stift   und das sekundäre Wellenband als   Segment   bezeichnet Gleichzeitig hat das Segment die   Trendrichtung   benannt (diese Benennungsmeth
Jerk Trend is a new product that allows you to identify the current market phase (uptrend, downtrend or flat). Represents a typical investor strategy that usually indicates a trend change from bearish to bullish. A tool that allows you to determine the direction and strength of a trend. Unlike most indicators, Jerk Trend finds longer-term trends and gives fewer false signals. This indicator displays arrows of different colors depending on the current state of the market and thus signals the us
Flying Volume
Paul Geirnaerdt
1 (1)
The Flying Volume indicator is a specialized volume indicator. It deciphers the volume data after heavy proprietary number crunching. When a main signal is found Flying Volume will look for possible continuation points. The main signal is shown by arrows, the continuation points by dots. Volume indicators are most often used on higher timeframes. Features Main Buy or Sell signals Continuation signals No repainting One signal per bar Settings Flying Volume default settings are good enough most
GeoWprPro
Georgij Komarov
WPR by Profile, or WPR for Professionals Geo_WprPro is one of the well-known currency profile indicators. It simultaneously displays two WPR indicators with different parameters in the matrix form on all timeframes of multiple currency pairs forming the currency profile . As follows from the description, " WPR is a leading indicator that often goes ahead of the price chart. The oscillator frequently reaches extreme values before the price reversal as if anticipating that event: it almost always
Strong Retracement Points Pro demo edition! SRP (Strong Retracement/Reversal Points) is a powerful and unique support and resistance indicator. It displays the closest important levels which we expect the price retracement/reversal! If all level are broken from one side, it recalculates and draws new support and resistance levels, so the levels might be valid for several days depending on the market! If you are still hesitating to start using this wonderful tool, you can check this link to see h
VR Cub
Vladimir Pastushak
VR Cub ist ein Indikator für den Erhalt hochwertiger Einstiegspunkte. Der Indikator wurde entwickelt, um mathematische Berechnungen zu erleichtern und die Suche nach Einstiegspunkten in eine Position zu vereinfachen. Die Handelsstrategie, für die der Indikator geschrieben wurde, hat sich seit vielen Jahren bewährt. Ihr großer Vorteil liegt in der Einfachheit der Handelsstrategie, die es auch unerfahrenen Händlern ermöglicht, erfolgreich damit zu handeln. VR Cub berechnet Positionseröffnungspunkt
Judas Swing ICT Forex With Confirmation Indicator MT4 The Judas Swing ICT Forex with Confirmation Indicator is designed based on the ICT trading approach, leveraging market structure and liquidity analysis within the one-minute chart. This tool assists traders in recognizing key liquidity zones and significant trend reversals. This MetaTrader 4 indicator highlights areas where liquidity builds up and potential false breakouts, commonly referred to as Judas Swings . These zones are distinctly mar
FREE
Ultimate Hero MT4
Smart Forex Lab.
5 (1)
Gebaut für maximale Leistung. Optimiert für Gewinnentnahmen. Einführung einer neuen Option - Testen mit Emulation von Gewinnabhebungen. Ultimate Hero ist ein fortschrittliches Handelswerkzeug, das entwickelt wurde, um Ihre Forex-Gewinne zu maximieren. Diese fortschrittliche Handelssoftware wurde mit der neuesten GPT-4-Technologie entwickelt und verfügt über eine breite Palette an fortschrittlichen Funktionen. Ultimate Hero ist ein Handelsroboter, der eine auf dem Martingale-System basierende Gi
Binary Options Assistant (BOA) ICE Signals Indicator provides signals based on gkNextLevel Binary Options Strategy.  Indicators: 2 Bollinger Bands & Stochastic Stop missing trades, stop jumping from chart to chart looking for trade set-ups and get all the signals on 1 chart! U se any of the BOA Signals Indicator with the  Binary Options Assistant (BOA) Multi Currency Dashboard .   All BOA Signal Indicator settings are adjustable to give you more strategy combinations. The signals can be seen
FREE
Market Structure Zig Zag
Lesedi Oliver Seilane
4.63 (27)
Free Market structure zig zag to assist in price action trading the screenshots describe how to use and how to spot patterns new version comes with alerts, email alert and  push notification alert can be used on all pairs  can be used on all timeframes  you can add additional confirmation indicators the indicator shows you your higher high and low highs as well as your lower lows and lower highs  the indication makes price action analysis easier to spot.
FREE
ToolBox 360 is the swiss knife of all indicators. It is full packed with useful tools to help you with your trading. It can be used to find best entry and exit points and help you to decide if you should open a trade or not. It shows market trends, candlestick formations outside / inside bars and you can sett time based allerts. Main features: Time based Fibonacci lines Choose a start and end time and the indicator shows you Fibonacci lines within the selected time range including range high a
No Repaint Bext ist ein vollständiges Handelssystem. Es zeigt an, wann eine Position geöffnet oder geschlossen werden soll und in welche Richtung gehandelt werden muss. Jedes Mal, wenn ein grüner Pfeil erscheint, sollte eine Kaufposition eröffnet werden. Alle Kaufpositionen werden geschlossen, sobald ein roter Pfeil erscheint. Umgekehrt wird bei einem roten Pfeil eine Verkaufsposition eröffnet, die geschlossen wird, sobald ein grüner Pfeil erscheint. Der Handel erfolgt auf dem M5-Zeitrahmen und
The Smart Martin advisor automates a trading strategy based on support/resistance levels for EURUSD (H1 timeframe). Key Features: Precise entry based on breakout/bounce from levels. Strict risk management: fixed Stop Loss and Take Profit. False signal filtering through volatility analysis. Strategy Details Entry Rules Levels are built based on technical price analysis. Exit Rules Stop Loss: 200 points from the entry level (fixed). Take Profit: 200 points (risk-reward ratio 1:1). Settings Para
EARLY REMINDER: The Starting price is 65 price will rise soon up to 365$ and then 750$ after first 10 copies of sales. Grab this offer now! Introduction Hello, traders! Welcome to the demonstration of the Forex Beast Indicator , a comprehensive tool designed to assist aspiring traders in navigating the complexities of the forex market. This indicator incorporates seven essential components to provide a well-rounded trading experience: Moving Averages Colored Zones Support and Resistance Levels
The principle of this indicator is very simple: detecting the trend with Moving Average, then monitoring the return point of graph by using the crossing of Stochastic Oscillator and finally predicting BUY and SELL signal with arrows, alerts and notifications. The parameters are fixed and automatically calculated on each time frame. Example: If you install indicator on EURUSD, timeframe M5: the indicator will detect the main trend with the Moving Average on this timeframe (for example the Moving
The High Low indicator is a very simple indicator that has the task of showing us the minimum and maximum levels of the time frame that we wish to underline. This indicator also has the ability to show you minimum and maximum price levels of institutional periods as a level, such as quarterly, half-yearly and annual. We believe these minimum and maximum levels are the true key market levels and therefore a correct visualization on the graph is able to show the important price levels.
Käufer dieses Produkts erwarben auch
Derzeit 20% Rabatt! Die beste Lösung für jeden Neueinsteiger oder Expert Händler! Dieses Dashboard arbeitet mit 28 Währungspaaren. Es basiert auf 2 unserer Hauptindikatoren (Advanced Currency Strength 28 und Advanced Currency Impulse). Es bietet einen hervorragenden Überblick über den gesamten Forex-Markt. Es zeigt die Werte der Advanced Currency Strength, die Veränderungsrate der Währungen und die Signale für 28 Devisenpaare in allen (9) Zeitrahmen. Stellen Sie sich vor, wie sich Ihr Handel
Scalper Inside PRO
Alexey Minkov
4.76 (63)
!SPECIAL SALE! An exclusive indicator that utilizes an innovative algorithm to swiftly and accurately determine the market trend. The indicator automatically calculates opening, closing, and profit levels, providing detailed trading statistics. With these features, you can choose the most appropriate trading instrument for the current market conditions. Additionally, you can easily integrate your own arrow indicators into Scalper Inside Pro to quickly evaluate their statistics and profitability
Golden Trend Indicator
Noha Mohamed Fathy Younes Badr
4.9 (10)
Golden Trend indicator  is The best indicator for predicting trend movement this indicator never lags and never repaints and never back paints    and give  arrow buy and sell    before the candle appear  and it will help you and  will make your trading decisions clearer its work on all currencies and  gold and crypto and all time frame This unique  indicator uses very secret algorithms to catch the  trends, so you can trade using this indicator and see the trend clear on charts  manual guide and
Easy Breakout
Mohamed Hassan
5 (10)
After your purchase, feel free to contact me for more details on how to receive a bonus indicator called VFI, which pairs perfectly with Easy Breakout for enhanced confluence!   Easy Breakout is a powerful price action trading system built on one of the most popular and widely trusted strategies among traders: the Breakout strategy ! This indicator delivers crystal-clear Buy and Sell signals based on breakouts from key support and resistance zones. Unlike typical breakout indicators, it levera
Enigmera
Ivan Stefanov
5 (7)
ENIGMERA: Der Kern des Marktes Wichtig: Die MQL5.com-Demo wird im Strategy Tester ausgeführt und spiegelt möglicherweise nicht vollständig die Funktionalität von Enigmera wider. Überprüfen Sie die Beschreibung, Screenshots und das Video für Details. Zögern Sie nicht, mir bei Fragen eine Nachricht zu senden! Der Code des Indikators wurde vollständig neu geschrieben. Version 3.0 fügt neue Funktionen hinzu und behebt Fehler, die seit der Einführung des Indikators aufgetreten sind. Einführung Dies
Linear Trend Predictor – Ein Trendindikator, der Einstiegspunkte und Richtungsunterstützungslinien kombiniert. Funktioniert nach dem Prinzip des Durchbrechens des Hoch-/Tiefpreiskanals. Der Indikatoralgorithmus filtert Marktrauschen und berücksichtigt Volatilität und Marktdynamik. Indikatorfunktionen  Mithilfe von Glättungsmethoden zeigt es den Markttrend und Einstiegspunkte zum Öffnen von Kauf- oder Verkaufsaufträgen an.  Geeignet zum Bestimmen kurzfristiger und langfristiger Marktbewegungen
GOLD Impulse with Alert
Bernhard Schweigert
4.6 (10)
Dieser Indikator ist eine hervorragende Kombination aus unseren 2 Produkten Advanced Currency IMPULSE with ALERT  +   Currency Strength Exotics . Es funktioniert für alle Zeitrahmen und zeigt grafisch Impulse der Stärke oder Schwäche für die 8 wichtigsten Währungen plus ein Symbol! Dieser Indikator ist darauf spezialisiert, die Beschleunigung der Währungsstärke für beliebige Symbole wie Gold, Exotische Paare, Rohstoffe, Indizes oder Futures anzuzeigen. Als erster seiner Art kann jedes Symbol
Dynamic Forex28 Navigator
Bernhard Schweigert
5 (5)
Dynamic Forex28 Navigator – Das Forex-Handelstool der nächsten Generation AKTUELL 49 % RABATT. Dynamic Forex28 Navigator ist die Weiterentwicklung unserer seit langem beliebten Indikatoren und vereint die Leistung von drei in einem: Advanced Currency Strength28 Indicator (695 Bewertungen) + Advanced Currency IMPULSE mit ALERT (520 Bewertungen) + CS28 Combo Signals (Bonus) Details zum Indikator https://www.mql5.com/en/blogs/post/758844 Was bietet der Strength Indicator der nächsten Generation?
Algo Pumping MT4
Ihor Otkydach
5 (4)
PUMPING STATION – Ihre persönliche „All-inclusive“-Strategie Wir präsentieren Ihnen PUMPING STATION – einen revolutionären Forex-Indikator, der Ihr Trading in eine spannende und effektive Erfahrung verwandeln wird. Es handelt sich nicht nur um ein Hilfsmittel, sondern um ein vollwertiges Handelssystem mit leistungsstarken Algorithmen, die Ihnen helfen, stabiler zu traden. Beim Kauf dieses Produkts erhalten Sie KOSTENLOS: Exklusive Set-Dateien: Für automatische Einrichtung und maximale Leistung.
FX Volume
Daniel Stein
4.6 (35)
FX Volume: Erleben Sie den echten Marktüberblick aus der Sicht eines Brokers Kurzüberblick Möchten Sie Ihre Handelsstrategie auf das nächste Level bringen? FX Volume liefert Ihnen Echtzeit-Einblicke in die Positionierung von Retail-Tradern und Brokern — lange bevor verzögerte Berichte wie der COT verfügbar sind. Ob Sie nach beständigen Gewinnen streben oder einfach einen tieferen Vorteil am Markt suchen, FX Volume hilft Ihnen, große Ungleichgewichte zu erkennen, Breakouts zu bestätigen und Ihr
DERZEIT 26% RABATT Die beste Lösung für jeden Newbie oder Expert Trader! Dieser Indikator ist ein einzigartiges, qualitativ hochwertiges und erschwingliches Trading-Tool, da wir eine Reihe von proprietären Funktionen und eine neue Formel integriert haben. Mit nur EINEM Chart können Sie die Währungsstärke für 28 Forex-Paare ablesen! Stellen Sie sich vor, wie sich Ihr Handel verbessern wird, weil Sie in der Lage sind, den genauen Auslösungspunkt eines neuen Trends oder einer Scalping-Gelegenhei
Zyklischer Indikator für den Handel und die Prognose der Marktrichtung. Zeigt das zyklische Verhalten des Preises in Form eines Oszillators. Gibt Signale für die Eröffnung von Trades aus, wenn es eine Erholung von der Ober- und Untergrenze des Oszillators gibt. In Form eines Histogramms zeigt es die geglättete Stärke des Trends.  Ergänzt jede Handelsstrategie, vom Scalping bis zum Intraday.  Der Indikator wird nicht neu gezeichnet.  Geeignet für den Einsatz auf allen Symbolen/Instrumenten.  Gee
Advanced Supply Demand
Bernhard Schweigert
4.91 (294)
Derzeit 33% Rabatt! Die beste Lösung für jeden Anfänger oder erfahrenen Händler! Dieser Indikator ist ein einzigartiges, qualitativ hochwertiges und erschwingliches Trading-Tool, da wir eine Reihe von proprietären Funktionen und eine neue Formel integriert haben. Mit diesem Update werden Sie in der Lage sein, doppelte Zeitrahmenzonen anzuzeigen. Sie können nicht nur einen höheren TF (Zeitrahmen) anzeigen, sondern sowohl den Chart-TF als auch den höheren TF: SHOWING NESTED ZONES. Alle Supply Dema
[ MT5 Version ]  [ Kill Zones ]  [ SMT Divergences ] How to trade using Order Blocks:  Click here User Interface Performance:  During testing in the strategy tester, the UI may experience lag. Rest assured, this issue is specific to the testing environment and does not affect the indicator's performance in live trading. Elevate your trading strategy with the  Order Blocks ICT Multi TF  indicator, a cutting-edge tool designed to enhance your trading decisions through advanced order block analys
Gold Venamax MT4
Sergei Linskii
2 (1)
Gold Venamax   – das ist der beste technische Indikator für Aktien. Der Indikatoralgorithmus analysiert die Preisbewegung eines Vermögenswerts und spiegelt die Volatilität und potenzielle Einstiegszonen wider. Indikatorfunktionen: Dies ist ein Super-Indikator mit Magic und zwei Blöcken von Trendpfeilen für komfortables und profitables Trading. Auf dem Diagramm wird eine rote Schaltfläche zum Wechseln von Blöcken angezeigt. Magic ist in den Indikatoreinstellungen eingestellt, sodass Sie den Indi
Wave Synchronizer – visueller Indikator der Wellenanalyse. Kombiniert Candlestick-Bewegungssequenzen und erzeugt gerichtete Wellenmuster, wodurch synchrone Bewegungen mit dem Markt entstehen. Der Beginn jeder Welle wird mit einem Signalpfeil angezeigt, außerdem gibt es Benachrichtigungen. Der Indikator wird die Pfeile im vergangenen Verlauf niemals neu zeichnen oder verschieben. Beim Schließen der Kerze erscheinen Signalpfeile. Passt sich an alle Handelsinstrumente und Zeitrahmen an. Einfach zu
Eine persönliche Implementierung von Order Blocks, einer einfachen, aber effektiven Positionshandelsstrategie. Der Trader sollte in den Markt einsteigen oder nach Trades in Richtung des letzten Orderblocks suchen, wenn die Preisspanne nicht in die entgegengesetzte Richtung des Ausbruchs durchbrochen wurde. Offene Blöcke sind aus Gründen der Übersichtlichkeit nicht gezeichnet. [ Installationsanleitung | Update-Anleitung | Fehlerbehebung | FAQ | Alle Produkte ] Ein zinsbullischer offener Block is
A precision trading indicator based on W.D. Gann’s square root methods. It plots real-time, non-repainting support and resistance levels to help traders confidently spot intraday and scalping opportunities with high accuracy. William Delbert Gann (W.D. Gann) was an exceptional market analyst, whose trading technique was based on a complex blend of mathematics, geometry, astrology, and ancient mathematics which proved to be extremely accurate. Download the Metatrader 5 Version Message us here aft
Lux Trend
Mohamed Hassan
5 (3)
After purchase, please contact me to get your trading tips + more information for a great bonus!   Lux Trend is a professional strategy based on using Higher Highs and Lower Highs to identify and draw Trendline Breakouts! Lux Trend  utilizes two Moving Averages to confirm the overall trend direction before scanning the market for high-quality breakout opportunities, ensuring more accurate and reliable trade signals. This is a proven trading system used by real traders worldwide, demonstrating
Volume by Price MT4
Brian Collard
4.67 (12)
Volume Profile, Footprint and Market Profile TPO (Time Price Opportunity). Volume and TPO histogram bar and line charts. Volume Footprint charts. TPO letter and block marker collapsed and split structure charts. Static, dynamic and flexible range segmentation and compositing methods with relative and absolute visualizations. Session hours filtering and segment concatenation with Market Watch and custom user specifications. Graphical layering, positioning and styling options to suit the user's a
Grabber System MT4
Ihor Otkydach
3 (2)
Ich präsentiere Ihnen den hervorragenden technischen Indikator Grabber, der als eine vollständig einsatzbereite „All-Inclusive“-Handelsstrategie funktioniert. In einem einzigen Code sind leistungsstarke Werkzeuge zur technischen Marktanalyse, Handelssignale (Pfeile), Alarmfunktionen und Push-Benachrichtigungen integriert. Jeder Käufer dieses Indikators erhält zusätzlich kostenlos: Grabber Utility: ein Tool zur automatischen Verwaltung offener Orders Schritt-für-Schritt-Videoanleitung: wie man de
KT Asian Breakout Indicator
KEENBASE SOFTWARE SOLUTIONS
Der KT Asian Breakout Indikator analysiert einen wichtigen Teil der asiatischen Handelssitzung, um in beide Richtungen Kauf- und Verkaufssignale basierend auf dem Preis-Ausbruch zu generieren. Ein Kaufsignal wird ausgelöst, wenn der Preis das Sitzungs-Hoch durchbricht, und ein Verkaufssignal tritt auf, wenn der Preis das Sitzungs-Tief durchbricht. Wichtige Hinweise Wenn die Sitzungsbox vertikal zu breit ist, sollte ein neuer Trade vermieden werden, da die meisten Kursbewegungen bereits innerhal
NAM Order Blocks
NAM TECH GROUP, CORP.
3 (2)
MT4-Erkennungsanzeige für Auftragsblöcke mit mehreren Zeitrahmen. Eigenschaften - Vollständig anpassbar auf dem Diagrammbedienfeld, bietet vollständige Interaktion. - Verstecken und zeigen Sie das Bedienfeld, wo immer Sie möchten. - Erkennen Sie OBs in mehreren Zeiträumen. - Wählen Sie die anzuzeigende OB-Menge aus. - Verschiedene OBs Benutzeroberfläche. - Verschiedene Filter an OBs. - OB-Näherungsalarm. - ADR High- und Low-Leitungen. - Benachrichtigungsdienst (Bildschirmwarnungen | P
Smart Set up Levels
Mohit Dhariwal
5 (1)
Smart Set up leve l is a very powerful indicator based on the concept of order blocks and set up entries with proper fvg and breakouts to make a very nice level to enter like a pro trader. Very easy to use interface and friendly to enter on buy and sell signals. Works Best on M15 Time frame on Gold, Bitcoin and Fx pairs. Daily 4-5 trades on each pair  Works great on gold like a pro on M15 It is non repainting nor lagging It is very powerful indicator giving precise entries and prop acts can be c
KT Candlestick Patterns MT4
KEENBASE SOFTWARE SOLUTIONS
KT Candlestick Patterns erkennt und markiert in Echtzeit die 24 zuverlässigsten japanischen Kerzenmuster. Bereits im 18. Jahrhundert nutzten japanische Händler diese Muster zur Vorhersage der Kursrichtung. Natürlich ist nicht jedes Kerzenmuster gleich zuverlässig. In Kombination mit anderen technischen Methoden wie Unterstützung und Widerstand liefern sie jedoch ein klares Bild der Marktlage. Dieser Indikator enthält viele Muster, die ausführlich im Buch „Japanese Candlestick Charting Techniqu
A non-repainting, precision tool designed exclusively for XAUUSD/Gold intraday trading. It uses W.D. Gann’s square root method to plot real-time support and resistance levels, helping traders spot high-probability entries with confidence and clarity. William Delbert Gann (W.D. Gann) was an exceptional market analyst, whose trading technique was based on a complex blend of mathematics, geometry, astrology, and ancient mathematics which proved to be extremely accurate. Download the Metatrader 5 Ve
TPSpro RFI Levels
Roman Podpora
4.85 (27)
Umkehrzonen / Spitzenvolumina / Aktive Zonen eines Hauptakteurs =       TS TPSPROSYSTEM ANLEITUNG RUS       /       ANWEISUNGEN       ENG              /          Version MT5 Jeder Käufer dieses Indikators erhält zusätzlich KOSTENLOS: 6 Monate Zugriff auf Handelssignale vom Dienst RFI SIGNALS – vorgefertigte Einstiegspunkte gemäß dem TPSproSYSTEM-Algorithmus. Schulungsmaterialien mit regelmäßigen Updates – tauchen Sie in die Strategie ein und steigern Sie Ihr berufliches Niveau. 24/5-Support an
TPSproTREND PrO
Roman Podpora
4.68 (25)
VERSION MT5        —        ИНСТРУКЦИЯ RUS           —        INSTRUCTIONS  ENG Hauptfunktionen: Präzise Eingangssignale OHNE RENDERING! Wenn ein Signal erscheint, bleibt es relevant! Dies ist ein wichtiger Unterschied zu Redraw-Indikatoren, die ein Signal liefern und es dann ändern können, was zu einem Verlust des eingezahlten Geldes führen kann. Jetzt können Sie mit größerer Wahrscheinlichkeit und Genauigkeit in den Markt eintreten. Es gibt auch eine Funktion zum Einfärben der Kerzen nach de
Bomb Signal
Aleksandr Makarov
Bomb Signal : 100% does not repaint Bonus: when you buy an indicator, you get any indicator for free (optional) . (Write in a private message or in telegram in your profile to receive a bonus) Bomb Signal is a powerful indicator for MetaTrader 4 designed to identify the most relevant trends in the financial market. If you are looking for a tool that accurately predicts movements, Bomb Signal is your ally. How does this work: This indicator combines three different methods – volume analysis, can
Reversal Master
Alexey Minkov
4.92 (13)
!SPECIAL SALE! The Reversal Master is an indicator for determining the current direction of price movement and reversal points. The indicator will be useful for those who want to see the current market situation better. The indicator can be used as an add-on for ready-made trading systems, or as an independent tool, or to develop your own trading systems. The Reversal Master indicator, to determine the reversal points,  analyzes a lot of conditions since the combined analysis gives a more accura
Weitere Produkte dieses Autors
Dies ist wahrscheinlich der vollständigste Indikator für die automatische Erkennung der harmonischen Preisbildung, den Sie für die MetaTrader-Plattform finden können. Es erkennt 19 verschiedene Muster, nimmt Fibonacci-Projektionen genauso ernst wie Sie, zeigt die potenzielle Umkehrzone (PRZ) an und findet geeignete Stop-Loss- und Take-Profit-Werte. [ Installationsanleitung | Update-Anleitung | Fehlerbehebung | FAQ | Alle Produkte ] Es erkennt 19 verschiedene harmonische Preisbildungen Darges
Sind Sie es leid, Unterstützungs- und Widerstandslinien zu zeichnen? Der Unterstützungswiderstand ist ein Multi-Zeitrahmen-Indikator, der Unterstützungs- und Widerstandslinien mit einer sehr interessanten Wendung automatisch erkennt und zeichnet: Wenn das Preisniveau im Laufe der Zeit getestet wird und seine Bedeutung zunimmt, werden die Linien dicker und dunkler. [ Installationsanleitung | Update-Anleitung | Fehlerbehebung | FAQ | Alle Produkte ] Steigern Sie Ihre technische Analyse über Nacht
PZ Trend Trading MT5
PZ TRADING SLU
3.8 (5)
Trend Trading ist ein Indikator, der so weit wie möglich von den Markttrends profitiert, indem er Pullbacks und Breakouts zeitlich festlegt. Sie findet Handelsmöglichkeiten, indem sie analysiert, was der Preis während etablierter Trends tut. [ Installationsanleitung | Update-Anleitung | Fehlerbehebung | FAQ | Alle Produkte ] Handeln Sie mit Zuversicht und Effizienz an den Finanzmärkten Profitieren Sie von etablierten Trends, ohne ins Wanken zu geraten Profitable Pullbacks, Ausbrüche und vorze
Dies ist die neueste Iteration meines berühmten Scalpers Goldfinch EA, der vor fast einem Jahrzehnt zum ersten Mal veröffentlicht wurde. Sie lenkt den Blick auf plötzliche Volatilitätsausweitungen, die in kurzen Zeiträumen stattfinden: Sie geht davon aus, dass die Trägheit der Preisbewegung nach einer plötzlichen Preisbeschleunigung ausgenutzt wird, und versucht, sie zu nutzen. Diese neue Version wurde vereinfacht, damit der Händler die Optimierungsfunktion des Testers leicht nutzen kann, um die
PZ Swing Trading MT5
PZ TRADING SLU
5 (5)
Swing Trading ist der erste Indikator, der Schwankungen in Trendrichtung und mögliche Umkehrschwankungen erkennt. Es wird der in der Handelsliteratur weit verbreitete Baseline-Swing-Trading-Ansatz verwendet. Der Indikator untersucht mehrere Preis- und Zeitvektoren, um die aggregierte Trendrichtung zu verfolgen und erkennt Situationen, in denen der Markt überverkauft oder überkauft ist und zur Korrektur bereit ist. [ Installationsanleitung | Update-Anleitung | Fehlerbehebung | FAQ | Alle Produkte
PZ Harmonacci Patterns
PZ TRADING SLU
3.17 (6)
Dies ist wahrscheinlich der vollständigste Indikator für die automatische Erkennung der harmonischen Preisbildung, den Sie für die MetaTrader-Plattform finden können. Es erkennt 19 verschiedene Muster, nimmt Fibonacci-Projektionen genauso ernst wie Sie, zeigt die potenzielle Umkehrzone (PRZ) an und findet geeignete Stop-Loss- und Take-Profit-Werte. [ Installationsanleitung | Update-Anleitung | Fehlerbehebung | FAQ | Alle Produkte ] Es erkennt 19 verschiedene harmonische Preisbildungen Darges
PZ Trend Trading
PZ TRADING SLU
4.8 (5)
Trend Trading ist ein Indikator, der so weit wie möglich von den Markttrends profitiert, indem er Pullbacks und Breakouts zeitlich festlegt. Sie findet Handelsmöglichkeiten, indem sie analysiert, was der Preis während etablierter Trends tut. [ Installationsanleitung | Update-Anleitung | Fehlerbehebung | FAQ | Alle Produkte ] Handeln Sie mit Zuversicht und Effizienz an den Finanzmärkten Profitieren Sie von etablierten Trends, ohne ins Wanken zu geraten Profitable Pullbacks, Ausbrüche und vorze
This is the latest iteration of my famous indicator, Reversal Fractals, published for the first time almost a decade ago. It examines the price structure of fractals to determine possible reversal points in the market, providing timing to positional traders that already have a fundamental or technical valuation model. [ Installation Guide | Update Guide | Troubleshooting | FAQ | All Products ] Reversal fractals can start long trends The indicator is non repainting It implements alerts of all ki
Tired of plotting trendlines? The PZ TrendLines MT5 indicator applies a mechanical approach to the construction of trend lines for you! [ Installation Guide | Update Guide | Troubleshooting | FAQ | All Products ] It can draw up to 18 trendlines Trendlines can be optionally based on fractals Each line represents a breakout level Each trendline can be broken or rejected Configurable amount of lines Configurable colors Author Arturo López Pérez, private investor and speculator, software engineer a
PZ Wolfe Waves
PZ TRADING SLU
1 (1)
Wolfe Waves sind natürlich vorkommende Handelsmuster, die an allen Finanzmärkten vorhanden sind und einen Kampf um einen Gleichgewichtspreis darstellen. Diese Muster können sich über kurze und lange Zeiträume entwickeln und sind eines der zuverlässigsten prädiktiven Umkehrmuster, die es gibt und die normalerweise starken und langen Kursbewegungen vorausgehen. [ Installationsanleitung | Update-Anleitung | Fehlerbehebung | FAQ | Alle Produkte ] Klare Handelssignale Erstaunlich einfach zu handeln
PZ Support Resistance
PZ TRADING SLU
3.33 (3)
Sind Sie es leid, Unterstützungs- und Widerstandslinien zu zeichnen? Der Unterstützungswiderstand ist ein Multi-Zeitrahmen-Indikator, der Unterstützungs- und Widerstandslinien mit einer sehr interessanten Wendung automatisch erkennt und zeichnet: Wenn das Preisniveau im Laufe der Zeit getestet wird und seine Bedeutung zunimmt, werden die Linien dicker und dunkler. [ Installationsanleitung | Update-Anleitung | Fehlerbehebung | FAQ | Alle Produkte ] Steigern Sie Ihre technische Analyse über Nacht
PZ Turtle Trading EA MT5
PZ TRADING SLU
2.75 (4)
Dieser Expertenberater implementiert das ursprüngliche Handelssystem von Dennis und Eckhardt, das allgemein als The Turtle Trader bekannt ist. Es handelt genau wie die ursprünglichen Turtles und kann von erfahrenen Tradern verwendet werden, um Trends in auf- oder absteigenden Märkten zu erfassen. [ Installationsanleitung | Update-Anleitung | Fehlerbehebung | FAQ | Alle Produkte ] Einfach zu bedienen und zu überwachen Vollständig konfigurierbare Strategieeinstellungen Voll konfigurierbare Handel
PZ Goldfinch Scalper EA
PZ TRADING SLU
1 (5)
Dies ist die neueste Iteration meines berühmten Scalpers Goldfinch EA, der vor fast einem Jahrzehnt zum ersten Mal veröffentlicht wurde. Sie lenkt den Blick auf plötzliche Volatilitätsausweitungen, die in kurzen Zeiträumen stattfinden: Sie geht davon aus, dass die Trägheit der Preisbewegung nach einer plötzlichen Preisbeschleunigung ausgenutzt wird, und versucht, sie zu nutzen. Diese neue Version wurde vereinfacht, damit der Händler die Optimierungsfunktion des Testers leicht nutzen kann, um die
Dieser Indikator analysiert vergangene Preisbewegungen, um den Kauf- und Verkaufsdruck auf dem Markt zu antizipieren. Dabei wird in die Vergangenheit zurückgeschaut und Preisspitzen und -täler um den aktuellen Preis analysiert. Es ist ein Bestätigungsindikator auf dem neuesten Stand der Technik. [ Installationsanleitung | Update-Anleitung | Fehlerbehebung | FAQ | Alle Produkte ] Prognostizieren Sie den Kauf- und Verkaufsdruck auf dem Markt Vermeiden Sie den Kauf und Verkauf von Raserei Keine Ei
Dieser Expertenberater implementiert das ursprüngliche Handelssystem von Dennis und Eckhardt, das allgemein als The Turtle Trader bekannt ist. Es handelt genau wie die ursprünglichen Turtles und kann von erfahrenen Tradern verwendet werden, um Trends in auf- oder absteigenden Märkten zu erfassen. [ Installationsanleitung | Update-Anleitung | Fehlerbehebung | FAQ | Alle Produkte ] Einfach zu bedienen und zu überwachen Vollständig konfigurierbare Strategieeinstellungen Voll konfigurierbare Handel
Tired of plotting trendlines? The PZ TrendLines indicator applies a mechanical approach to the construction of trend lines for you! [ Installation Guide | Update Guide | Troubleshooting | FAQ | All Products ] It can draw up to 18 trendlines Trendlines can be optionally based on fractals Each line represents a breakout level Each trendline can be broken or rejected Configurable amount of lines Configurable colors Author Arturo López Pérez, private investor and speculator, software engineer and
This indicator analyzes price action patterns and helps you to make positive equity decisions in the binary options market. [ Installation Guide | Update Guide | Troubleshooting | FAQ | All Products ] Easy to trade Trade both call and put options No crystal ball and no predictions The indicator is non-repainting The only strategy suitable for binary options is applying a mathematical approach, like professional gamblers do. It is based on the following principles: Every binary option represents
This is a smooth and responsive accelerometer which reveals the market trend and strength. [ Installation Guide | Update Guide | Troubleshooting | FAQ | All Products ] Two moving averages indicate trend direction The histogram represents strength of the price movement It draws buy and sell zones as colored vertical lines Should be used as a confirmation indicator Customizable line widths and colors It implements alerts of all kinds This indicator is similar to MACD but aims to react faster to
PZ Risk Management
PZ TRADING SLU
5 (1)
This indicator monitors the vital constants of your trading account to keep it healthy and away from excessive risks. It monitors all trades, absolute exposure, account floating point and leverage currently in use, using different color codes for your interpretation.  [ Installation Guide | Update Guide | Troubleshooting | FAQ | All Products ] Amazingly easy to understand The indicator is clean and simple It calculates exposure by pairs and currencies Keep your used leverage controlled at all ti
This indicator evaluates the market sentiment using raw price action measurements, and it is an amazing trading confirmation. It can be used to take a trend-trade approach or a contrarian approach using reversal patterns. [ Installation Guide | Update Guide | Troubleshooting | FAQ | All Products ] Find early reversals Confirm short-term trades Detect indecision on the market Take contrarian trades near support and resistance levels Trade inside bars confirmed by overall direction of the market T
This indicator displays pivot points in the chart, including historical vales, and supports many calculation modes for Pivot Points and S/R levels. [ Installation Guide | Update Guide | Troubleshooting | FAQ | All Products ] It plots historical levels for backtesting purposes It allows you to select the reference timeframe It implements different Pivot Point calculation modes It implements different SR calculation modes It implements customizable colors and sizes Calculation Modes The indicato
Dieser Indikator erkennt über 30 japanische Candlestick-Muster und hebt sie wunderschön auf der Karte hervor. Es ist einfach einer dieser Indikatoren, auf die Preisaktionshändler nicht verzichten können. Steigern Sie Ihre technische Analyse über Nacht Erkennen Sie leicht japanische Kerzenmuster Handeln Sie zuverlässig und mit universellen Umkehrmustern Springen Sie mithilfe von Fortsetzungsmustern sicher auf etablierte Trends Der Indikator ist nicht neu lackiert und implementiert Warnungen Der
PZ Day Trading
PZ TRADING SLU
3.67 (3)
Dieser Indikator erkennt Preisumkehrungen im Zick-Zack, wobei nur Preisaktionsanalysen und ein Donchian-Kanal verwendet werden. Es wurde speziell für den kurzfristigen Handel entwickelt, ohne dass ein Nachlackieren oder ein Backpainting erforderlich ist. Es ist ein fantastisches Werkzeug für clevere Trader, die darauf abzielen, das Timing ihrer Operationen zu verbessern. [ Installationsanleitung | Update-Anleitung | Fehlerbehebung | FAQ | Alle Produkte ] Erstaunlich einfach zu handeln Es biet
This is a smooth and responsive accelerometer which reveals the market trend and strength. [ Installation Guide | Update Guide | Troubleshooting | FAQ | All Products ] Two moving averages indicate trend direction The histogram represents strength of the price movement It draws buy and sell zones as colored vertical lines Should be used as a confirmation indicator Customizable line widths and colors It implements alerts of all kinds This indicator is similar to MACD but aims to react faster to
PZ Swing Trading
PZ TRADING SLU
5 (3)
Swing Trading ist der erste Indikator, der Schwankungen in Trendrichtung und mögliche Umkehrschwankungen erkennt. Es wird der in der Handelsliteratur weit verbreitete Baseline-Swing-Trading-Ansatz verwendet. Der Indikator untersucht mehrere Preis- und Zeitvektoren, um die aggregierte Trendrichtung zu verfolgen und erkennt Situationen, in denen der Markt überverkauft oder überkauft ist und zur Korrektur bereit ist. [ Installationsanleitung | Update-Anleitung | Fehlerbehebung | FAQ | Alle Produkte
PZ Turtle Trading
PZ TRADING SLU
5 (3)
The Turtle Trading Indicator implements the original Dennis Richards and Bill Eckhart trading system, commonly known as The Turtle Trader. This trend following system relies on breakouts of historical highs and lows to take and close trades: it is the complete opposite to the "buy low and sell high" approach. The main rule is "Trade an N-day breakout and take profits when an M-day high or low is breached (N must me above M)". [ Installation Guide | Update Guide | Troubleshooting | FAQ | All Prod
Dieser Indikator bewertet gleichzeitig die Volatilität und die Kursrichtung, wobei die folgenden Ereignisse ermittelt werden. [ Installationsanleitung | Update-Anleitung | Fehlerbehebung | FAQ | Alle Produkte ] Entscheidende und plötzliche Preisbewegungen Große Hämmer / Sternschnuppenmuster Starke Ausbrüche, die von den meisten Marktteilnehmern unterstützt werden Unentschlossene, aber volatile Marktsituationen Es ist ein extrem einfach zu verwendender Indikator ... Das blaue Histogramm repräsen
This indicator evaluates the market sentiment using raw price action measurements, and it is an amazing trading confirmation. It can be used to take a trend-trade approach or a contrarian approach using reversal patterns. [ Installation Guide | Update Guide | Troubleshooting | FAQ | All Products ] Find early reversals Confirm short-term trades Detect indecision on the market Take contrarian trades near support and resistance levels Trade inside bars confirmed by overall direction of the market T
This indicator calculates how much has an instrument won or lost in percentage terms on each bar displayed in the chart. [ Installation Guide | Update Guide | Troubleshooting | FAQ | All Products ] Identify market patterns Find decisive price movements Be suspicious about overbought/oversold situations It is an extremely easy to use indicator... The blue histogram represents winning bars The red histogram represents losing bars The gray line represents the average win/loss per bar Labels are pl
PZ ABCD Retracement
PZ TRADING SLU
4 (5)
Dieser Indikator findet AB = CD-Retracement-Muster. Das AB = CD-Retracement-Muster ist eine 4-Punkte-Preisstruktur, bei der das anfängliche Preissegment teilweise zurückverfolgt wird, gefolgt von einer Bewegung mit gleichem Abstand vom Abschluss des Pullbacks, und die Basis für alle harmonischen Muster ist. [ Installationsanleitung | Update-Anleitung | Fehlerbehebung | FAQ | Alle Produkte ] Anpassbare Mustergrößen Anpassbare AC- und BD-Verhältnisse Anpassbare Pausenzeiten Anpassbare Linien,
Auswahl:
Keine Bewertungen
Antwort auf eine Rezension
Version 1.2 2019.08.09
- Minor improvements