PZ Day Trading
- Indikatoren
- PZ TRADING SLU
- Version: 8.0
- Aktualisiert: 17 Juli 2024
- Aktivierungen: 20
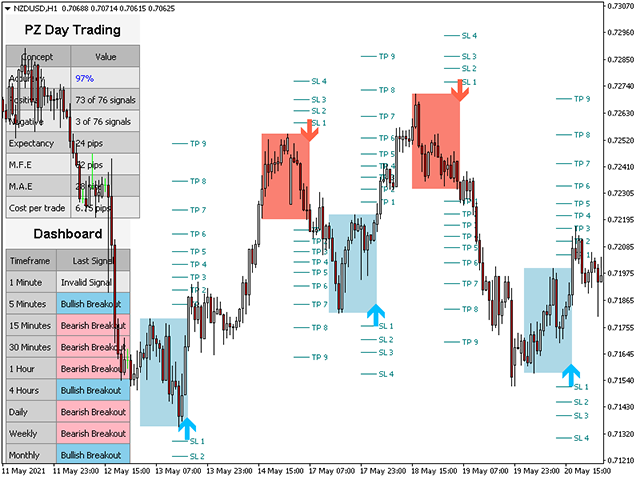
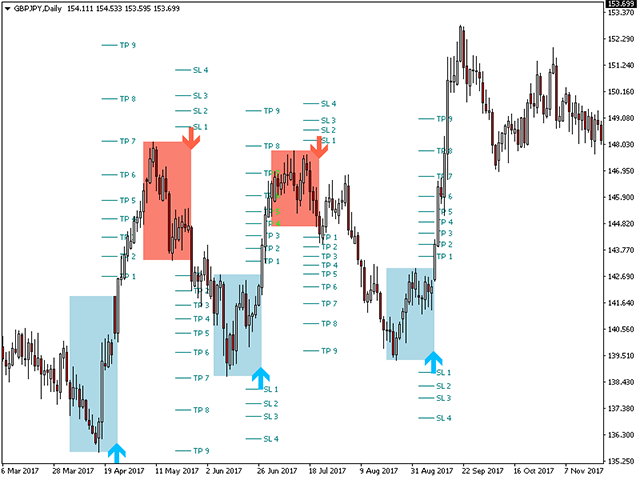
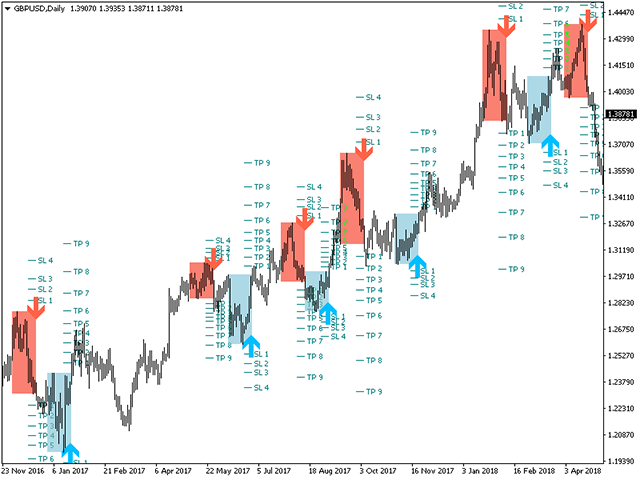
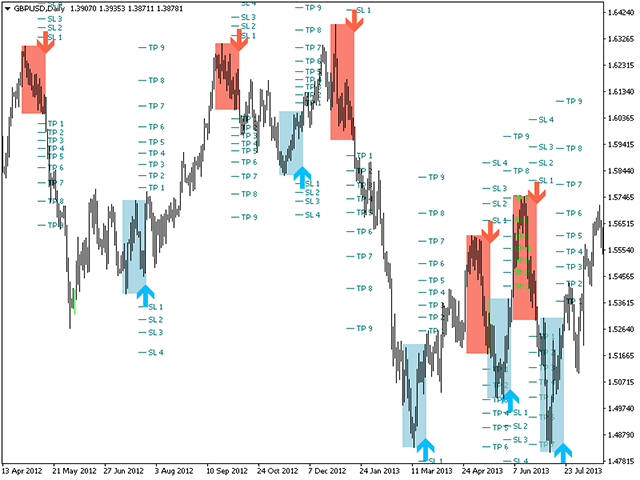
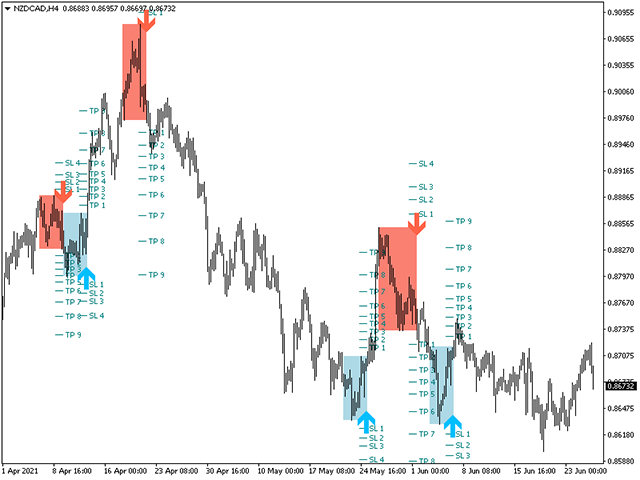
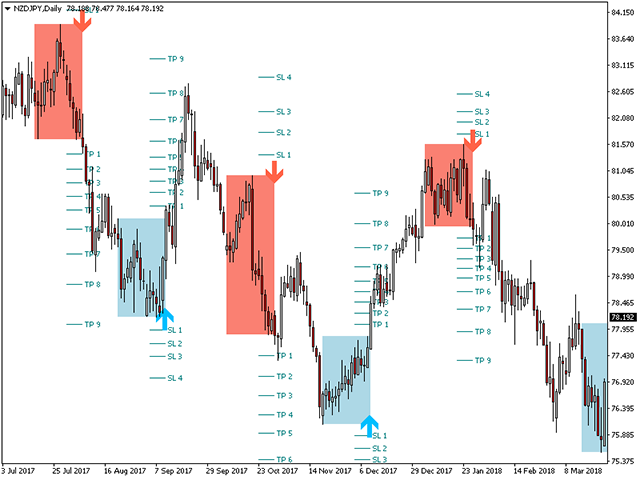
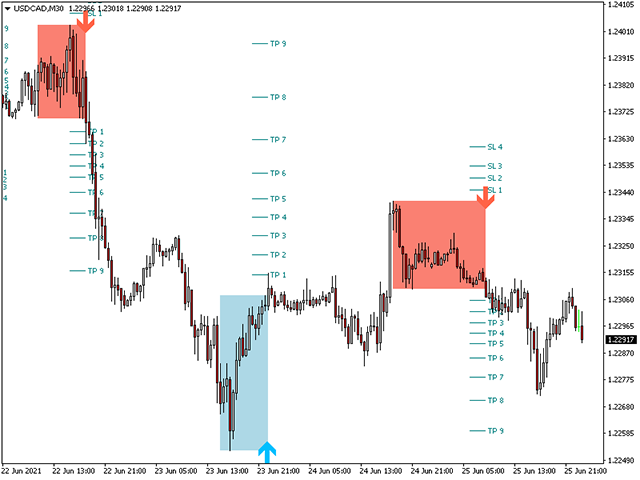
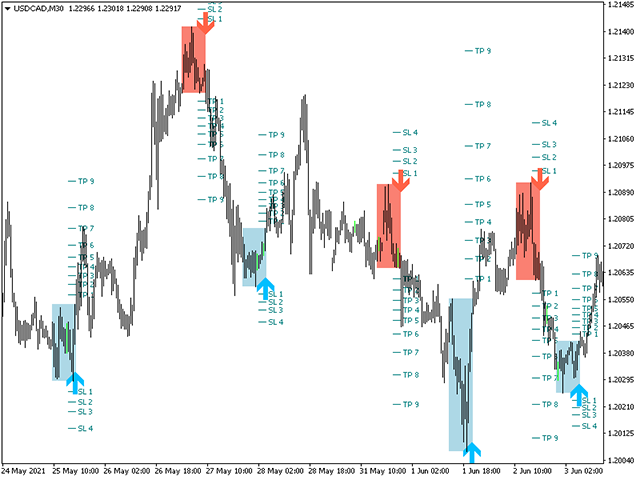
Dieser Indikator erkennt Preisumkehrungen im Zick-Zack, wobei nur Preisaktionsanalysen und ein Donchian-Kanal verwendet werden. Es wurde speziell für den kurzfristigen Handel entwickelt, ohne dass ein Nachlackieren oder ein Backpainting erforderlich ist. Es ist ein fantastisches Werkzeug für clevere Trader, die darauf abzielen, das Timing ihrer Operationen zu verbessern.
[ Installationsanleitung | Update-Anleitung | Fehlerbehebung | FAQ | Alle Produkte ]
- Erstaunlich einfach zu handeln
- Es bietet Wert in jedem Zeitrahmen
- Es implementiert Selbstanalyse-Statistiken
- Es implementiert E-Mail / Sound / visuelle Warnungen
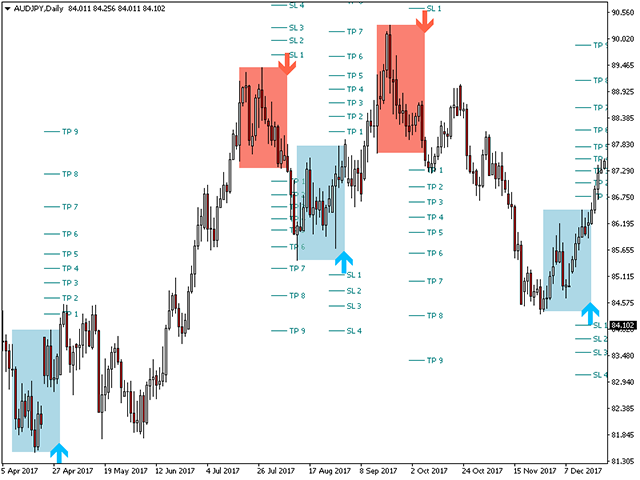
Basierend auf Ausbrüchen und Überlastungszonen variabler Länge verwendet der Indikator nur Preisaktionen, um Trades auszuwählen und reagiert auf das, was der Markt sehr schnell tut.
- Der potenzielle Gewinn vergangener Signale wird angezeigt
- Der Indikator analysiert seine eigene Qualität und Leistung
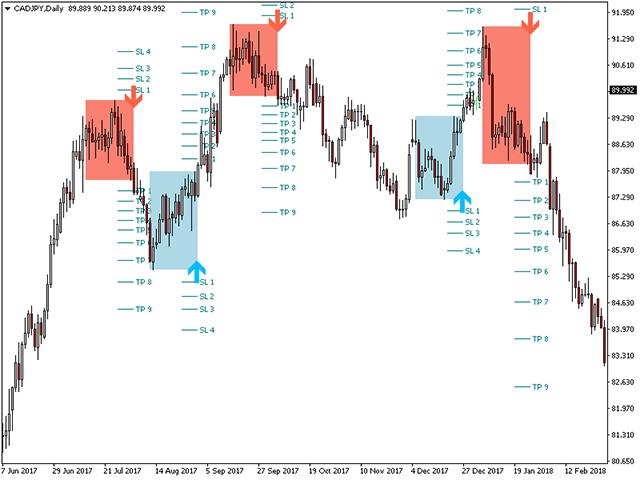
- Verlustbrüche werden hervorgehoben und berücksichtigt
- Der Indikator ist kein Backpainting und kein Repainting
Dieser Indikator hilft Intraday-Händlern, keine einzige Kursumkehr zu verpassen. Es werden jedoch nicht alle Preisstornierungen gleich angelegt und haben nicht die gleiche umsetzbare Qualität. Die Entscheidung, welche Ausbrüche gehandelt und welche ignoriert werden sollen, hängt vom Urteilsvermögen des Händlers ab.
Eingabeparameter
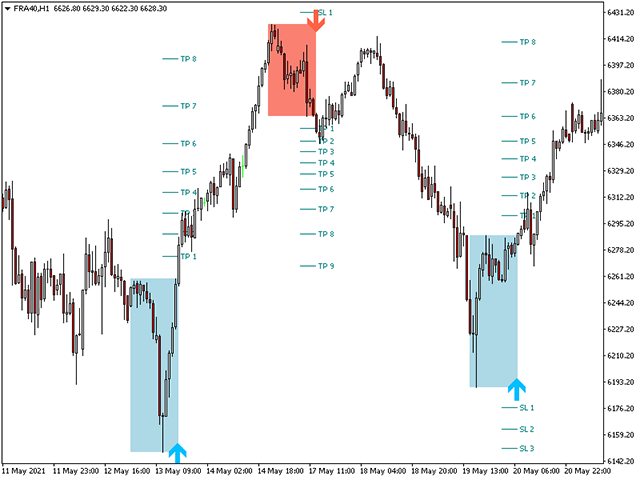
- Reichweite: Die Reichweite ist die Mindestanzahl an Balken, die unterbrochen werden, um einen Ausbruch als gültig zu betrachten und ein Signal zu zeichnen. Wenn Sie den Zeitrahmen verkürzen, müssen Sie diesen Parameter erhöhen. Um beispielsweise Monats-Charts zu handeln, ist ein Bereich von fünf gut, aber um H1-Charts zu handeln, benötigen Sie einen Bereich von mindestens 20-25 Balken.
- Filter: Die Funktion des Filters besteht darin, alternative Signale mithilfe eines Donchian-Kanals und eines Multiplikators der von ihm erstellten Preisspanne voneinander zu trennen. Ein höherer Filter verringert die Signalmenge im Diagramm, erhöht jedoch im Durchschnitt die maximal günstige Auslenkung.
- Max. Verlaufsbalken: Die Anzahl der vorherigen Balken, die beim Laden des Indikators ausgewertet werden sollen. Verringern Sie diesen Wert, um das Laden des Indikators zu beschleunigen.
- Dashboard: Aktivieren oder deaktivieren Sie das Dashboard-Widget für mehrere Zeiträume.
- Statistik: Aktiviert oder deaktiviert das Statistik-Widget. Verwenden Sie die Statistiken, um die besten Parameter für jedes Symbol und jeden Zeitrahmen zu finden. Ändern Sie die Eingangsparameter des Indikators schrittweise, bis Sie die höhere Genauigkeit und Erwartung für möglich halten.
- Anzeigefelder: Blenden Sie die farbigen Felder um die Breakout-Preisspanne ein oder aus.
- Kästchen füllen: Wählen Sie, ob das Innere des Breakout-Kästchens mit Farbe gefüllt werden soll.
- Handelsanalyse: Aktivieren oder deaktivieren Sie die einzelne Handelsanalyse im Diagramm.
- Warnungen: Aktivieren Sie Anzeige- / E-Mail- / Push- / Sound-Warnungen für Ausbrüche.
Autor
Arturo López Pérez, privater Investor und Spekulant, Softwareentwickler und Gründer von Point Zero Trading Solutions.


All PZ tools are very well done.