RSI Pointer
- Indikatoren
- Dominik Mandok
- Version: 1.1
- Aktualisiert: 30 November 2021
- Aktivierungen: 10
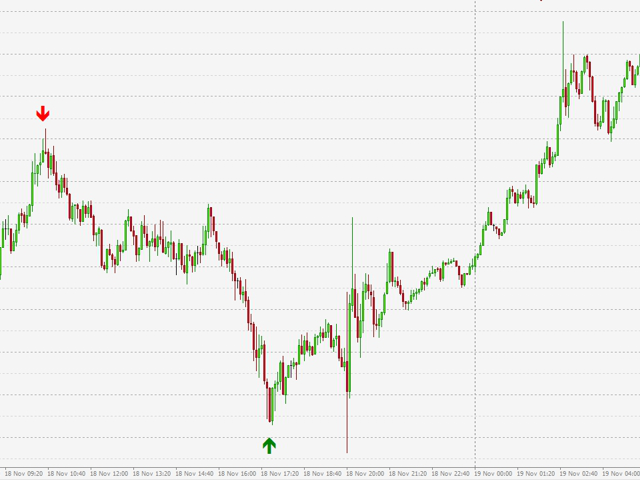
RSI Pointer is an indicator which simply draws arrows on a chart window when the value of RSI (from parameter RSI_Period) is below RSI_Level (green upward pointing arrow) or above 100-RSI_Level (red downward pointing arrow). RSI Pointer works on all timeframes and all currency pairs, commodities, indices, stocks etc.
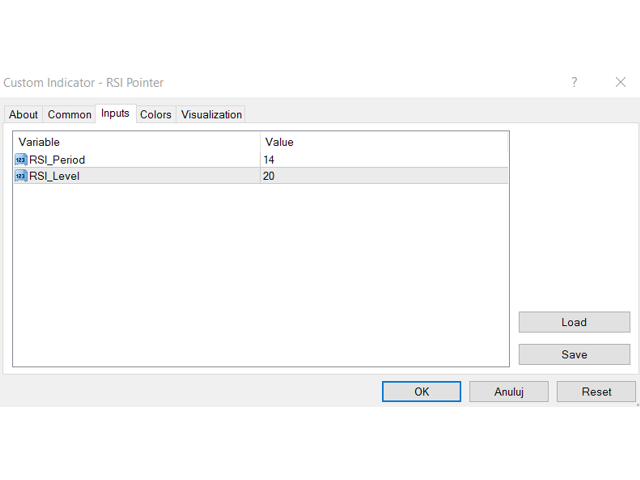
RSI Pointer has only two parameters, RSI_Period and RSI_Level. For example, if you set RSI_Period=7 and RSI_Level=20, the indicator will draw arrows for values below 20 (oversold) and above 80 (overbought). Upper RSI level is always 100-RSI_Level.
RSI Pointer works in chart window, so you do not need RSI indicator in additional separate window to recognize oversold or overbought conditions, which often leads to trend reversals or retracements. Remember to be always careful when important political and macro-economic messages are published, when price oscillates around important support and resistance levels, pivots or round numbers and obviously always pay special attention to price action.
Remember, no one except yourself is responsible for any investment decision made by you. You are responsible for your own investment research and investment decisions. Good luck!
