• Übersicht
  • Bewertungen
  • Diskussion

Volatility Bands

Der Volatility Bands Indikator, auch bekannt als „Concretum Bands“, stellt die obere und untere Begrenzung des Noise-Bereichs nach. Der Indikator hilft Ihnen zu erkennen, wenn der Kurs im Vergleich zur jüngsten „Opening Range“-Bewegung ungewöhnlich stark ausschlägt. Er zeichnet auf Basis der Kursentwicklung in früheren Sessions obere und untere Bänder um den Preis. Wenn der Kurs über diese Bänder hinausläuft – besonders in Kombination mit optionalen Filtern wie einem Exponential Moving Average (EMA) oder Volume-Weighted Average Price (VWAP) – kann das auf einen starken Ausbruch oder eine Trendumkehr hinweisen. Der Indikator zeigt intraday jenes Preisgebiet, in dem sich der Basiswert gewöhnlich bewegt, ohne ein Ungleichgewicht von Angebot und Nachfrage anzudeuten. Überschreitet der Kurs die Grenzen des Noise-Bereichs, deutet das auf ein signifikantes Ungleichgewicht hin, das einen intraday Trend auslösen kann.

Weiterlesen: https://papers.ssrn.com/sol3/papers.cfm?abstract_id=4824172


Berechnung des Indikators

Die Bänder zur Zeit HH:MM werden berechnet, indem man den Eröffnungskurs t nimmt und dann den durchschnittlichen absoluten Kursmove vom Handelsbeginn bis Minute HH:MM über die letzten n Tage addiert bzw. subtrahiert. Lücken über Nacht werden ebenfalls berücksichtigt. Ein Volatilitätsfaktor erlaubt es, die Bandbreite ähnlich wie bei anderen bekannten Indikatoren zu vergrößern oder zu verkleinern. Im Paper wurden 14 Tage als Lookback-Periode und ein Volatilitätsfaktor von 1 verwendet. Diese Werte können vom Anwender leicht angepasst werden.


Inputs und ihre Bedeutung

Session Timing

  • Start Bands / End Bands: Tägliches Zeitfenster zur Berechnung der Opening Range.

  • Opening Range Start / End: Stunde und Minute, wann die Opening Range beginnt und endet.

Indicator Settings

  • Use EMA Filter: Ein/Aus, ob der Kurs in Relation zum EMA liegen muss.

  • EMA Period & Method: Anzahl der Kerzen und Rechenverfahren für den EMA.

  • Volatility Length (k): Anzahl der Sessions, über die der durchschnittliche Move berechnet wird.

  • Volatility Multiplier (vm): Skaliert den Abstand der Bänder (z. B. 1×, 2×).

  • Signal Direction: Nur Long-, nur Short- oder beide Signalarten.

  • Show Signal / Show H/L Range / Show EMA / Show VWAP: Ein/Aus-Schalter für die jeweiligen Darstellungen.

Appearance

  • Noise Area Color: Füllfarbe zwischen oberem und unterem Band.

  • Upper/Lower Bound Color: Linienfarbe der Bänder.

  • Fill Bands: Ein/Aus, ob der Bereich ausgefüllt wird.

  • Extend Bands: Ein/Aus, ob die Bänder über die Session hinaus fortgeschrieben werden.


Interpretation des Indikators

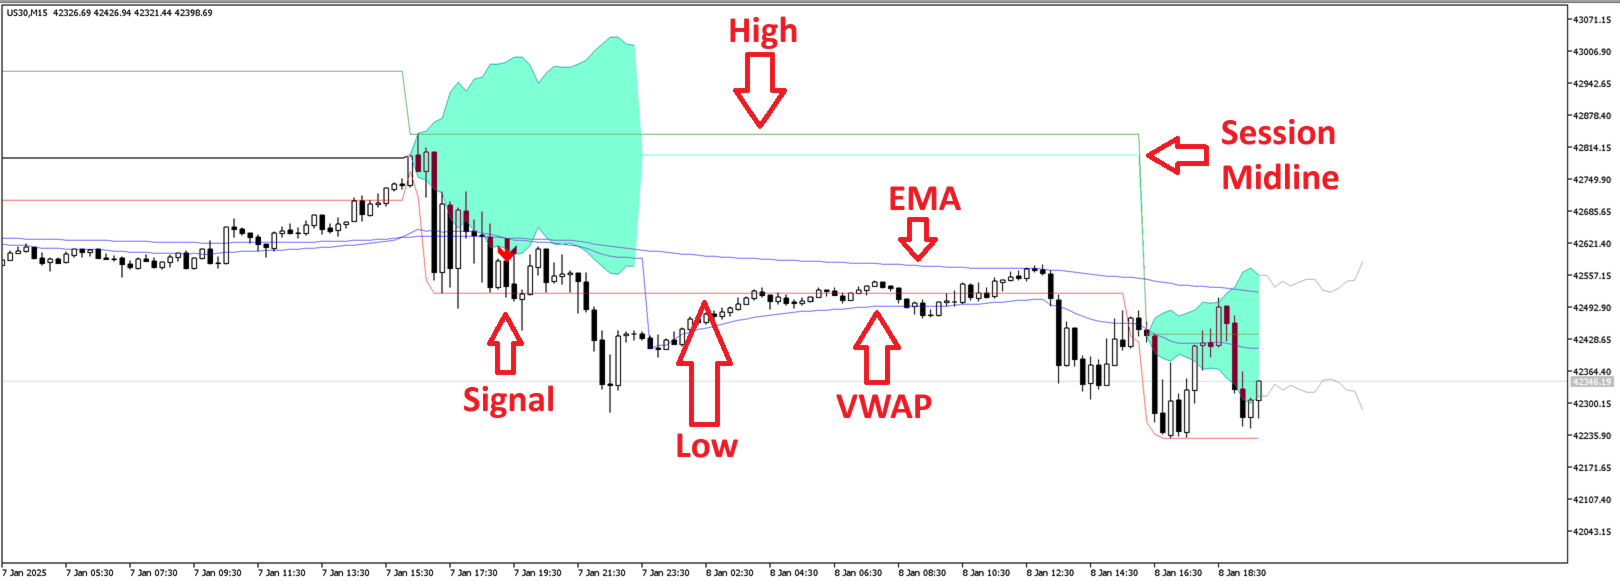
Obere und untere Bänder

  • Diese Linien bilden eine Volatilitäts-Hülle um den Opening-Range-Pivot.

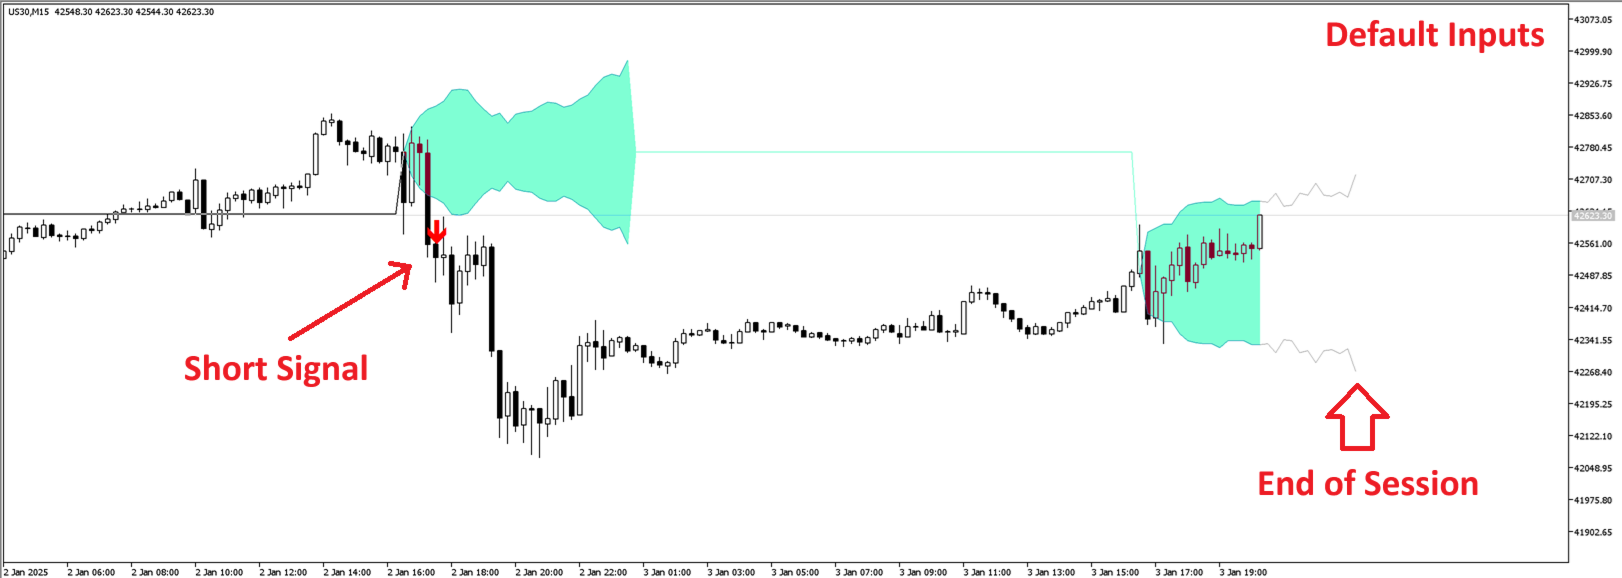
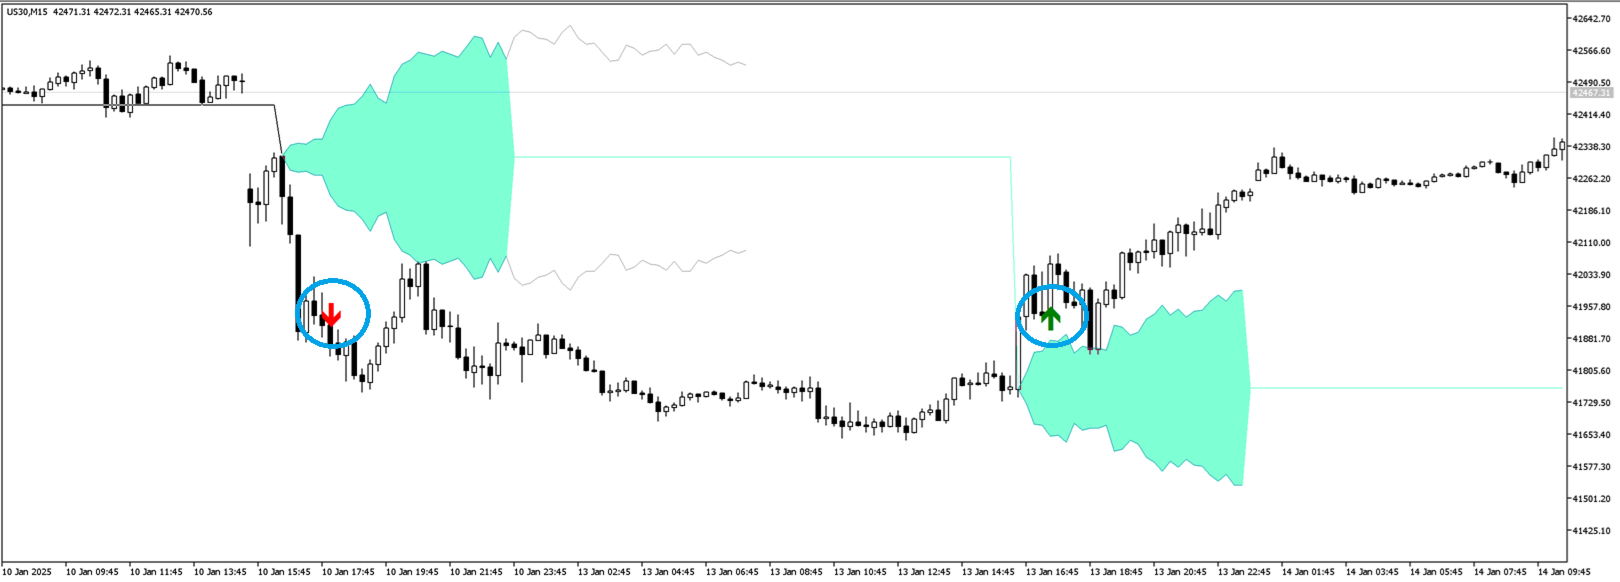
  • Schlusskurse über dem oberen Band deuten auf einen starken bullischen Ausbruch hin.

  • Schlusskurse unter dem unteren Band deuten auf einen starken bärischen Ausbruch hin.

Opening Range High/Low

  • High und Low der gewählten Session erscheinen als eigene Linien.

  • Ein Schluss außerhalb dieser Linien kann ein frühes Signal für einen Ausbruch sein, noch bevor die Volatilitätsbänder erreicht werden.

Kauf- und Verkaufspfeile

  • Bei aktiviertem „Show Signal“ markieren grüne Pfeile Kaufsignale (Kurs über oberes Band und Filter erfüllt).

  • Rote Pfeile markieren Verkaufssignale (Kurs unter unteres Band und Filter erfüllt).

EMA und VWAP (optional)

  • Der EMA bestätigt die Trendrichtung – nur Kauf, wenn Kurs über EMA, nur Verkauf, wenn darunter.

  • VWAP zeigt den volumen­gewichteten Durchschnittskurs – hilfreich, um institutionelle Aktivität zu erkennen.


Praktische Tipps

  • Mit Volumen kombinieren: Ausbrüche mit hohem Volumen sind zuverlässiger.

  • Mehrere Timeframes: Bestätigen Sie Ausbrüche in einem höheren Zeitrahmen, bevor Sie im niedrigeren handeln.

  • Fehlausbrüche: Überschlägt der Kurs kurz ein Band, kehrt aber zurück, kann das Rauschen sein. Warten Sie auf einen Schlusskerzen-Ausbruch.

  • Risikomanagement: Stop-Loss knapp innerhalb des Bandes platzieren, da ein Rückfall ins Band auf Fehlsignal hindeutet.


Hauptmerkmale

  • Dynamische Volatilitätsberechnung
    Passt sich automatisch an, wie stark sich der Kurs nach der definierten Session bewegt.

  • Opening-Range-Konzept
    Nutzt die volatilste Anfangsphase des Handelstages.

  • Anpassbare Filter
    EMA und VWAP für Trend- oder Mean-Reversion-Strategien.

  • Klare Darstellung
    Deutliche Bänder, schattierter Noise-Bereich, optionale Pfeile – auch für Nicht-Techniker leicht verständlich.

  • Flexible Zeitwahl
    Beliebige Session-Zeiten (z. B. London, New York, Asien) und Chart-Zeiträume.

  • Bänder begrenzen oder fortschreiben
    Wahl, ob Bänder nur während der Session oder darüber hinaus gelten.


Hinweis: Dies ist keine Finanzberatung! Der Indikator arbeitet in Echtzeit und repainted nicht.


Empfohlene Produkte
My PVSR
Ashok Kumar Singha
My PVSR   is based on All Type of Pivot Points. Use this Indicator to get proper Support / Resistance Zone and Trade accordingly.. Recommendation: Use this Indicator along with my another Indicator --->>> Dr. Trend   <<<--- Click Here ; To get the best output result feel free to contact me ; Best of Luck It can be used for: All Pairs: Forex, Cryptocurrencies, Metals, Stocks, Indices etc. All Timeframe All Brokers All type of Trading Style like Scalping, Swing, Intraday, Short-Term, Long-
ZigZag Indicator with Labels for MT5 The ZigZag Indicator with Labels is a valuable tool for traders using MetaTrader 5 (MT5) to identify market structure by pinpointing significant highs and lows. This indicator enhances technical analysis by distinguishing between major turning points, which define broader trends, and minor fluctuations, which indicate internal price movements. It is especially useful for Elliott Wave analysts , enabling them to track market dynamics effectively and recognize
Price DNA MT5
Ruben Octavio Gonzalez Aviles
Price DNA ist ein Trendindikator, der auf der Basis von Compound Ratio Weighted Moving Averages arbeitet, um Verzögerungen zu reduzieren und Trends frühzeitig zu erkennen. Der Indikator wird nicht neu gezeichnet und kann auf jedes Finanzinstrument und jeden Zeitrahmen angewendet werden. Wie funktioniert die Preis-DNA? Der Indikator zeigt mehrere Wellen auf dem Diagramm an, die die Richtung des aktuellen Handels anzeigen. Fünf grüne oder fünf rote Wellen weisen auf einen starken Aufwärts- bzw. A
Market session with fibonacci
Batsukh Sumchin Khuyagbaatar
Dieser Indikator ist der am häufigsten verwendete Indikator, den wir täglich verwenden. Er umfasst unsere am häufigsten verwendeten Strategien, ICT und SMC, Stop-Loss-Limits und Liquiditätslimits, die zu den Eröffnungs- und Schließzeiten der Börsen auftreten, sowie das Börsenvolumen mit Fibonacci und Vergrößern und Verkleinern und die häufigsten Aktionen, die Sie sehen möchten, wie das Auswählen der Börsenbewegung, die Sie sehen möchten, und das Ziehen von Fibonacci. Dies sind vollautomatische I
Limitless MT5
Dmitriy Kashevich
Limitless MT5 is a universal indicator suitable for every beginner and experienced trader. works on all currency pairs, cryptocurrencies, raw stocks Limitless MT5 - already configured and does not require additional configuration And now the main thing Why Limitless MT5? 1 complete lack of redrawing 2 two years of testing by the best specialists in trading 3 the accuracy of correct signals exceeds 80% 4 performed well in trading during news releases Trading rules 1 buy signal - the ap
E2C Lines
Eduardo Cristian De Carvalho
Descubra o poder do nosso indicador de alta precisão, projetado para identificar as regiões de alvo e exaustão de qualquer ativo. Testado e validado por mais de 3 anos nos mercados de mini dólar e mini índice, ele oferece confiabilidade e eficácia incomparáveis. Transforme sua estratégia de trading e alcance novos patamares de sucesso com nossa ferramenta inovadora.
Pendiente de Precio
Cesar Juan Flores Navarro
Indicador en base a la pendiente de la linea de precio, dibuja una línea de color cuando sube a base de los precios que previamente has sido procesados o linealizados, y cuando baja la pendiente la linea linealizada toma otro color. En este caso se a considerado 6 lineas de diferentes procesos desde pendientes largas hacia las cortas, observándose que cuando coincidan las pendientes se produce un máximo o mínimo, lo que a simple vista nos permitirá hacer una COMPRA O VENTA.
Three Candles Pattern
Edson Cavalca Junior
5 (1)
The patterns of 3 (three) Candles: Three White Soldiers; Three Black Crows; These are reversal patterns widely used by traders, as they have a high probability of showing the inversion of the current market movement. For example, if in a bullish trend there are three black crows, there is a high probability of reversing the current bullish movement. The Three White Soldiers have the following characteristics: There are 3 consecutive candles with a good body, that is, the difference between th
Manyal trading system, CovEchoTrend Robot, focuses on reliability and flexibility. By employing statistical analysis methods to study the relationships between the base indicator and market patterns, the system enables a deeper understanding of market processes. Intelligent pattern analysis: The application of statistical data processing helps identify key trend reversal points more accurately, signaling significant market shifts. Informed decision-making is based on the intersection of indicato
IndiceXperience
Mateus Silva Marques Dos Santos
Indicador para mercado de Índice Futuro Brasileiro (WIN) __________________________________________________________________________________________________ O indicador trabalha com rompimento de canal indicando o sentido do movimento e os 3 possíveis TP e o SL baseado no ATR. Indicação de utilização em TimeFrame de 5M, mas pode ser utilizado em qualquer tempo gráfico de sua preferencia. __________________________________________________________________________________________________
Cyberosaur V5
Maryna Shulzhenko
1 (1)
The     Cyberosaurus  bot is an innovative next-generation bot that serves as a powerful tool for trading in the classic Forex market and with cryptocurrencies (for corresponding brokers). It operates with the majority of pairs, so it is advisable to test it before using it on a specific pair. It is specifically designed to work with these markets, without the ability to trade other assets such as stocks or indices. The main control parameters of the bot are presented in a convenient and conci
Market Markers EA
Tshepo Michael Motaung
This EA is sessions trading robot that allows you to trade the trading session of yours choice as it waits for market markers to make decision for the direction of the day before taking any trades. It has 3 entry signals that uses candle stick patterns, Moving Averages and Range Break to maximize profits and to take advantage of the trending market. The EA practices risk management and has the ability to grow account by risking certain percentage of your account(risk percentage) each time there
God Gold HFT Scalper
Pratham Jatin Barot
Der HFT Gold Scalper EA ist ein fortschrittliches automatisiertes Handelssystem für den Hochfrequenzhandel im Goldmarkt (XAUUSD). Er nutzt einen präzisen Algorithmus für eine effiziente Ausführung von Trades mit Fokus auf kurzfristige Preisbewegungen. Hier ist mein Telegram -Account. Kontaktieren Sie mich, wenn Sie die optimalen Einstellungen für den Bot benötigen. Um den Validierungstest zu bestehen, ist der Bot mit einem sehr geringen Risiko-Gewinn-Verhältnis ausgestattet. Für bessere Gewinn
Wir stellen den revolutionären MT5-Indikator DARWIN Assistant   vor – Ihr ultimativer Zugang zur Welt des erfolgreichen Handels! DARWIN Assistant   wurde mit Präzision und Fachwissen entwickelt und verfolgt eine spezielle Strategie, die die Leistungsfähigkeit fortschrittlicher technischer Indikatoren – RSI, Stochastik, CCI und Trends – über alle Zeitrahmen hinweg nutzt. Machen Sie sich auf ein außergewöhnliches Handelserlebnis gefasst, denn dieser hochmoderne Indikator bietet Ihnen die genauest
The Trend Rendezvous indicator searches for and displays pivot points on the price chart. The goal, which was pursued during its creation, is to obtain signals that will produce less noise and respond more quickly to price changes. The Trend Rendezvous indicator is a trend indicator that is used to search for reversals in the breakdown of its borders. The indicator is its signal and has one interesting property. It is necessary to take into account that this indicator reflects extrema and shoul
MarketMagnet
Kelly Adediran Raymond
Are you ready to take your trading journey to new heights? Look no further than MarketMagnet, this groundbreaking indicator designed to propel your trading success with excitement and accuracy. Powered by the convergence of Momentum and CCI (Commodity Channel Index), MarketMagnet equips traders with the ultimate tool to determine direction and entry prices for a wide range of recommended currency pairs and instruments. It is designed for traders seeking to scalp for a few pips on lower timeframe
ROADMAP: Ihr ultimativer MT5 Forex-Indikator für eine perfekte Handelsausführung! Sind Sie es leid, ständig mit Unsicherheiten und Rätselraten im Forex-Markt konfrontiert zu sein? Finden Sie es herausfordernd, die idealen Einstiegspunkte, Kauf- und Verkaufszonen zu identifizieren oder genaue Stop-Loss- und Take-Profit-Levels festzulegen? Suchen Sie nicht weiter, denn ROADMAP, ein bahnbrechender MT5 Forex-Indikator, ist da, um Ihre Handelsstrategie zu revolutionieren. ROADMAP wurde mit einer spez
Make Sure to Read the Description! UT Bot Plus contains free EA! The EA can be downloaded from telegram channel:  https://t.me/ +NSOJTvH39fNhZmU0 Unlock the Power of Automated Trading with UT BOT Indicator, Integrated with a FREE EA! ( Limited time offer ) This version has been expanded to include multiple additional filtering options. These options are fully configurable and can be switched on and off. This versatile UT BOT indicator is crafted and optimized to work seamlessly with the FRE
Best swing
Winsou Cedric Anicet Kpanou
-- BEST SWING  -- L'indicateur BEST SWING est un indicateur technique personnalisé, un excellent outil pour négocier les cassures en fonction des niveaux de support et de résistance horizontaux. L'indicateur BEST SWING utilise une formule complexe en analysant des données de prix autrement incongrues sur les cours de clôture de chaque période, ainsi que les hauts et les bas du prix, afin de donner un aperçu de la force ou de la faiblesse de la tendance du marché et de sa probabilité
Panel Visao axetrend
Danilo Maia Siqueira
Trendansichtsfeld; AutoSignals-Trend Der Indikator verfolgt den Trend in 5 verschiedenen Chartzeiten für dasselbe Asset, basierend auf 6 Signalen für jede Chartzeit. Das Hauptziel des Indikators besteht darin, uns den Mehrheitstrend des finanziellen Vermögenswerts zu zeigen, in den er platziert wurde. Das System überträgt die Informationen über die Trends in verschiedenen Grafikzeiten. Auf diese Weise hat der Benutzer einen umfassenden Überblick über die Bewegung des Assets. Durch diese Art
O Alexxander Autotrader é seu robô especialista em trade em minidólar WDO na bolsa brasileira B3. Com estratégia única, o robô já está configurado para operar minidólar na abertura do pregão, operando em fechamentos de gaps principalmente. O robô também pode ser otimizado para operar além do horário de abertura. Alem disso, o robô pode ser configurado com trailling stop, horários de trades e tipo de stop, se fixo ou dinâmico. OBS: alterar o parâmetro BR1 para BR.
Rule Plotter Expert
Francisco Gomes Da Silva
5 (3)
Dieser Expert Advisor wurde entwickelt, um Ihre in dem Indikator Rule Plotter erstellten Strategien zu testen und auszuführen. Verwendung: Laden Sie den Indikator Rule Plotter - Werkzeug zur Erstellung von Handelssystemen ohne Programmierkenntnisse kostenlos herunter. Entwickeln Sie dann Ihre Strategien mit dem Rule Plotter-Indikator. Führen Sie schließlich Ihre erstellten Strategien mit diesem Expert Advisor aus. Parameter: Strategie: Ihr im Rule Plotter-Indikator erstelltes Handelssystem. Lot:
VR Pivot MT5
Vladimir Pastushak
VR Pivot ist ein Indikator für wichtige Drehpunkte (pivot). Umkehrpunkte sind eine spezielle Art von Unterstützung (support) und Widerstandsstufen (resistance), die verwendet werden, um die stärksten Preiszonen zu identifizieren. Professionelle Händler verwenden Umkehrpunkte, um die Preise zu bestimmen, zu denen eine hohe Wahrscheinlichkeit einer Preisumkehr besteht. Die Niveaus werden nach speziellen mathematischen Formeln berechnet, die Preise des Schließens, Öffnens, Maximums, Minimums des vo
M5 Breakout Indicator
Terence Gronowski
3 (1)
Shows min and max of last M5 Candle. Can be used to trade breakouts of last M5 candle.  The M5 Candle Breakout Strategy avoids to stay too long in a sindways phase. See documentation on  @swisstrader3713, where you can follow my live trading. The only parameters are the color of the lines defining the M5 stretch. Best use the indicator in M1 timeframe. The M5 Breakout Strategy has helped me to reduce overtrading.
FREE
Bei diesem Indikator handelt es sich um einen Indikator für die automatische Wellenanalyse, der sich perfekt für den praktischen Handel eignet! Fall... Hinweis:   Ich bin es nicht gewohnt, westliche Namen für die Welleneinstufung zu verwenden. Aufgrund des Einflusses der Namenskonvention von Tang Lun (Tang Zhong Shuo Zen) habe ich die Grundwelle als   Stift   und das sekundäre Wellenband als   Segment   bezeichnet Gleichzeitig hat das Segment die   Trendrichtung   benannt (diese Benennungsmeth
Very easy to follow buy and sell indicator for Gold, Crypto and Forex. Just follow the signal with risk management. Good for both novice as well as expert traders. Once you get to use to using with this then you know how to use to for consistent winning. Make sure to combine proper risk management with proper position sizing. Green for buy and red for sell on the chart.
Multicurrency and multitimeframe indicator of the Standard Deviation Channel. Displays the current direction of the market. On the panel, you can see breakouts and touches (by price) of the levels of the linear regression channel. In the parameters, you can specify any desired currencies and timeframes. Also, the indicator can send notifications when levels are touched. By clicking on a cell, this symbol and period will be opened. This is MTF Scanner. The key to hide the dashboard from the char
Goldbot One MT5
Profalgo Limited
4.7 (10)
Einführungsaktion: Nur noch wenige Exemplare zum aktuellen Preis verfügbar! Endpreis: 990 $ NEU: Kaufen Sie Goldbot One und wählen Sie 1 EA gratis!! (für 2 Handelskonten) ÖFFENTLICHER GRUPPE BEITRETEN:   Klicken Sie hier   Ultimativer Kombi-Deal     ->     hier klicken LIVE SIGNAL Wir stellen Goldbot One   vor   , einen hochentwickelten Handelsroboter, der für den Goldmarkt entwickelt wurde.   Mit seinem Fokus auf Breakout-Trading nutzt Goldbot One sowohl Unterstützungs- als auch Widerstandsn
This tool identifies  opportunitie levels by tracking where significant orders are being filled in the market  and monitors key price levels where institutional orders cluster, providing you with valuable insights into market structure and potential reversal points. Key Features: Smart Level Detection • Automatically identifies significant price levels where orders are being filled • Tracks both touch and rejection points to validate level strength • Merg Fully Customizable • Adjustable a
Fast API Copier
Konstantin Stratigenas
This EA connects trading systems on a Windows Server (VPS), providing top-tier trade copying locally or remotely and powerful API integration. Experience lightning-fast performance with a 10ms reaction time for seamless, reliable trading. For seamless operation, use the EA on a hosted server (VPS or cloud). It also works on your own server or computer. Copy Trades: Effortlessly copy trades between terminals, local or remote. Just select the same channel for both terminals and set the Direction t
Käufer dieses Produkts erwarben auch
Spot the Trend. Read the Pattern. Time the Entry. 3 Steps in Under 30 Seconds! Trade effortlessly — no analysis required, Your smart assistant is ready to simplify your workflow No more chart overload. Trade with confidence using smart bias detection. Compatible with all currencies, crypto, stocks, metals, indices, and any timeframe. Just click and execute — it’s that simple. deal for busy traders who want speed and clarity. TPTSyncX is a powerful all-in-one MetaTrader 5 indicator that seamles
FxaccurateLS
Shiv Raj Kumawat
WHY IS OUR FXACCCURATE LS MT5 THE PROFITABLE ? PROTECT YOUR CAPITAL WITH RISK MANAGEMENT Gives entry, stop and target levels from time to time. It finds Trading opportunities by analyzing what the price is doing during established trends. POWERFUL INDICATOR FOR A RELIABLE STRATEGIES We have made these indicators with a lot of years of hard work. It is made at a very advanced level. Established trends provide dozens of trading opportunities, but most trend indicators completely ignore them! The
CBT Quantum Maverick Hocheffizientes Binäroptionshandelssystem CBT Quantum Maverick ist ein leistungsstarkes Handelssystem für Binäroptionen, das für Händler entwickelt wurde, die Präzision, Einfachheit und diszipliniertes Handeln suchen. Keine Anpassung erforderlich – das System ist von Anfang an optimiert. Mit etwas Übung sind die Signale leicht zu beherrschen. Hauptmerkmale: Präzise Signale: Handelssignale basierend auf der aktuellen Kerze, die auf die nächste Kerze abzielen, ohne häufige N
IVISTscalp5
Vadym Zhukovskyi
5 (6)
Wir stellen Ihnen den iVISTscalp5-Indikator vor, der nicht nur einzigartig, sondern auch effektiv im Handel ist. Dieser Indikator basiert auf Zeitdaten und ist das Ergebnis jahrelanger Erfahrung und eingehender Analyse der Finanzmärkte. Der iVISTscalp5-Indikator ist ein ausgezeichnetes Werkzeug für manuellen Handel. Bequemlichkeit, Einfachheit und Visualisierung - die gesamte Komplexität ist verborgen. Wir haben die Einstellungen und Verwendung des iVISTscalp5-Indikators auf das Maximum vereinfa
The   Time_Price_SQ9_Degree   indicator is based on the 9 Gann square. Using this indicator, you can identify strong time and price zones. The indicator displays the levels as a degree value. The degrees can be set in the settings. After launching, the MENU button appears. If it is highlighted, it can be moved to any point on the graph, and after double-clicking on it, it stops being highlighted and menu buttons appear. To hide the menu, just double-click on the button, it will become highlight
The Naveen Dynamic Square  MT5  is one of the best known  technical analysis tools  inspired  by WD Gann along with the Gann Fan and Gann Box. It is considered a cornerstone of his trading technique that is based on time and price symmetry. The Naveen Dynamic Square MT5   is a powerful tool in finance for determining support and resistance levels based on a stock's extreme price points. It works by extrapolating probable price levels from a central value, typically an all-time or cyclical high o
Super Zone indicator
Dmitriy Sotnikov
5 (1)
Super Zone   For several years of observing the principles of the market, Super Zone worked, both then and now, because the indicator  allows you to see the trading range of the  week and even the month that major market participants use. It’s very easy to use, we work on H4 in the weekly range (  in the tester it doesn’t work in the demo mode  ) - we sell from the upper zones, we buy from the lower ones. It marks the zones from the beginning of the week (month) that are  not redrawn  , works on
This indicator is based on the mathematics of the great trader W.D. Ganna. With its help, you can easily find strong levels by analyzing swings to find the optimal entry point. The indicator works on all instruments and all timeframes. The indicator is fully manual and has control buttons. All you need to do is press the NEW button, a segment will appear, which you can place on any movement, swing or even 1 candle that you want to analyze. By placing the segment, press the OK button. A grid (th
This indicator identifies and displays zones, as it were areas of strength, where the price will unfold. The indicator can work on any chart, any instrument, at any timeframe. The indicator has two modes. The indicator is equipped with a control panel with buttons for convenience and split into two modes. Manual mode: To work with manual mode, you need to press the NEW button, a segment will appear. This segment is stretched over the movement and the LVL button is pressed. The level is displayed
TMA Channel is a price channel obtained through a special calculation method based on traditional TMA . The channel has upper, middle, and lower tracks . When the price approaches or exceeds the upper track, it is already in an overbought state, and attention should be paid to the situation of reversal and decline; When the price approaches or falls below the lower track, it is already in an oversold state, and attention should be paid to the situation of reversal and rise . The indicator will
Seconds Charts
Aleksandr Goryachev
Micro  ******************* Секундные графики MT5 ********************** Более точного инструмента для входа в сделку вы не найдёте. Входные параметры: Timeframe, sek - период построения графика, секунды Displayed bars - отображаемые бары Step of price levels, pp, 0-off - шаг отрисовки ценовых уровней, пункты Scale points per bar, 0-off - масштаб в пунктах на бар Show lines - отображение текущих уровней Show comment - отображение комментария Standard color scheme - стандартная цветовая сх
How to use Pair Trading Station Pair Trading Station is recommended for H1 time frame and you can use it for any currency pairs. To generate buy and sell signal, follow few steps below to apply Pair Trading Station to your MetaTrader terminal. When you load Pair Trading Station on your chart, Pair Trading station will assess available historical data in your MetaTrader platforms for each currency pair. On your chart, the amount of historical data available will be displayed for each currency pai
Natürlich, hier ist die Übersetzung in Deutsch: Vorstellung des Astronomie-Indikators für   MT4 / MT5 : Dein ultimativer himmlischer Trading-Begleiter Bist du bereit, deine Trading-Erfahrung auf himmlische Höhen zu heben? Suche nicht weiter als unseren revolutionären Astronomie-Indikator für MT4. Dieses innovative Tool übertrifft herkömmliche Trading-Indikatoren und nutzt komplexe Algorithmen, um dir unvergleichliche astronomische Einblicke und präzise Berechnungen zu bieten. Ein Universum an In
TrendMaestro5
Stefano Frisetti
note: this indicator is for METATRADER4, if you want the version for METATRADER5 this is the link:  https://www.mql5.com/it/market/product/108106 TRENDMAESTRO ver 2.4 TRENDMAESTRO recognizes a new TREND in the bud, he never makes mistakes. The certainty of identifying a new TREND is priceless. DESCRIPTION TRENDMAESTRO identifies a new TREND in the bud, this indicator examines the volatility, volumes and momentum to identify the moment in which there is an explosion of one or more of these data a
Hello I Want to introduce The Forex Buy Sell Arrow Premium MT5 i recently release this premium indicator! its 1000% Non Repaint Indicator, It Work Perfectly Well,, i tested it day by day, Just mind blowing Result,  Including Powerful trend Algorithm! How It Work? well, it work market trend formula, when trend Bullish Or when trend Bearish,  Recommend Timeframe M30, H1 it work all timeframe, and all currency pair, 100% non repaint, How to take signal From Forex Buy Sell Arrow Premium Ind
AriBot
Arman Belassarov
AriMax   – AI-Powered Trading Robot AriMax is a cutting-edge AI-powered trading robot designed to help traders maximize profits while minimizing risk. Utilizing advanced machine learning algorithms and real-time market analysis, AriMax identifies high-probability trade opportunities with precision and speed. Key Features:     AI-Driven Market Analysis   – Analyzes market trends and patterns to make data-driven trading decisions.     Automated Execution   – Places trades seamlessly with optimiz
Reversal ALGO
Muhammad Abdullah Bhatti
Reversal Algo – Technischer Indikator zur Marktumkehranalyse Reversal Algo ist ein fortschrittlicher technischer Indikator, der speziell entwickelt wurde, um potenzielle Wendepunkte in Markttrends zu identifizieren. Durch die detaillierte Analyse historischer Preisdaten erkennt er bedeutende Hochs und Tiefs, die auf eine bevorstehende Trendänderung hinweisen können. Dieser Indikator bietet klare visuelle Signale auf dem Chart, sodass Händler Schlüsselbereiche für mögliche Umkehrungen präzise bes
Big Player Range
Thalles Nascimento De Carvalho
5 (3)
Die Macht von "BigPlayerRange" entdecken: Ihr starker Verbündeter in der technischen Marktanalyse BigPlayerRange ist ein fortschrittliches technisches Analysetool, das dazu entwickelt wurde, institutionelle Interessensbereiche im Markt aufzudecken. Mit diesem leistungsstarken Werkzeug können Sie präzise feststellen, wo große Marktteilnehmer aktiv sind, und Ihre Handelsstrategien entsprechend verbessern. Hauptmerkmale: Kartierung institutioneller Interessensbereiche : BigPlayerRange hebt Z
The   Gann Scalping Gold Indicator   is a robust technical analysis tool designed for precision trading in gold markets. It leverages Gann-based methodologies to identify key price levels, enabling traders to anticipate potential market reversals, breakouts, and areas of consolidation. Daily Reset Logic: Automatically resets touch statuses at the start of a new trading day, ensuring that the indicator aligns with fresh daily trends. How It Works: The indicator draws horizontal lines at predefine
Happy entries
Godwill Fortune Otieno Juma
The  product gives optimized entries for 3min ,1 hr and day timeframes  Does well with indices  ASIAN- HK50 AND CHINA A50 USA-US30,US100,US500 GER40 ,UK100 For stocks trade with the day timeframes Happy Entry employs advanced algorithms and real-time data analysis to identify optimal entry points with unprecedented accuracy. Its adaptive nature allows it to seamlessly adjust to changing market conditions, ensuring you never miss out on profitable opportunities. Whether you're a beginner or seas
VTrende Pro
Andrii Diachenko
5 (1)
VTrende Pro - MTF indicator for trend trading with a display panel for MT5 *** Videos can be translated into any language using subtitles (video language - Russian) Although the signals of the VTrende Pro indicator can be used as signals of a full-fledged trading system, it is recommended to use them in conjunction with the Bill Williams TS. VTrende Pro is an extended version of the VTrende indicator. Difference between Pro version and VTrende: - Time zones - Signal V - signal 1-2 waves -    S
WanaScalper
Isaac Wanasolo
1 (1)
A scalping indicator based on mathematical patterns, which on average gives signals with relatively small SL, and also occasionally helps to catch big moves in the markets (more information in the video) This indicator has three main types of notifications: The first type warns of a possible/upcoming signal on the next bar The second type indicates the presence of a ready signal to enter the market/open a position The third type is for SL and TP levels - you will be notified every time price re
XCalper TFO
Aecio de Feo Flora Neto
This oscillator was developed exclusively by xCalper in 2015 based on moving averages calculations to indicate and try predicting oversold and overbought levels. The fast line (white, by default) oscillates basically between values -0.5 (oversold) and +0.5 (overbought). Whenever this line crosses upward value -0.5, it means an oversold price level. When it crosses downward value +0.5, it means an overbought price level. When fast line crosses value 0.0 and returns, it is a strong pull-back indic
Smooth price for Monarch
Konstantin Gruzdev
5 (1)
The Smooth Price technical indicator is used for plotting a smoothed line as close to the price of the financial instrument as possible, and serves to eliminate its noise components. The indicator is part of the Monarch trading system, but here it is presented as an independent technical analysis tool. The indicator is based on the cluster digital filter , which, unlike the ClusterSMA , is applied directly to the price time series. Smooth Price does not redraw (except the very last, zero bar) an
The Expert Advisor and the video are attached in the Discussion tab . The robot applies only one order and strictly follows the signals to evaluate the indicator efficiency. Pan PrizMA CD Phase is an option based on the Pan PrizMA indicator. Details (in Russian). Averaging by a quadric-quartic polynomial increases the smoothness of lines, adds momentum and rhythm. Extrapolation by the sinusoid function near a constant allows adjusting the delay or lead of signals. The value of the phase - wave s
Классификатор силы тренда. Показания на истории не меняет. Изменяется классификация только незакрытого бара. По идее подобен полной системе ASCTrend, сигнальный модуль которой, точнее его аппроксимация в несколько "урезанном" виде, есть в свободном доступе, а также в терминале как сигнальный индикатор SilverTrend . Точной копией системы ASCTrend не является. Работает на всех инструментах и всех временных диапазонах. Индикатор использует несколько некоррелируемых между собой алгоритмов для класси
Currency Index Watcher is a simple and user-friendly tool for whoever wish to trade Forex using currencies indexes. Currency Index Watcher is configurable and usable directly from the panel. Indexes of 8 custom currencies EUR, USD, GBP, JPY, CHF, AUD, CAD, NZD (default) Any 3-chars symbol from your market watch could be used (BTC = bitcoin, RUB = ruble, CNH = yuan etc ...) : double click the symbol label  Ability to select which currencies and made-of pairs will be analyzed : check/uncheck wante
Forex Relative Performance indicator This indicator calculates the relative strength of major currencies against the US dollar. The basic idea behind this indicator is "to buy strong currency and to sell weak currency". This indicator allows you to quickly identify the best forex pair to trade according to your trading style (Intraday, Scalping, Swing, or Long Term)
The latest most requested Binary Options arrow indicator in the Garuda Signals product line is now on MT5! Binary options signal based on multiple time frame cross over analysis. Gets confirmation from the most consistent signals known to man; Ichimoku, SMA, Bollinger Bands; and also uses the 1 Hour time frame as trend confirmation , so you don't have to open up multiple chart and waste time. - Can be used for all time frames up to 1 hour, but is most POWERFUL for 1 and 5 min options. - Place yo
Premium-Level ist ein einzigartiger Indikator mit mehr als 80% Genauigkeit der richtigen Vorhersagen! Dieser Indikator wurde von den besten Trading-Spezialisten seit mehr als zwei Monaten getestet! Den Indikator des Autors finden Sie nirgendwo anders! Anhand der Screenshots können Sie sich von der Genauigkeit dieses Tools überzeugen! 1 ist ideal für den Handel mit binären Optionen mit einer Ablaufzeit von 1 Kerze. 2 funktioniert bei allen Währungspaaren, Aktien, Rohstoffen, Kryptowährungen
Weitere Produkte dieses Autors
Gerne stellen wir dir den Heikin Ashi RSI Oszillator vor! Dieser Indikator kombiniert die Konzepte von Heikin Ashi Kerzen mit dem RSI (Relative Strength Index), um ein oszillatorähnliches Format zu erzeugen, das dazu verwendet werden kann, einen Teil des Rauschens (Noise) herauszufiltern, das mit den standardmässigen RSI-Werten verbunden ist. Dies bietet den Tradern eine glattere Darstellung der Marktbedingungen. Hier sind einige Artikel, um mehr über den RSI und Heikin Ashi Kerzen zu erfahren:
Der Bayesian Trend Indikator färbt jede Kerze entsprechend einer Bayes’schen Trend-Inference ein. Er berechnet zunächst die “Prior”-Trendstärke aus vier Standard-Gleitenden Durchschnitten (EMA, SMA, DEMA, VWMA) Ihrer gewählten Länge, dann die “Likelihood” aus schnelleren Versionen derselben MAs (verkürzt durch einen “Gap”). Aus beiden Werten wird die Posterior-Wahrscheinlichkeit eines Aufwärtstrends gebildet. Die Kerzen werden wie folgt eingefärbt: Grün , wenn die Posterior-Wahrscheinlichkeit ei
Der Candle Smoother ist ein Indikator für den MetaTrader 5, der Ihnen hilft, die Kursbewegungen ruhiger und klarer zu sehen. Er entfernt unnötiges "Marktrauschen" und zeigt den echten Trend besser an. Was macht der "Candle Smoother Indikator"? Er glättet die klassischen Candlestick-Daten (Open, High, Low, Close). Dadurch werden chaotische, hektische Kerzen gefiltert . Zusätzlich wird eine EMA-Linie (exponentieller gleitender Durchschnitt) berechnet, basierend auf den geglätteten Kursen. So erke
Der Market Pulse ist ein vielseitiger MT5‑Indikator, der mehrere Marktmetriken kombiniert, um Trendrichtung, Momentum, Volumenflüsse und wichtige Preisniveaus in einem Tool anzuzeigen. Ziel ist es, Tradern klare Signale und visuelle Hilfen zu bieten, um Ein‑ und Ausstiegspunkte zu erkennen. Überblick über den Indikator Dynamische Profit-Wave‑EMAs (schnell, mittel, langsam) Kauf- und Verkaufspfeile Farbige Kerzen (bullish/bearish) Unterstützungs‑ und Widerstandslinien Optionalen Preis­kanal Mone
Auswahl:
Keine Bewertungen
Antwort auf eine Rezension