Realized Volatility Indicator
- Indikatoren
- Sadath Diessongo
- Version: 1.0
Realized Volatility Indicator
Description
The Realized Volatility Indicator measures the actual volatility observed in the market over a specified period.
Unlike implied volatility (which is based on options pricing), realized volatility is based directly on historical price movements, offering a pure and objective view of market turbulence.
This indicator can be used to:
-
Assess market conditions,
-
Optimize risk management,
-
Fine-tune trading strategies based on volatility behavior.
Key Features
📊 Calculates Realized Volatility based on historical price data.
🔄 Fully customizable period settings to match your analysis style.
🎯 Works on any symbol (Forex, Stocks, Crypto, Commodities).
🕒 Compatible with all timeframes from M1 to MN.
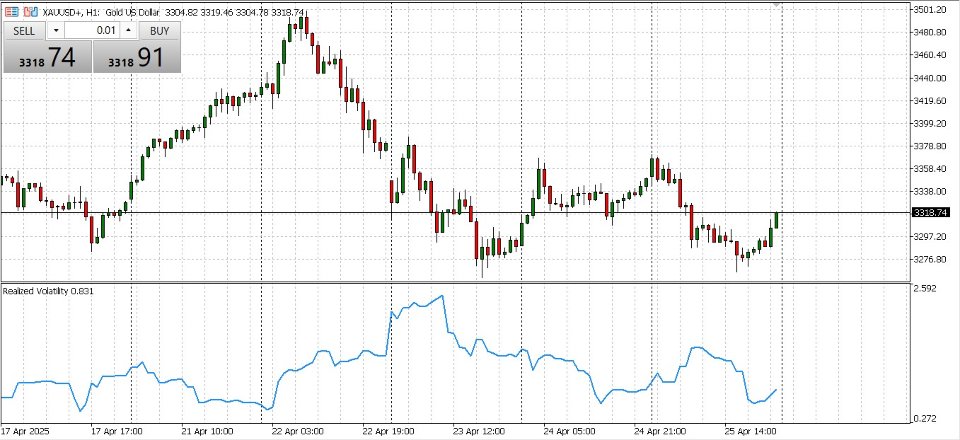
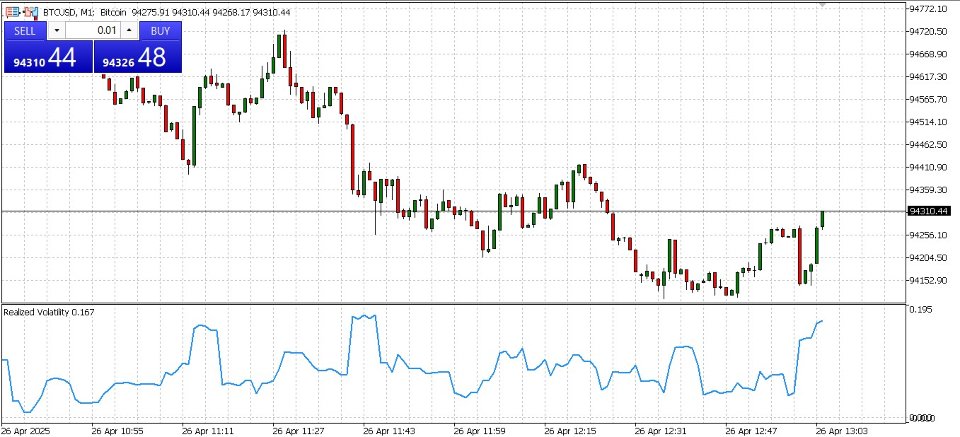
🧠 Clear visual plotting directly on the chart for easy interpretation.
Inputs
-
Period: Number of bars over which volatility is calculated.
-
Price Type: Choose between Close price, Low price, Open price, High price, and Median price.
Additional Notes
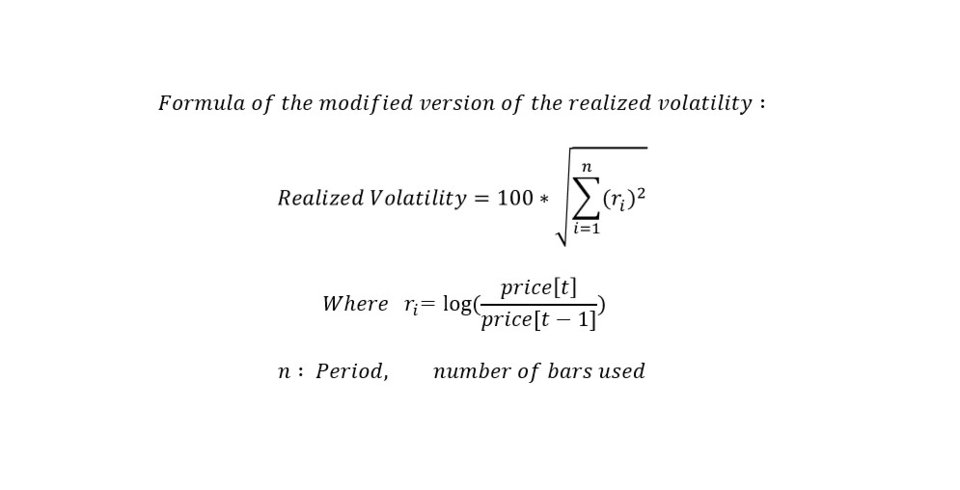
Since we are working on intraday timeframes, the formula for realized volatility has been adapted accordingly.
The exact formula can be found in the Screenshots section.
Custom Versions
For a minimum of $100, you can get a customized version of this indicator — just contact me!
Any feedback is welcome.


