RSI Heatmap Indicator MT5
- Indikatoren
- Eda Kaya
- Version: 1.3
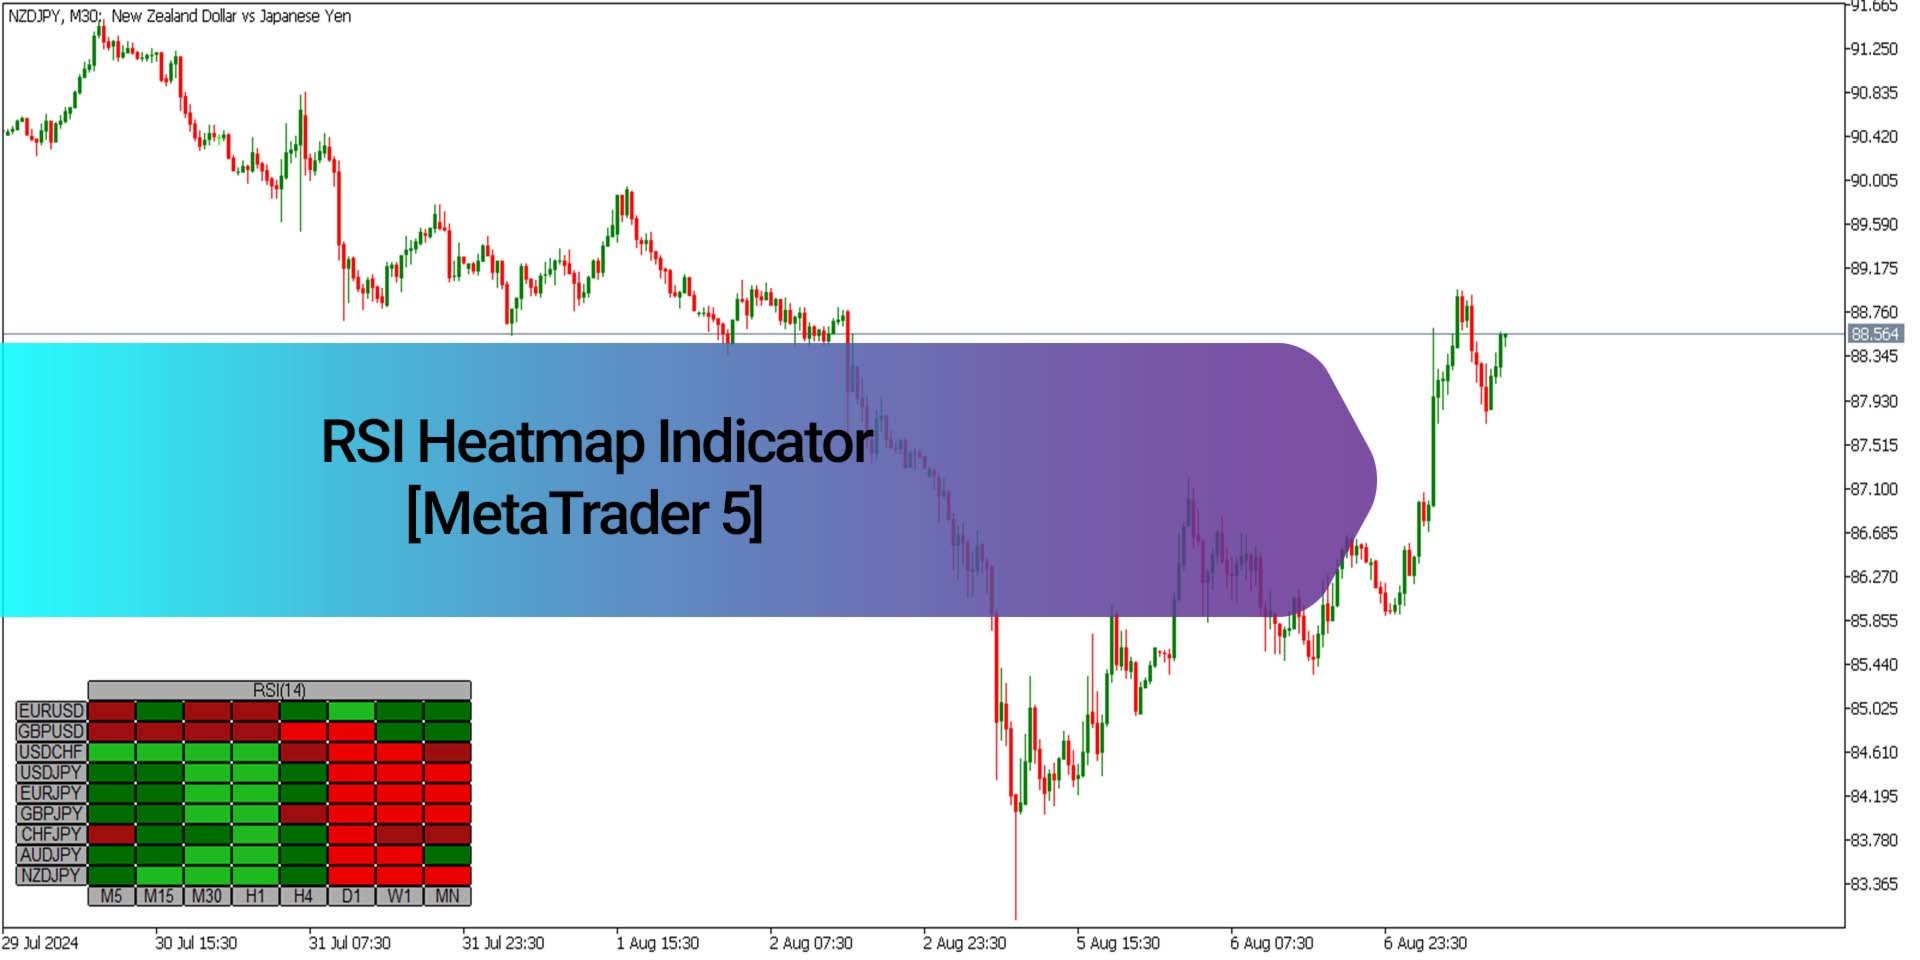
RSI Heatmap Indicator for MetaTrader5
The RSI Heatmap Indicator for MetaTrader5 is a powerful visual tool designed to measure the momentum of multiple currency pairs based on the Relative Strength Index (RSI). It detects and highlights overbought and oversold conditions across several timeframes and displays them in a heatmap located at the bottom left section of the chart. This visual representation helps traders quickly assess the overall market sentiment. Green tones signal potential buying (bullish) opportunities, while red tones suggest selling (bearish) pressure.
«Indicator Installation & User Guide»
MT5 Indicator Installation | RSI Heatmap Indicator MT4 | ALL Products By TradingFinderLab | Best MT5 Indicator: Refined Order Block Indicator for MT5 | Best MT5 Utility: Trade Assistant Expert TF MT5 | TP & SL Tool: Risk Reward Ratio Calculator RRR MT5 | Money Management: Easy Trade Manager MT5
Indicator Table
| Indicator Category | Market Signals – Trade Confirmation |
| Platforms | MetaTrader 5 |
| Trading Skills | Beginner Level |
| Indicator Types | RSI-Based – Overbought/Oversold |
| Timeframes | M5, M15, M30, H1, H4, Daily |
| Trading Style | Scalping – Intraday – Swing |
| Instruments | Forex Markets |
Overview
The RSI Heatmap Indicator provides an accurate picture of market direction and momentum across different time intervals. By analyzing RSI values on multiple timeframes, it pinpoints likely trend reversals or continuations. Green shades reflect mild to strong upward momentum, while red shades indicate varying degrees of downward pressure. It enhances confidence in trade entries aligned with broader market behavior.
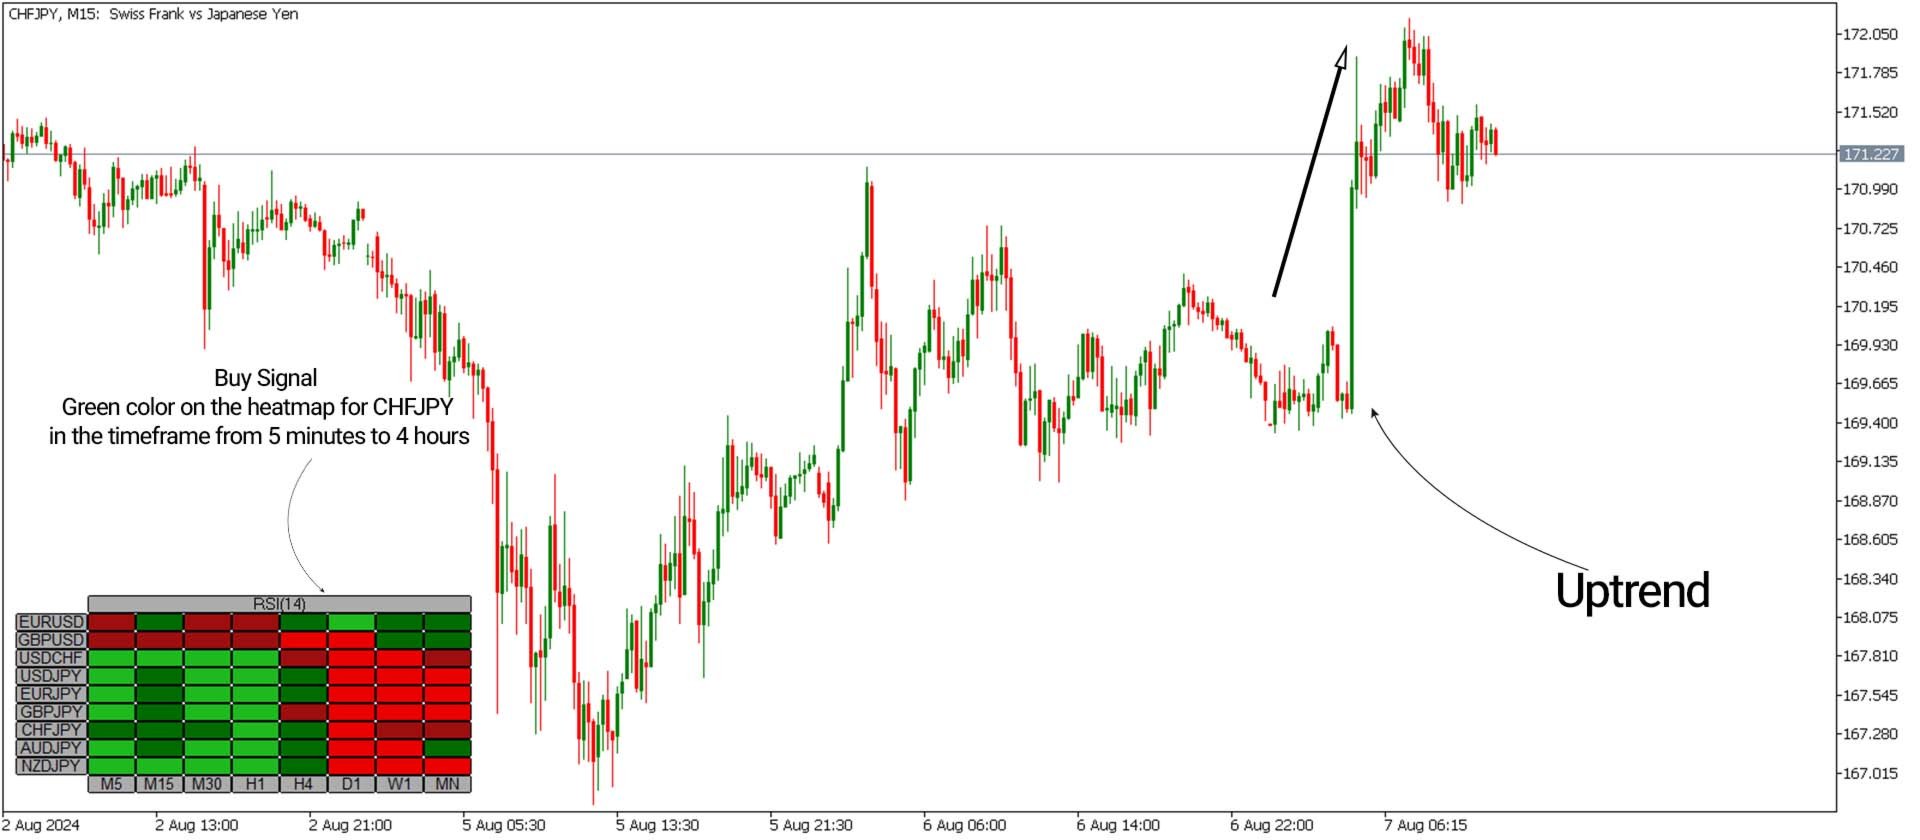
Bullish Signal Setup
In the CHF/JPY 15-minute chart shown below, the heatmap reflects green signals from M5 to H4, indicating RSI is in an oversold region and projecting a bullish movement across short to medium-term charts. Such alignment allows traders to seek long (buy) setups with higher probability.
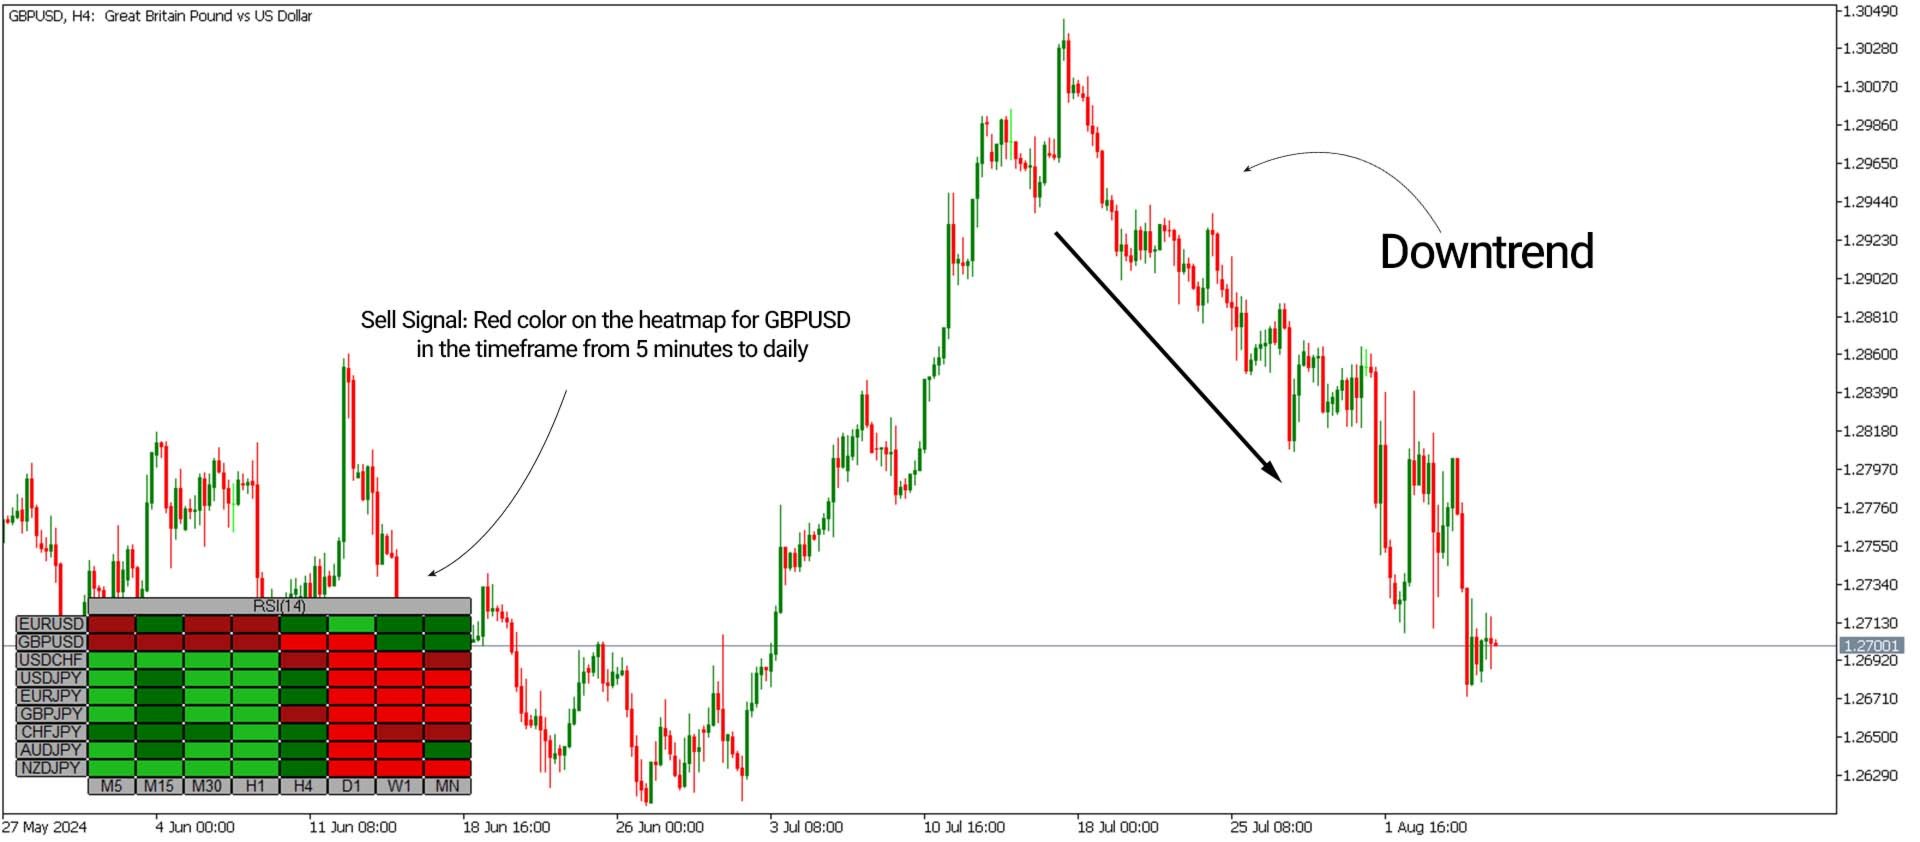
Bearish Signal Setup
The following image displays the GBP/USD chart on the H4 timeframe. Here, the heatmap illustrates consistent red signals from M5 up to the daily chart, signifying that RSI readings are in the overbought zone, and a downtrend is likely unfolding. This setup supports short (sell) trade opportunities in those intervals.
RSI Heatmap Indicator Settings
- Currency Pairs to Track: EURUSD, GBPUSD, USDCHF, USDJPY, EURJPY, GBPJPY, CHFJPY, AUDJPY, NZDJPY
- Timeframes Used: M5, M15, M30, H1, H4, D1, W1, MN
- RSI Period: 14
- Price Basis: Closing Price
- Strong Bullish Threshold: RSI > 60
- Mild Bullish Threshold: RSI > 50
- Mild Bearish Threshold: RSI < 50
- Strong Bearish Threshold: RSI < 40
- Candle for Calculation: Penultimate bar
- Color Codes:
- Strong Bullish: Light Green
- Mild Bullish: Green
- Neutral: Gray
- Mild Bearish: Dark Red
- Strong Bearish: Red
- Interface Design:
- Button Text: Black
- Button Borders: Black
- Background: Gray
- Display Corner: Top Right
- Indicator ID: RSI Heatmap 1
Summary
Trend analysis is vital for successful trading, and the RSI Heatmap Indicator for MetaTrader5 helps validate trend strength across various market phases. It empowers traders to better align with market momentum by providing a multi-timeframe view of currency strength based on RSI, ultimately enhancing trade precision and confidence.