One Two Three 123 Pattern Indicator MT4
- Indikatoren
- Eda Kaya
- Version: 1.3
1-2-3 Pattern Indicator for MetaTrader 4
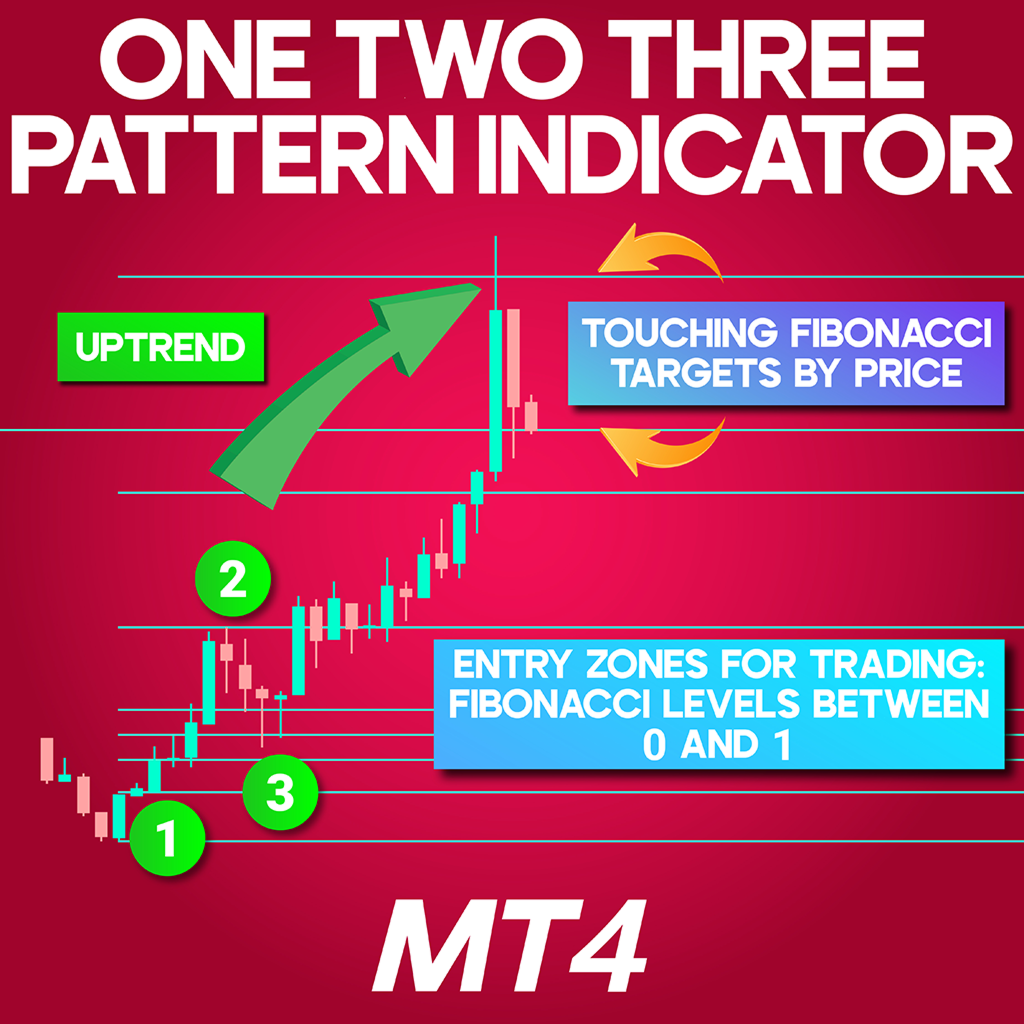
The 1-2-3 Pattern Indicator for MetaTrader 4 is a sophisticated technical tool designed to identify potential market reversals. It highlights three significant turning points, connecting them with a ZigZag pattern to visually map the price trajectory. Once the formation is complete, the indicator automatically generates Fibonacci retracement levels between the first two points to assist with trade planning.
«Indicator Installation & User Guide»
MT4 Indicator Installation | One Two Three 123 Pattern Indicator MT5 | ALL Products By TradingFinderLab | Best MT4 Indicator: Refined Order Block Indicator for MT4 | Best MT4 Utility: Trade Assistant Expert TF MT4 | TP & SL Tool: Risk Reward Ratio Calculator RRR MT4 | Money Management: Easy Trade Manager MT4
1-2-3 Pattern Indicator Specifications Table
The following table outlines the main features of the 1-2-3 Pattern Indicator for MetaTrader 4:
| Category | Trading Utilities – Price Zones – Capital Protection |
| Platform | MetaTrader 4 |
| Skill Level | Intermediate |
| Indicator Type | Trend Reversal – Range Detection – Continuation |
| Timeframe | Multiple Timeframes |
| Trading Style | Intraday Strategy |
| Trading Market | Forex – Cryptos – Equities |
Indicator Overview
This indicator assists traders in pinpointing market direction and determining optimal entry and exit zones. After the 1-2-3 pattern is completed during a corrective phase, Fibonacci levels are plotted. These levels serve as guideposts for entering trades, setting profit targets, and placing stop-loss orders—typically positioned near the initial Fibonacci (0) line.
Indicator Behavior in Bullish Trends
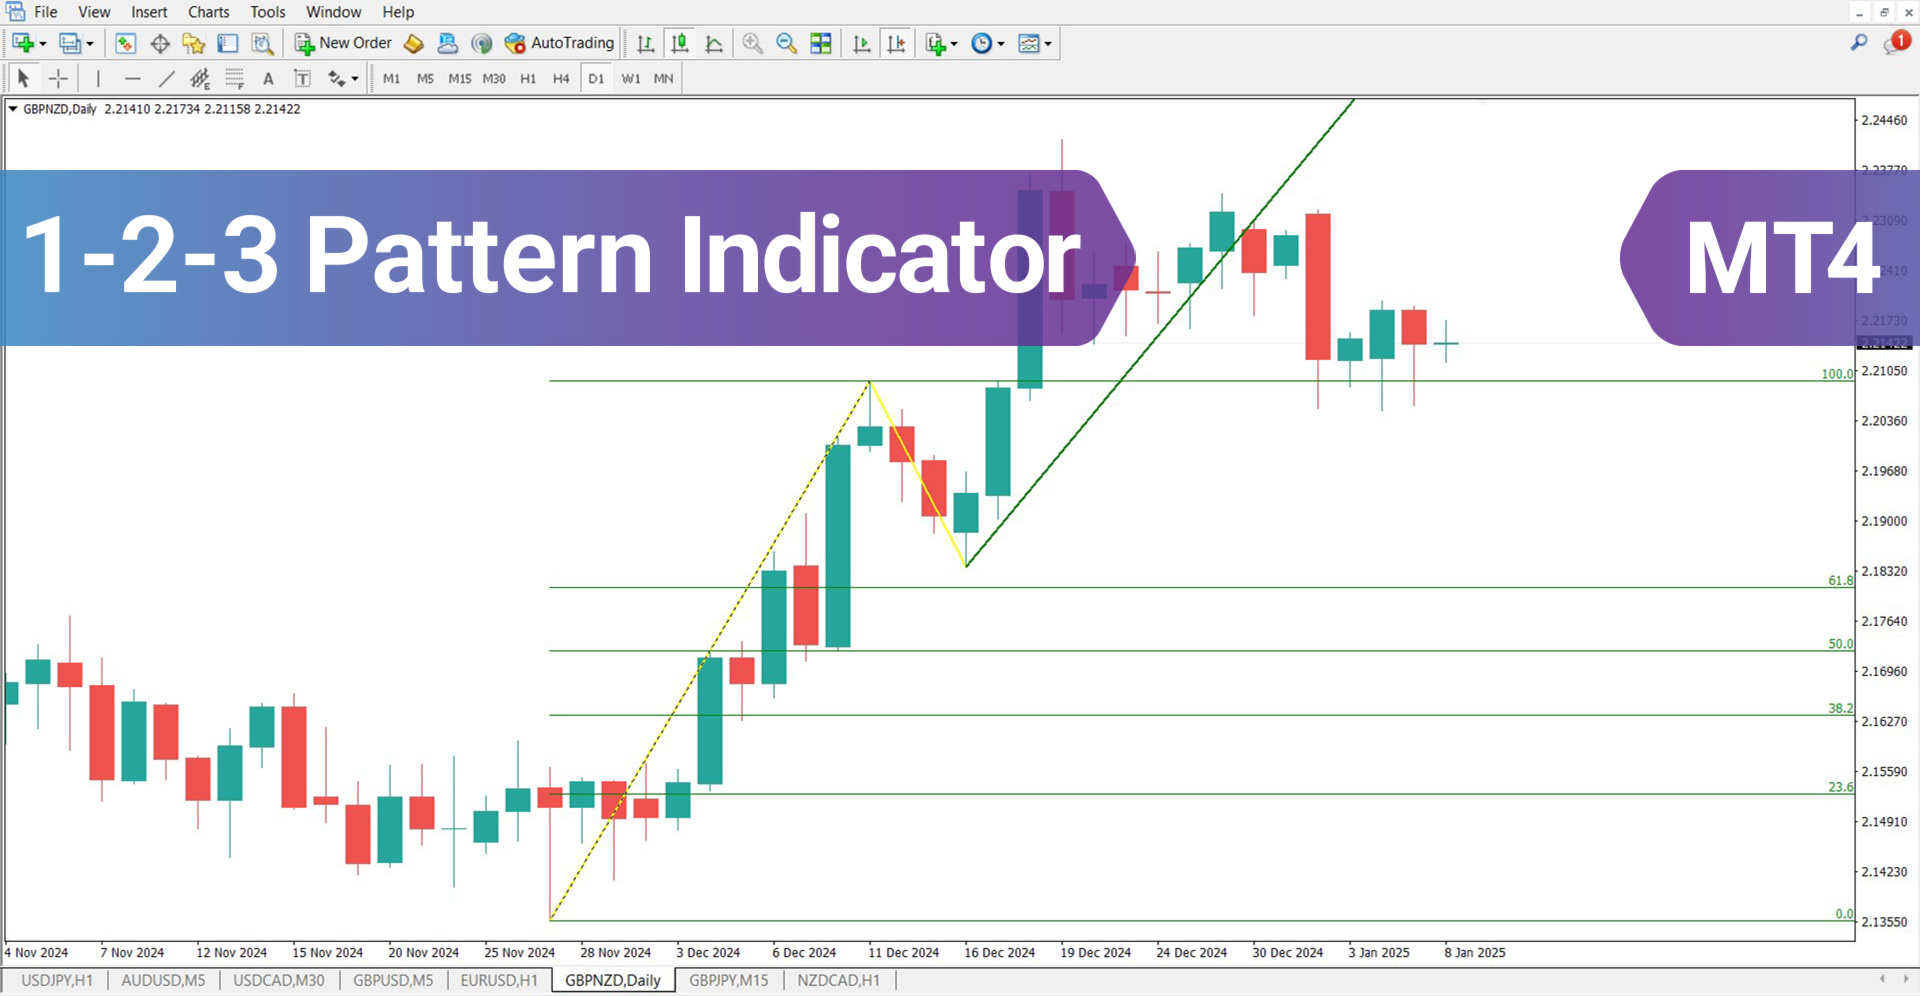
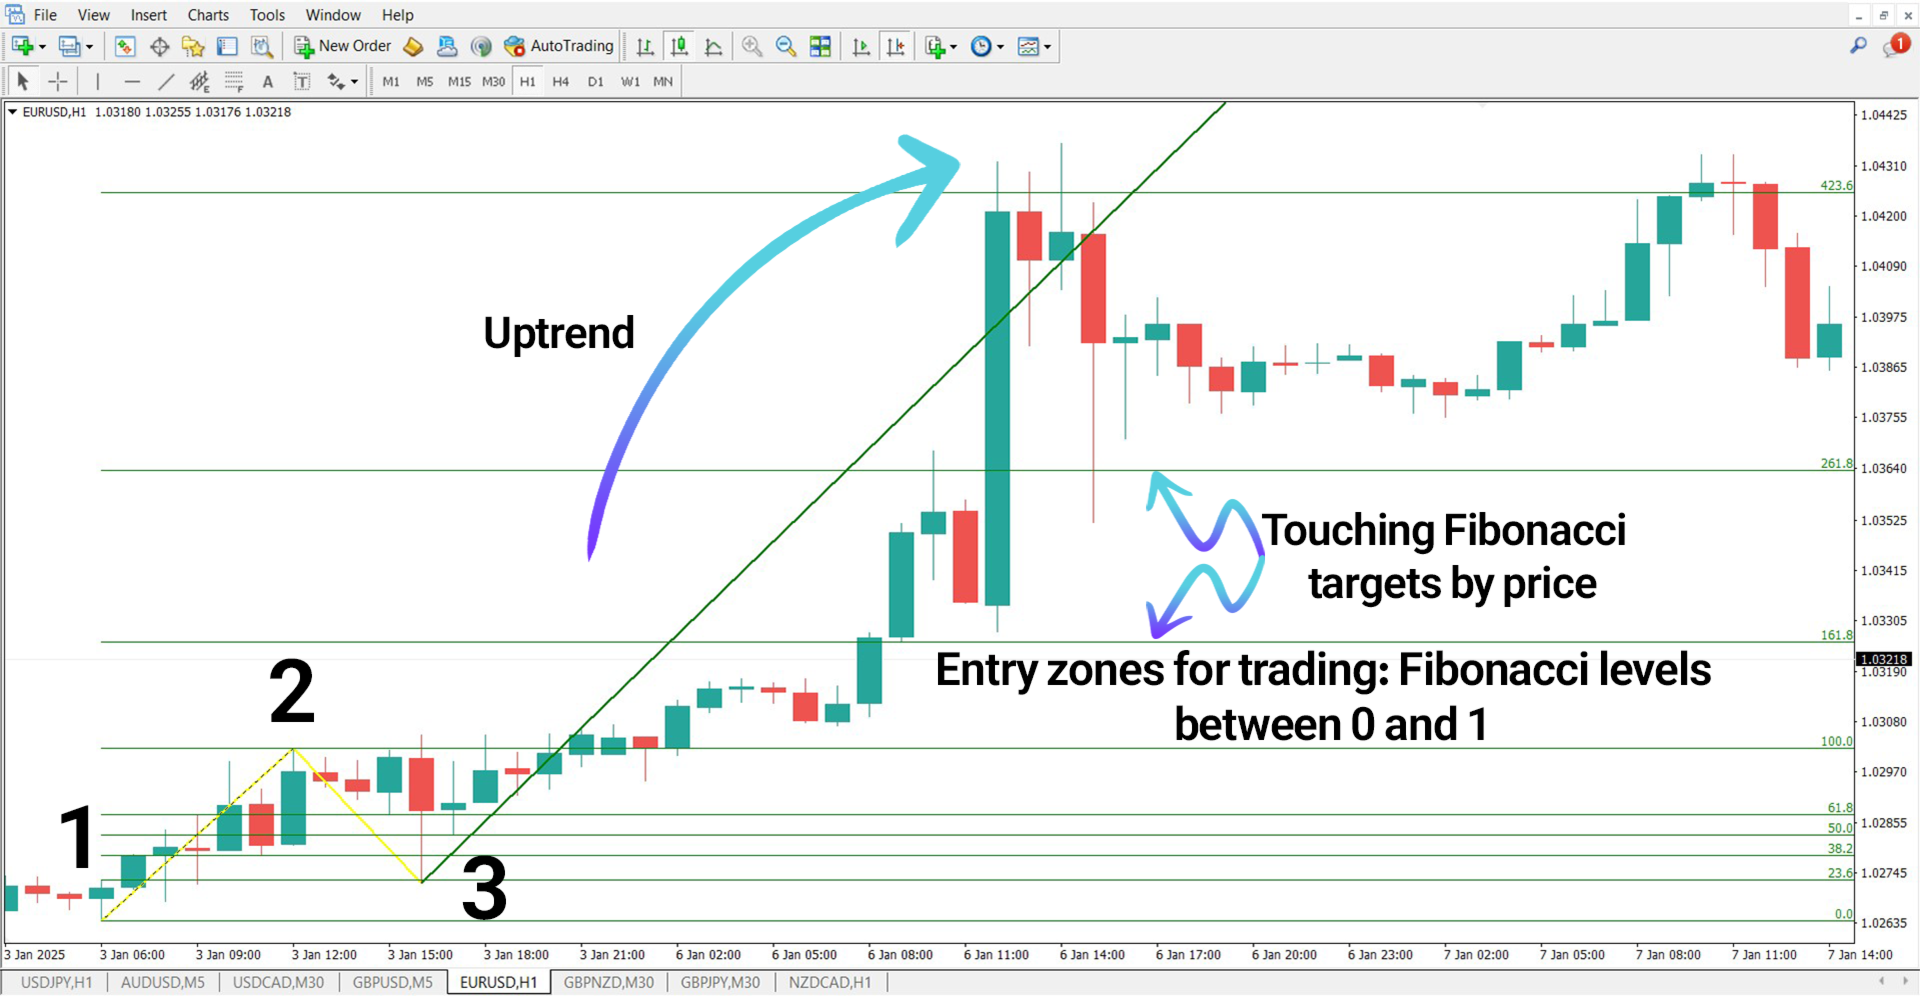
During analysis of the EUR/USD on a 1-hour chart, the tool first marks three major pivots using the 1-2-3 framework. A Fibonacci retracement is then drawn from point 1 to point 2 in the bullish leg. Traders may enter long positions at critical levels indicated by the Fibonacci tool, with take-profit points placed beyond the Fibonacci 1 line—offering strategic exits.
Indicator Behavior in Bearish Trends
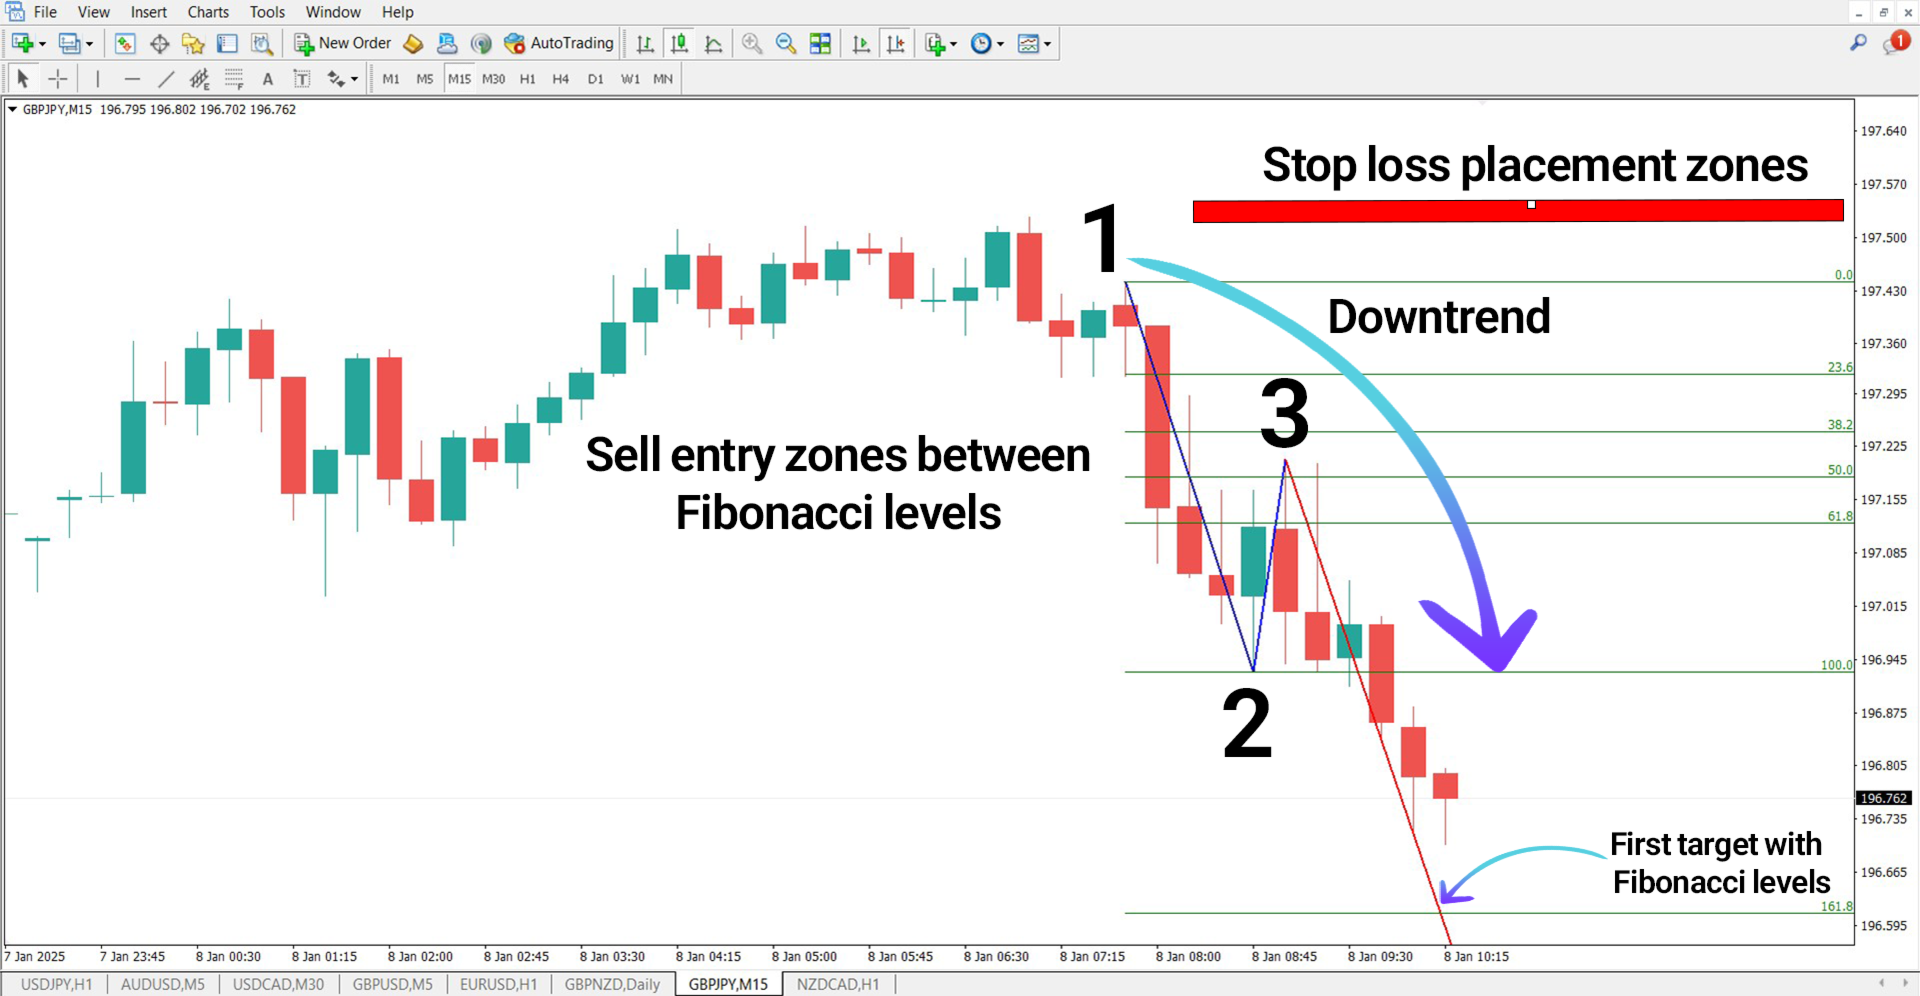
On a 15-minute chart of the GBP/JPY pair, the indicator tracks the market’s turning points and displays corresponding Fibonacci levels in a downward trend. Short entries are triggered between the 0 and 1 Fibonacci marks, while profit-taking levels are determined at deeper Fibonacci extensions. Stop-losses are placed just above the initial (0) retracement point to manage risk.
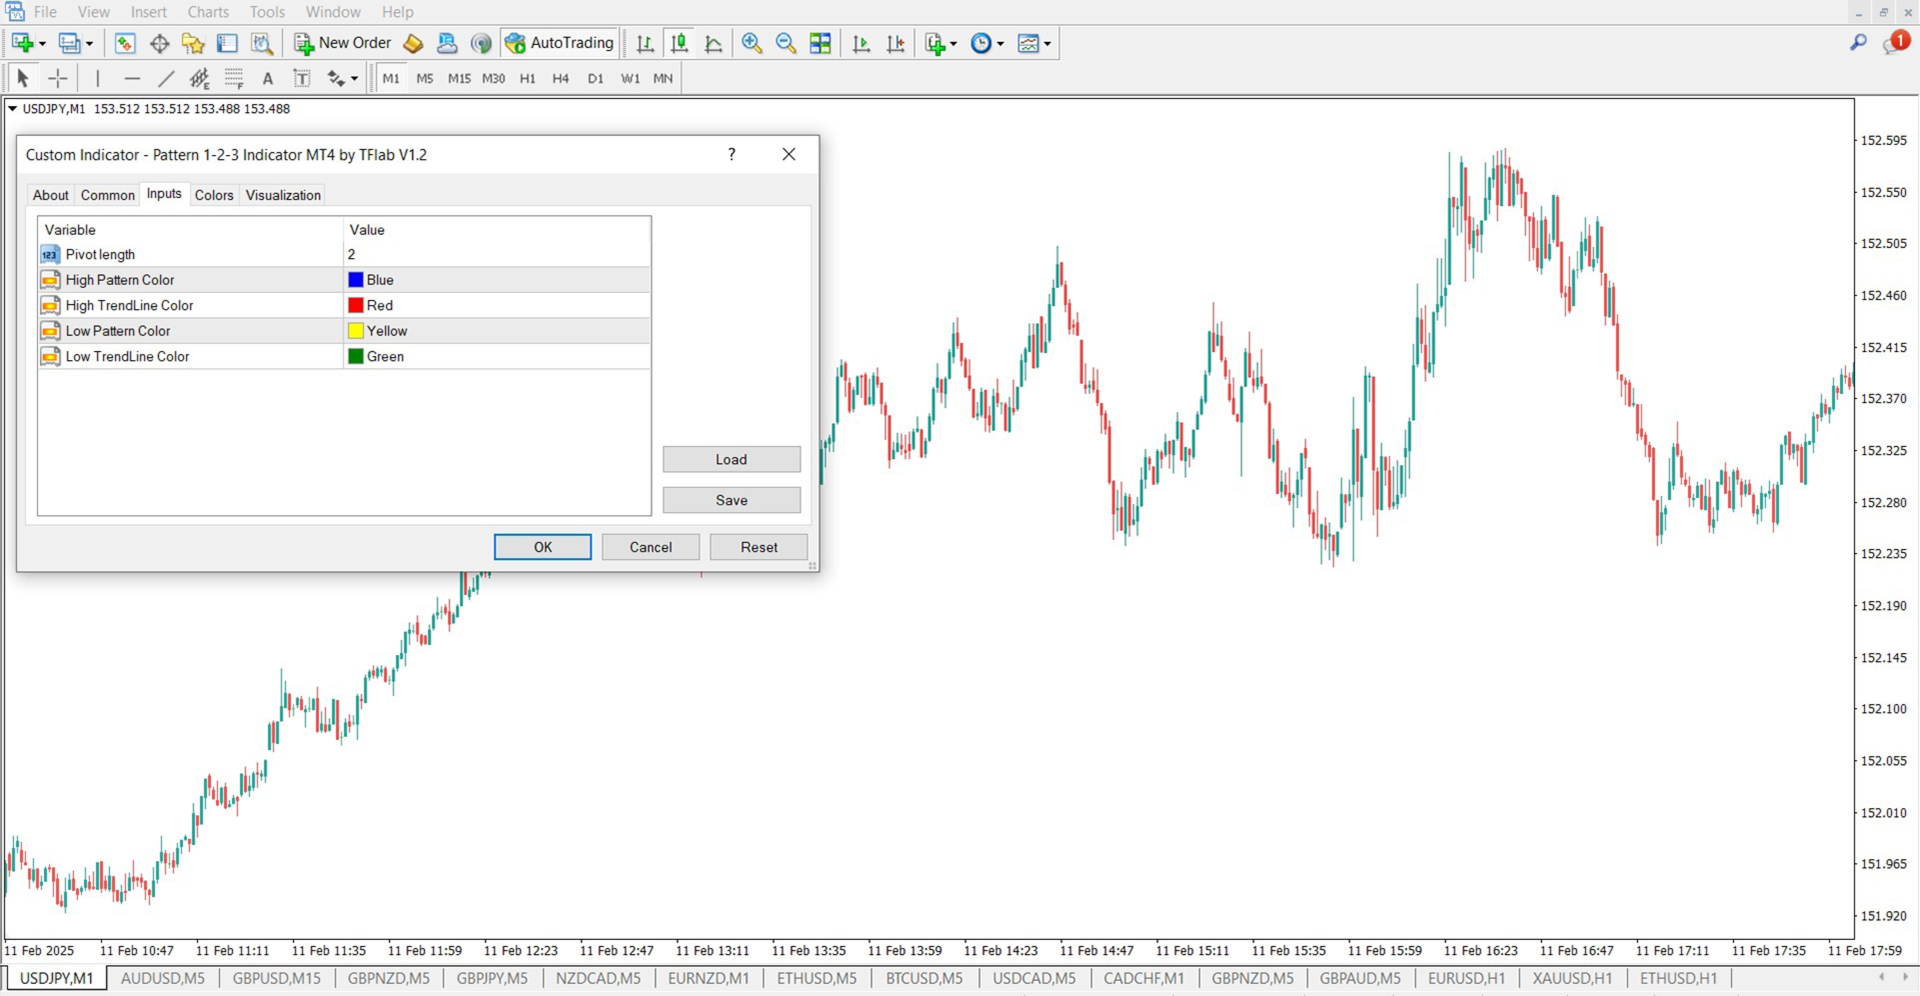
1-2-3 Pattern Indicator Settings
Below are the adjustable options provided in the settings interface:
- Pivot Length – Defines the size of each pivot leg
- High Pattern Color – Color setting for upward pattern structure
- High TrendLine Color – Color for the rising trendline
- Low Pattern Color – Color used for downward pattern structure
- Low TrendLine Color – Color for the falling trendline
Conclusion
The 1-2-3 Pattern Indicator for MetaTrader 4 offers a precise approach for identifying market structure around support and resistance zones. It integrates Fibonacci-based levels to guide entry, stop-loss, and take-profit decisions. Whether in a rising or falling market, this indicator enhances risk management and provides clear, strategic zones for trade execution.