Auric Pulse Indicator
- Indikatoren
- Lungile Mpofu
- Version: 1.0
- Aktivierungen: 5
Indicator Overview
The indicator provides:
-
Three trend states (color-coded):
-
Green = Uptrend (strong bullish momentum)
-
Red = Downtrend (strong bearish momentum)
-
Yellow = Consolidation (sideways market)
-
-
Multi-pair dashboard (monitor multiple assets, including XAUUSD).
-
Performance tracking (accuracy, pips gained/lost).
-
Alerts & signals (buy/sell signals with take-profit levels).
Indicator Settings & Configuration
Input Parameters
| Parameter | Description | Recommended for Gold (XAUUSD) |
|---|---|---|
| Period | Lookback period for trend calculation | 14 (default) |
| Sensitivity | Adjusts trend detection (0-100) | 50-70 (Gold is volatile, higher sensitivity helps) |
| Take Profit (pips) | Auto-calculated TP level | 20-50 (adjust based on volatility) |
| Currency Pairs | Pairs to monitor (e.g., XAUUSD) | XAUUSD (must be included) |
| Timeframe | Chart timeframe | H1 or H4 (best for gold) |
Gold-Specific Adjustments
-
Gold moves in larger swings, so:
-
Use H1 or H4 timeframes for better signals.
-
Set Take Profit between 20-50 pips (adjust based on market conditions).
-
Higher sensitivity (~60-70) helps catch fast gold movements
-
How to Use the Indicator for Gold Trading
A. Identifying Trends
-
Uptrend (Green Line)
-
Price is above the green line.
-
Look for buy opportunities on pullbacks.
-
-
Downtrend (Red Line)
-
Price is below the red line.
-
Look for sell opportunities on retracements.
-
-
Consolidation (Yellow Line)
-
Price is ranging.
-
Avoid trading or use breakout strategies.
-
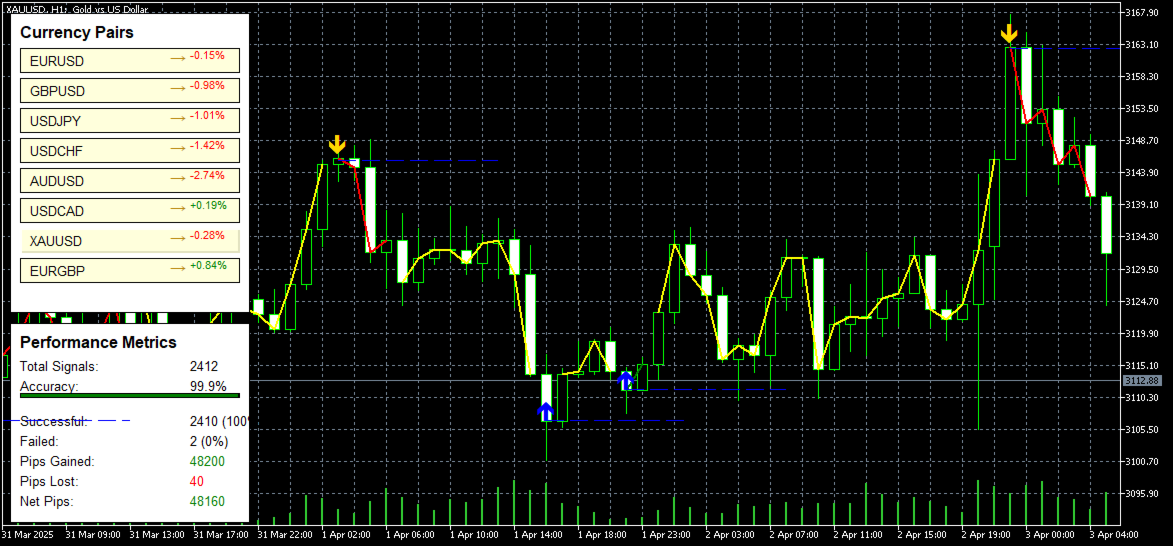
B. Trade Signals
-
Buy Signal: When trend changes from red/yellow → green.
-
Sell Signal: When trend changes from green/yellow → red.
-
Confirmation: Wait for a close above/below the trendline.
C. Risk Management
-
Stop Loss: Place below recent swing low (Buy) / above swing high (Sell).
-
Take Profit: Use the indicator’s auto TP or adjust manually.
6. Trading Strategies for Gold
Strategy 1: Trend-Following
-
Wait for strong green (uptrend) or red (downtrend).
-
Enter on a pullback to the trendline.
-
Set TP at next resistance/support or use auto-TP.
Strategy 2: Breakout Trading
-
During yellow (consolidation), mark support/resistance.
-
Enter when price breaks out with new trend color.
-
TP = 1.5x the consolidation range.
Strategy 3: Multi-Timeframe Confirmation
-
Check H4 trend direction (for bias).
-
Use H1 for entries (when both timeframes align).
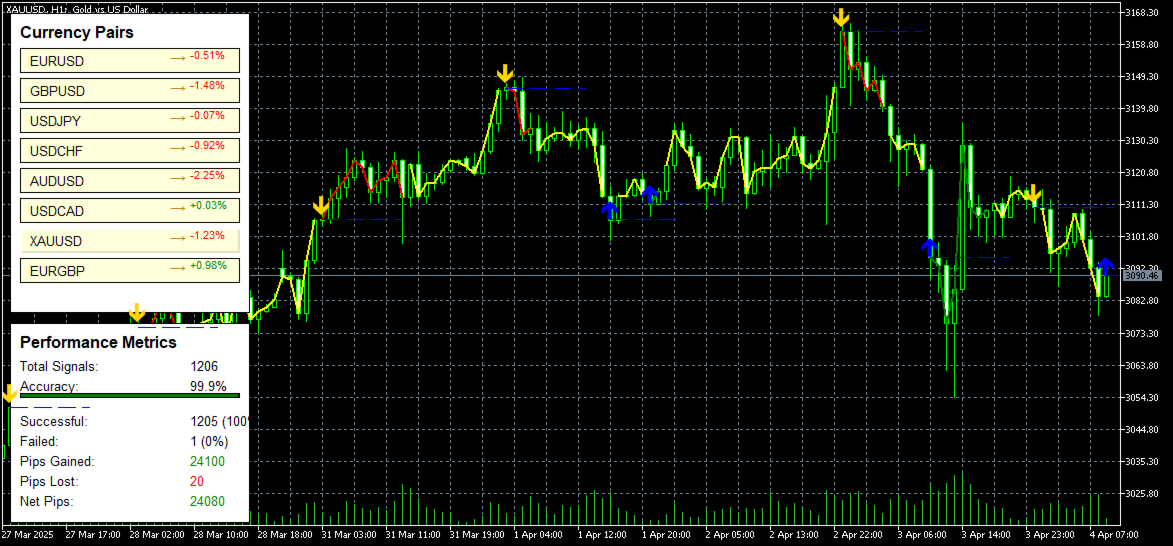
7. Dashboard & Performance Metrics
The indicator includes a real-time dashboard:
-
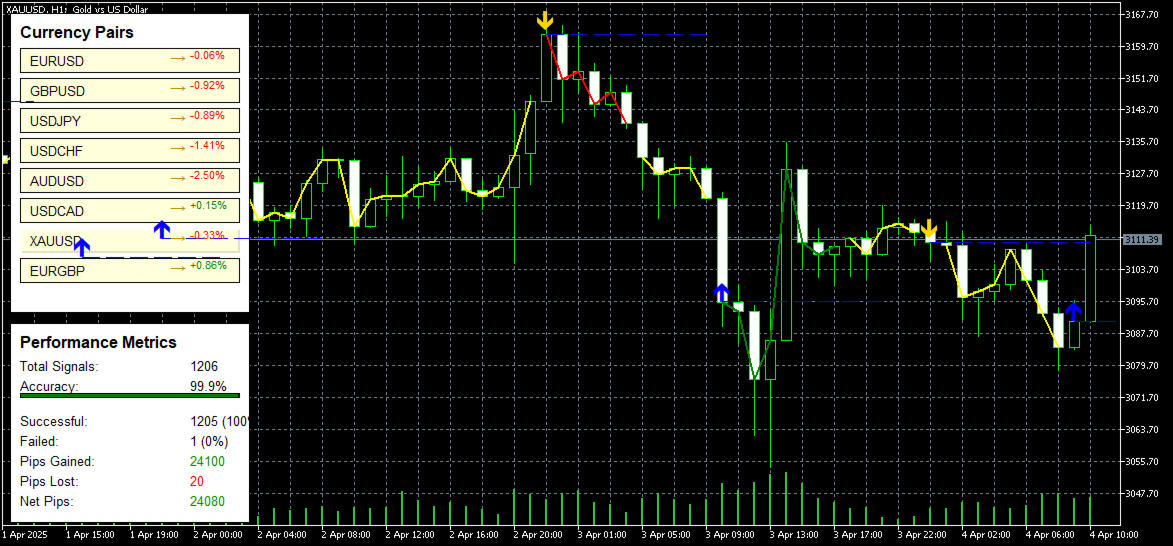
Currency Pairs Panel: Shows trends for XAUUSD and other pairs.
-
Performance Metrics:
-
Total signals generated.
-
Success rate (% accuracy).
-
Pips gained/lost.
-
Net profitability.
-
How to Use the Dashboard
-
Click on XAUUSD to focus on gold.
-
Monitor trend strength
-
Check % change to see recent momentum