Points of control
- Indikatoren
- Martin Slacka
- Version: 1.0
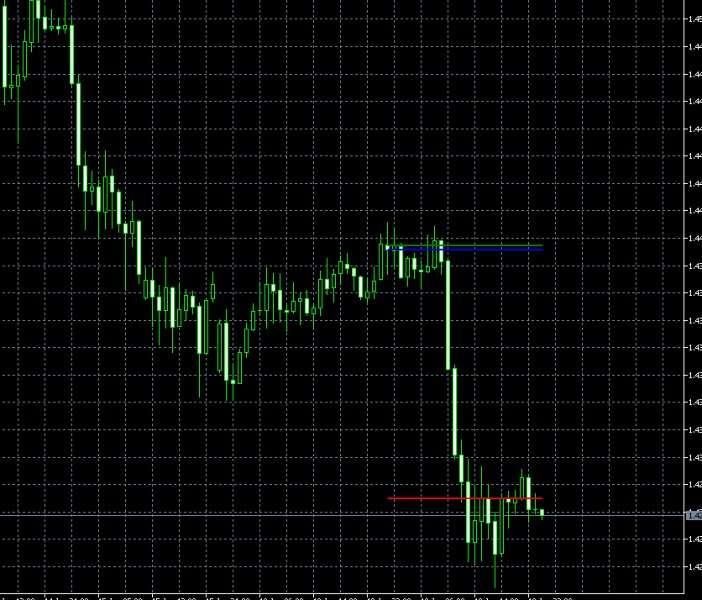
The POC_Levels indicator calculates and displays the 3 most frequently occurring price levels (Points of Control – POC) based on historical candles.
It is useful for identifying areas of high market interest (like support/resistance zones) across any timeframe.
How It Works
The indicator analyzes the last LookbackBars candles.
It counts how many times each price level (based on the selected price type) appears.
Then it selects the top 3 most frequent prices and draws horizontal lines at those levels.
These lines update live with every tick and are only shown from the area of calculation to the current candle.
🧩 Input Parameters
| Parameter | Description |
|---|---|
| LookbackBars | Number of candles to scan back from the current candle |
| PriceType | Applied price used for analysis (e.g., Close, Open, High, Low, etc.) |
| ShowPOC1 | Show/hide the most frequent price level (POC 1) |
| POC1Color | Color of the line for POC 1 |
| POC1Width | Line thickness for POC 1 |
| ShowPOC2 | Show/hide the second most frequent price level (POC 2) |
| POC2Color | Color of the line for POC 2 |
| POC2Width | Line thickness for POC 2 |
| ShowPOC3 | Show/hide the third most frequent price level (POC 3) |
| POC3Color | Color of the line for POC 3 |
| POC3Width | Line thickness for POC 3 |
