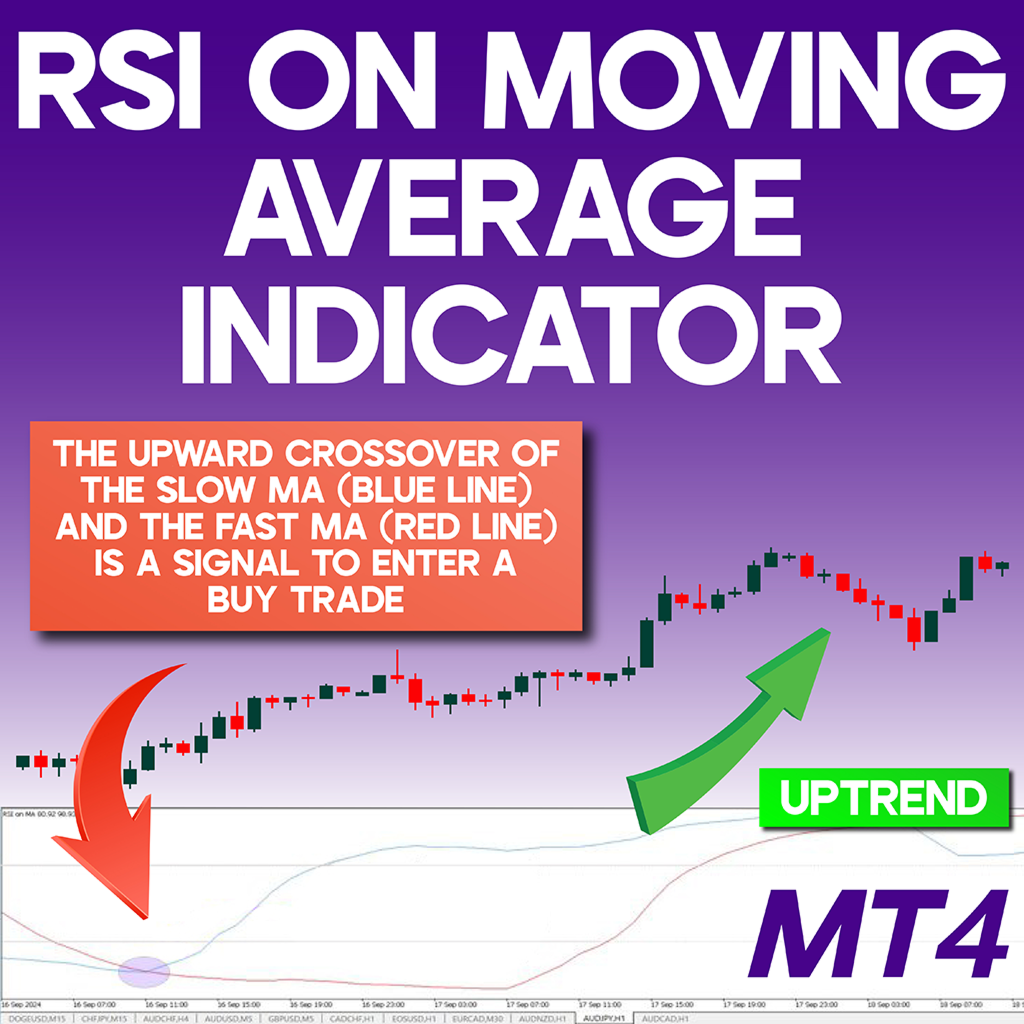
RSI on Moving Average Indicator MT4
- Indikatoren
- Eda Kaya
- Version: 1.11
RSI with Moving Average Indicator for MT4
One of the widely used strategies for trend-following trading involves Moving Average Crossovers. The RSI with MA Indicator enhances this approach by integrating the Relative Strength Index (RSI) alongside moving averages, offering a more refined entry and exit strategy.
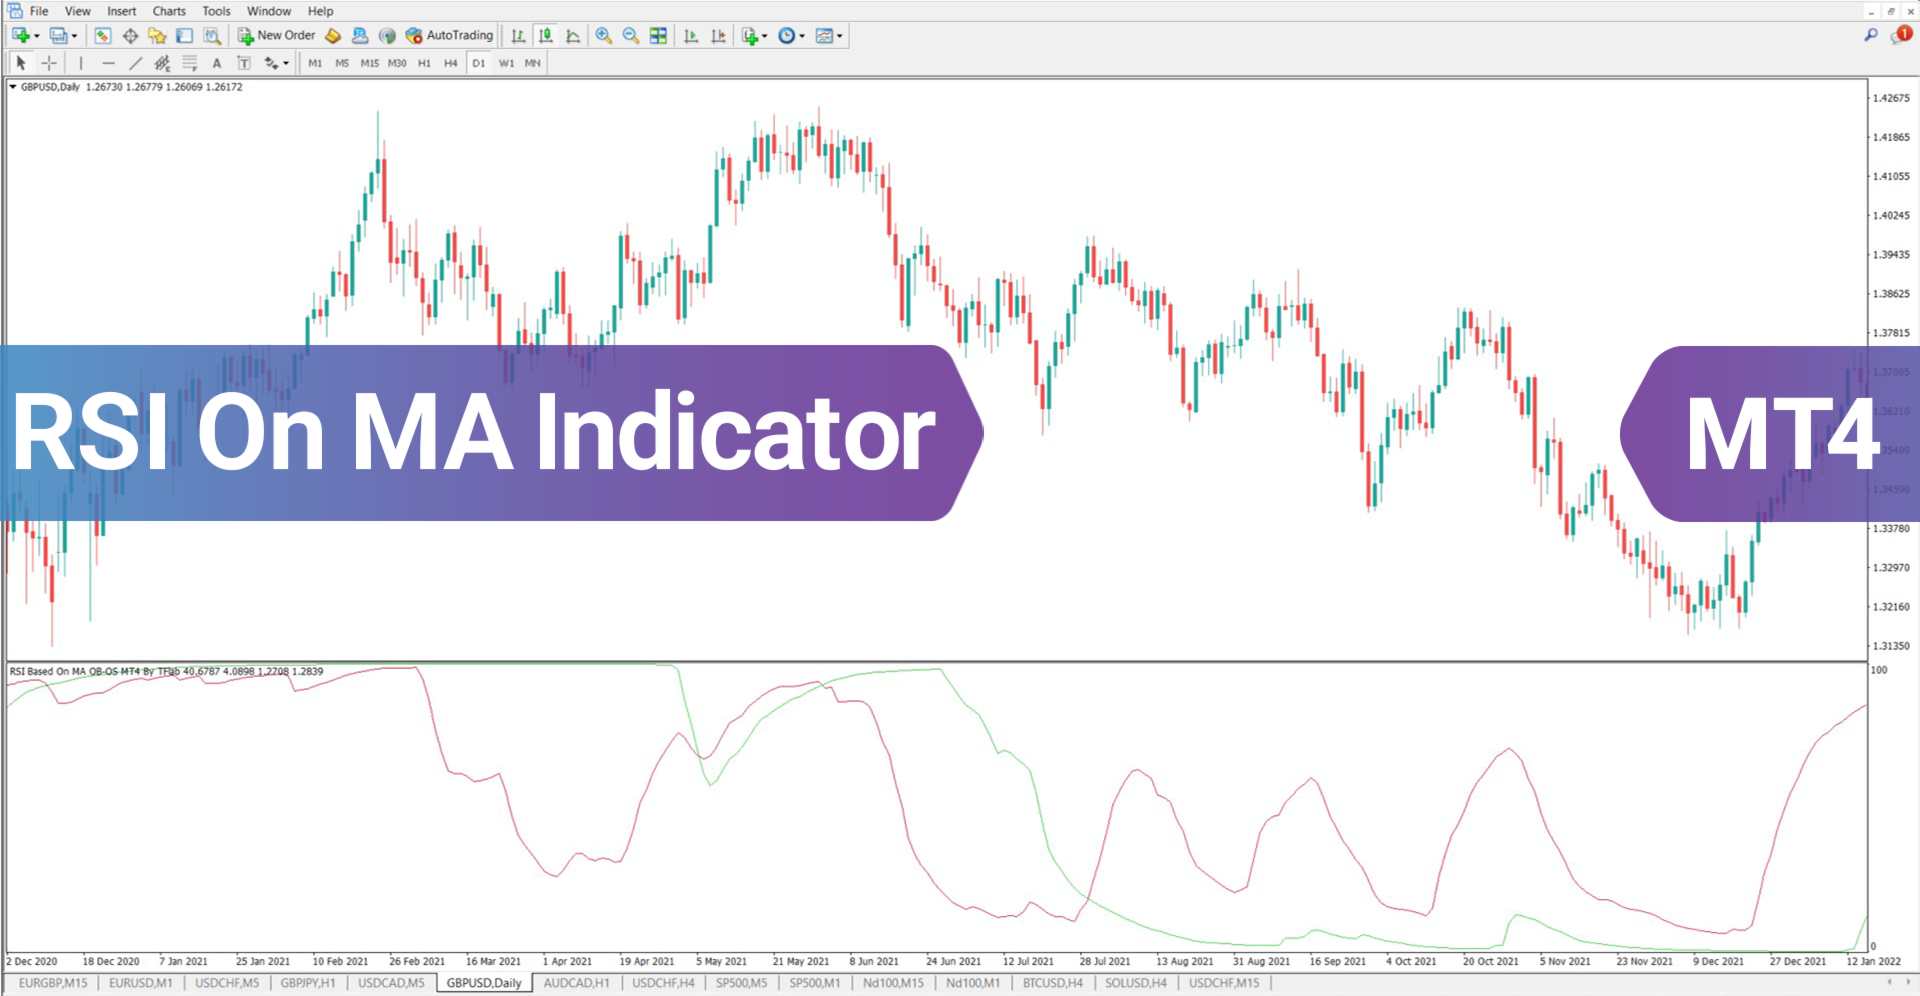
This indicator displays two oscillating lines within the 0 to 100 range, generating buy and sell signals based on their crossovers.
«Indicator Installation & User Guide»
MT4 Indicator Installation | RSI on Moving Average Indicator MT5 | ALL Products By TradingFinderLab | Best MT4 Indicator: Refined Order Block Indicator for MT4 | Best MT4 Utility: Trade Assistant Expert TF MT4 | TP & SL Tool: Risk Reward Ratio Calculator RRR MT4 | Money Management: Easy Trade Manager MT4
RSI with Moving Average Indicator Specifications
The following table outlines the key details of this indicator:
| Category | Trading Tool - Oscillator - Volatility-Based |
| Platform | MetaTrader 4 |
| Skill Level | Intermediate |
| Indicator Type | Leading - Trend Continuation |
| Timeframe | Multi-timeframe Support |
| Trading Style | Intraday & Short-term Trading |
| Markets | Forex - Stocks - Cryptocurrency |
Indicator Overview
Beyond trend identification, this indicator also measures momentum strength. The red RSI line represents the longer-term moving average, whereas the green RSI line corresponds to the shorter-term moving average. A trade signal is generated whenever these two lines cross.
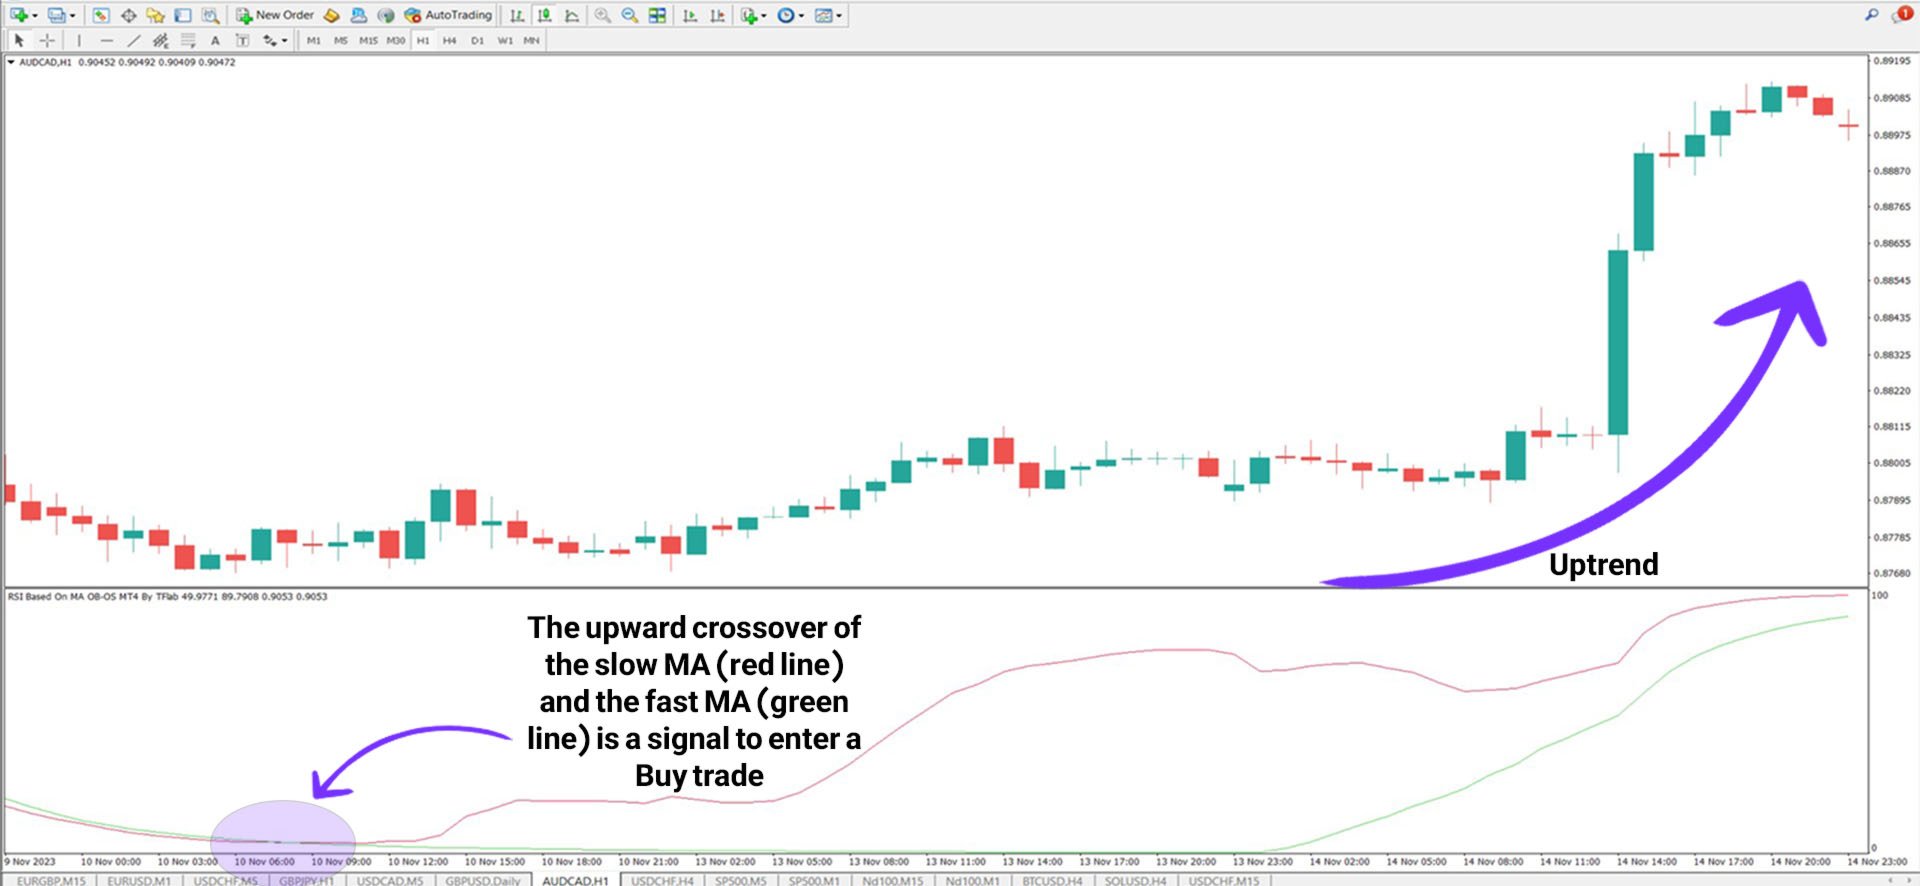
Application in an Uptrend
In an AUD/CAD price chart, when the red moving average crosses above the green moving average, it signals a buy opportunity. Traders can further verify this signal by analyzing candlestick patterns and confirming other technical factors before opening a long position.
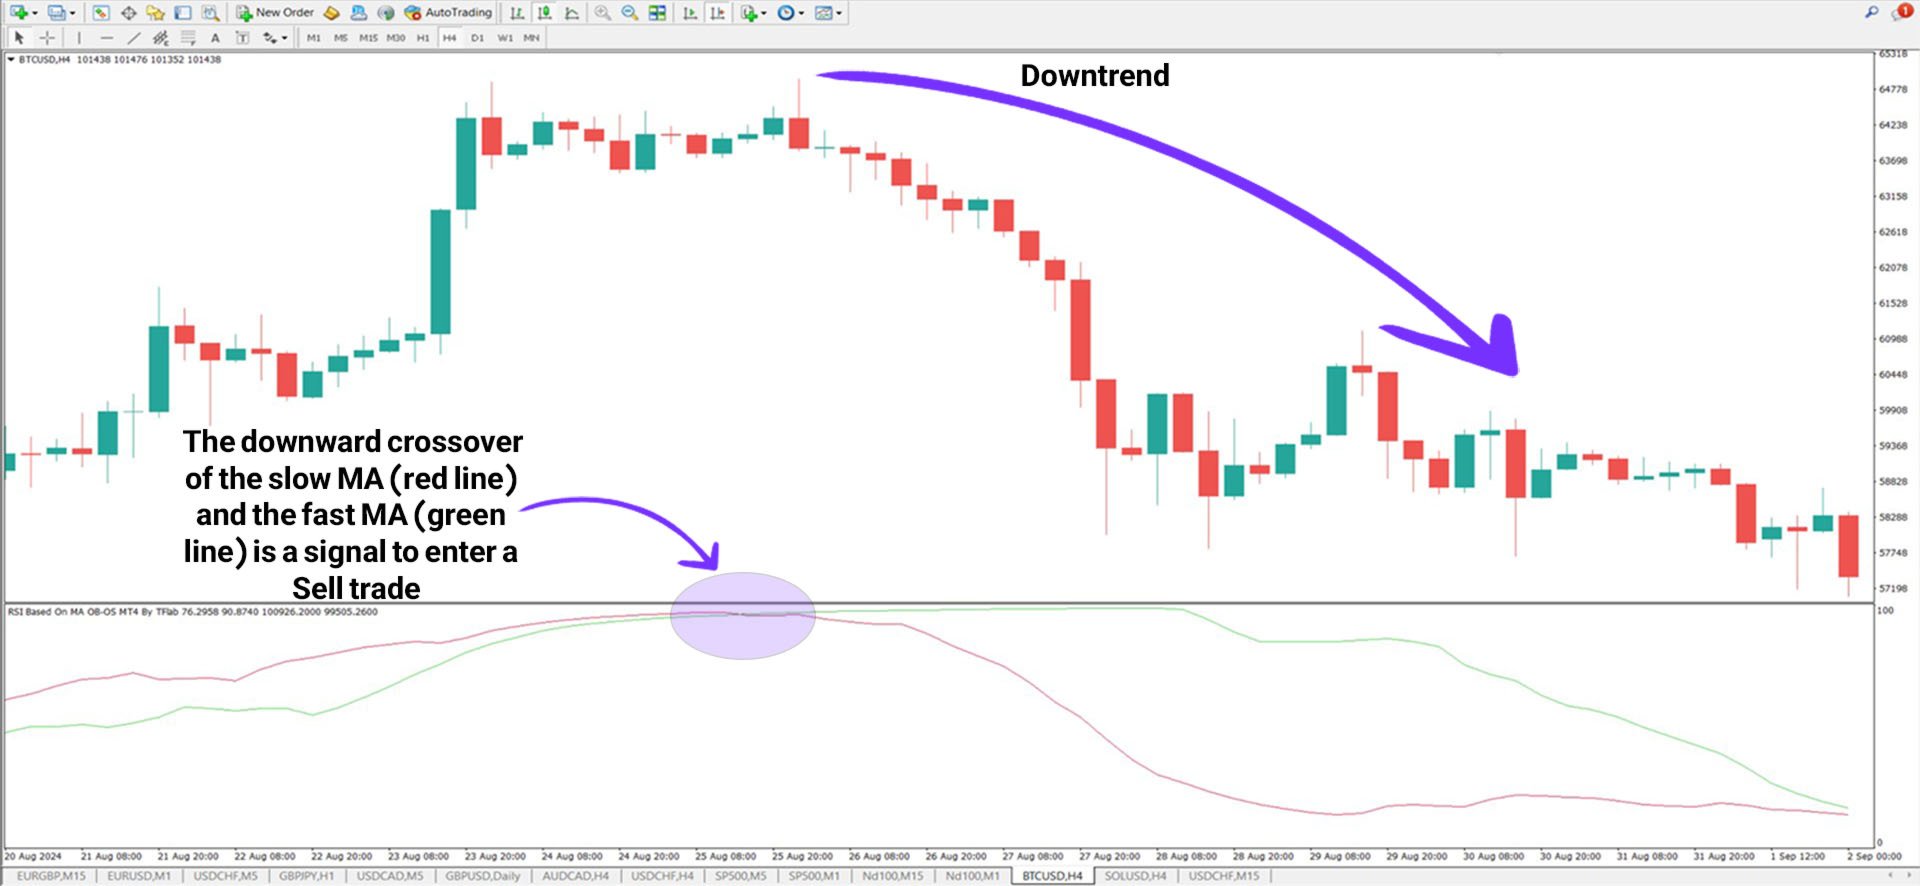
Application in a Downtrend
The Bitcoin (BTC) chart on the 4-hour timeframe illustrates a bearish setup: when the red moving average crosses below the green moving average, it generates a sell signal. Traders often validate this setup using additional indicators like candlestick formations (e.g., Doji patterns) before executing a sell order.
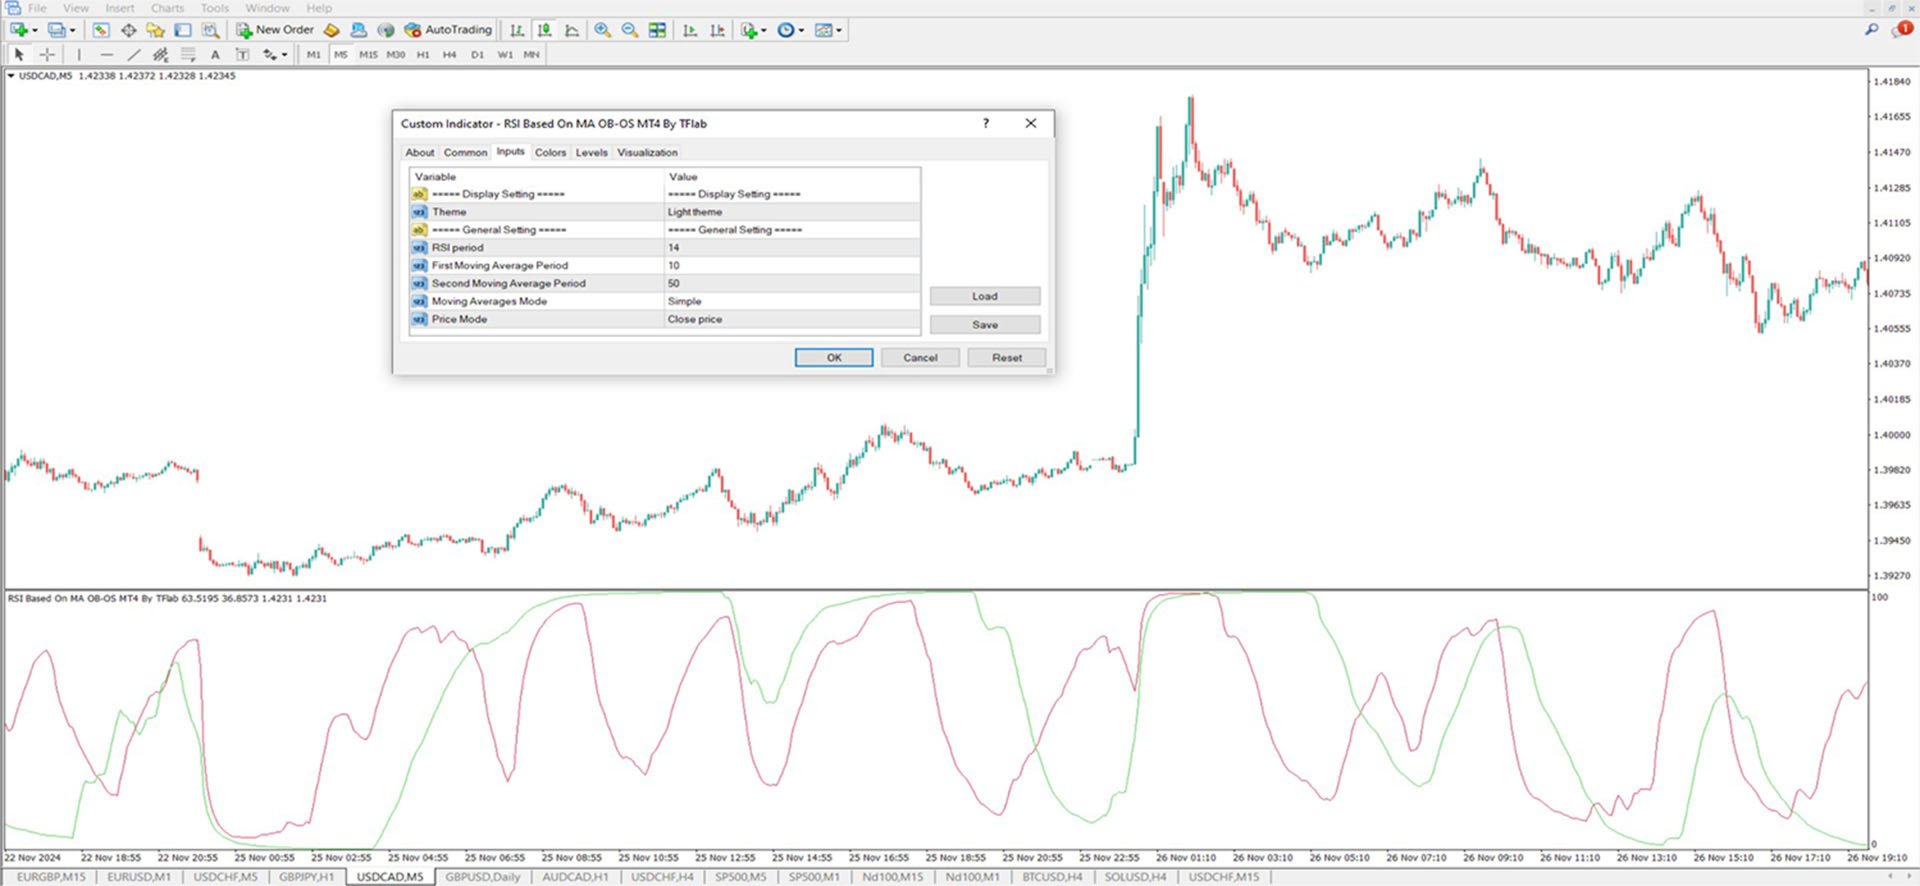
RSI with Moving Average Indicator Settings
The configuration of this indicator includes the following adjustable parameters:
- Chart Theme – Background customization options.
- RSI Period – The number of candles considered in the RSI calculation.
- Fast Moving Average Period – The timeframe for the shorter moving average.
- Slow Moving Average Period – The timeframe for the longer moving average.
- Moving Average Type – The method of calculation (e.g., SMA, EMA).
- Price Mode – The price input used (Open, Close, High, or Low).
Final Thoughts
The RSI with MA Indicator merges Relative Strength Index (RSI) with Moving Averages (MA) to create a comprehensive technical analysis tool. It operates between 0 and 100 levels, where the green line represents the RSI derived from the faster-moving average, while the red line reflects the RSI of the slower-moving average.
This tool is particularly useful for traders looking to align their trades with market momentum while confirming trends effectively.