• Übersicht
  • Bewertungen
  • Diskussion

Wave Synchronizer MT5

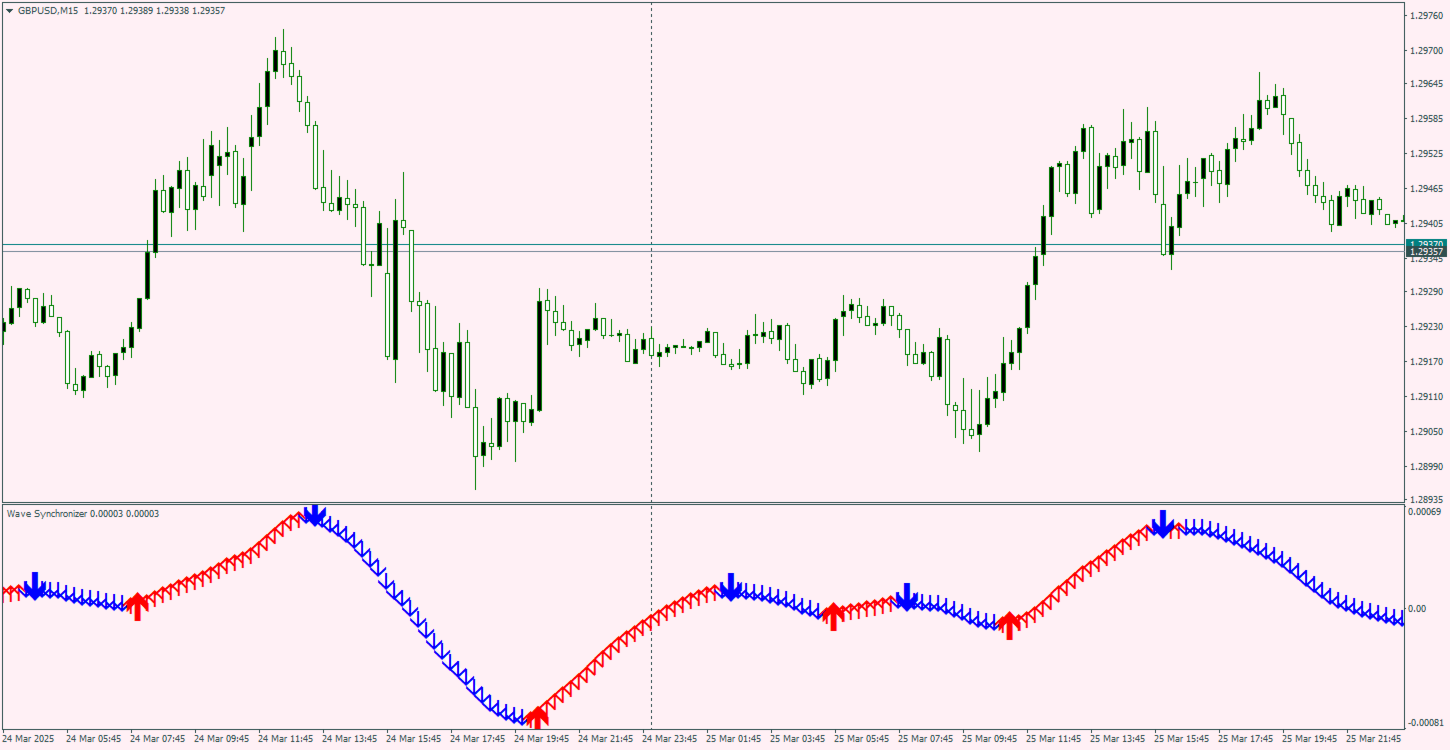
Wave Synchronizer – visueller Indikator der Wellenanalyse. Kombiniert Candlestick-Bewegungssequenzen und erzeugt gerichtete Wellenmuster, wodurch synchrone Bewegungen mit dem Markt entstehen.
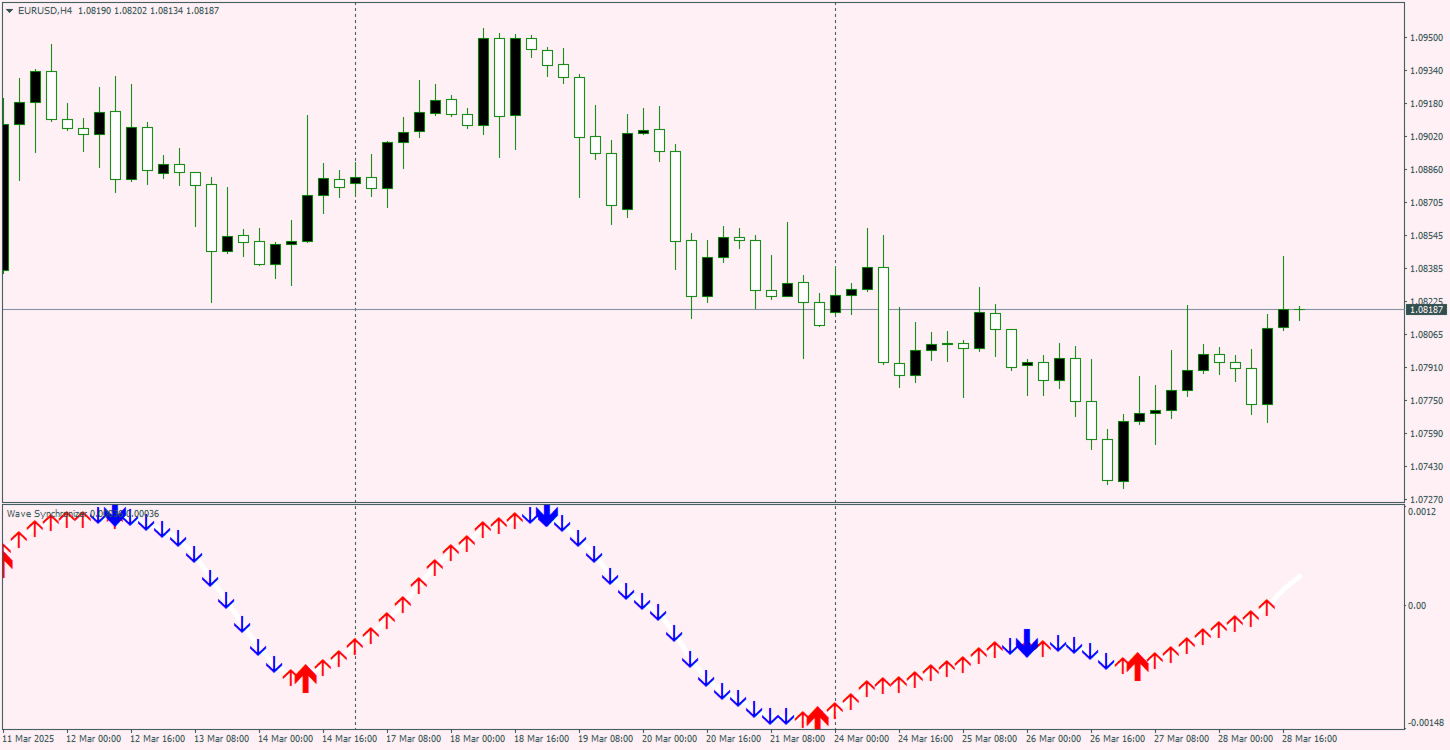
Der Beginn jeder Welle wird mit einem Signalpfeil angezeigt, außerdem gibt es Benachrichtigungen.

Der Indikator wird die Pfeile im vergangenen Verlauf niemals neu zeichnen oder verschieben.
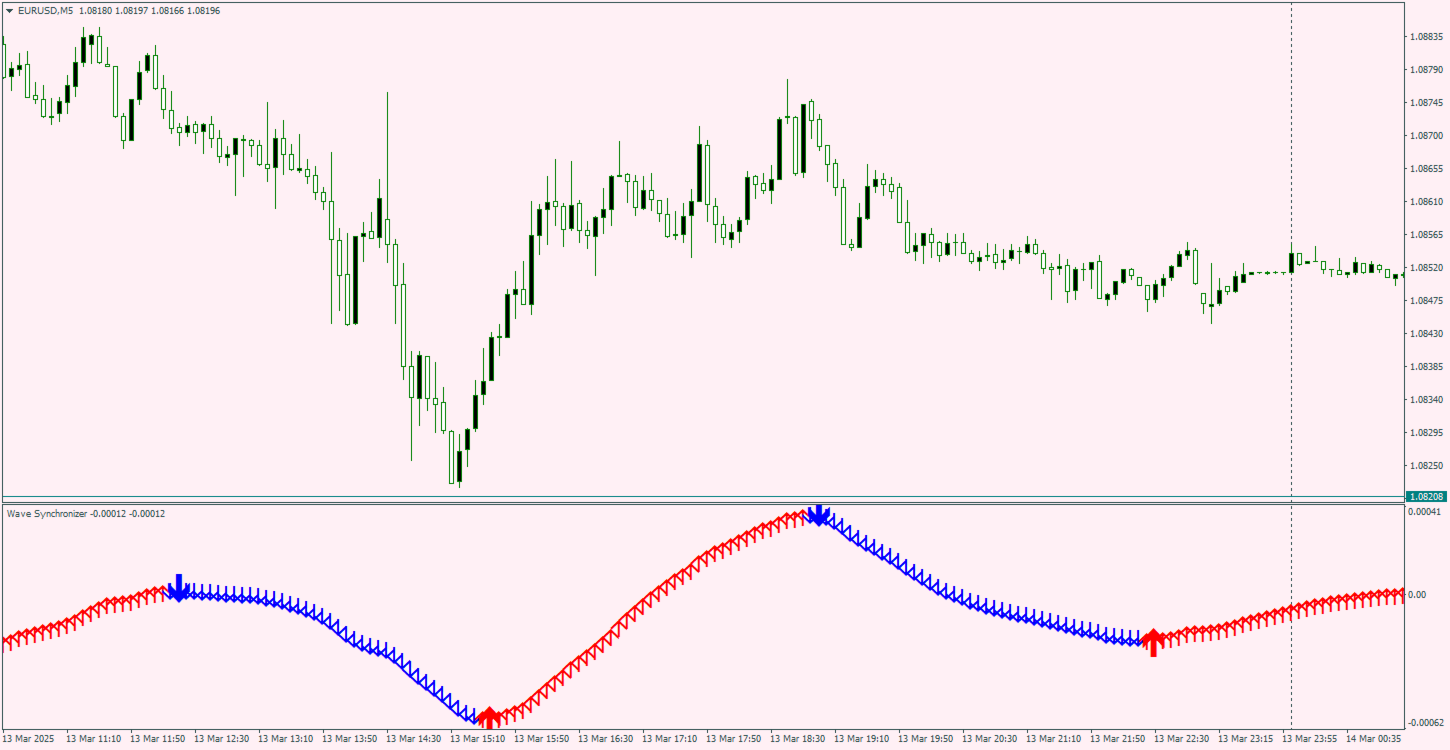
Beim Schließen der Kerze erscheinen Signalpfeile.
Passt sich an alle Handelsinstrumente und Zeitrahmen an.
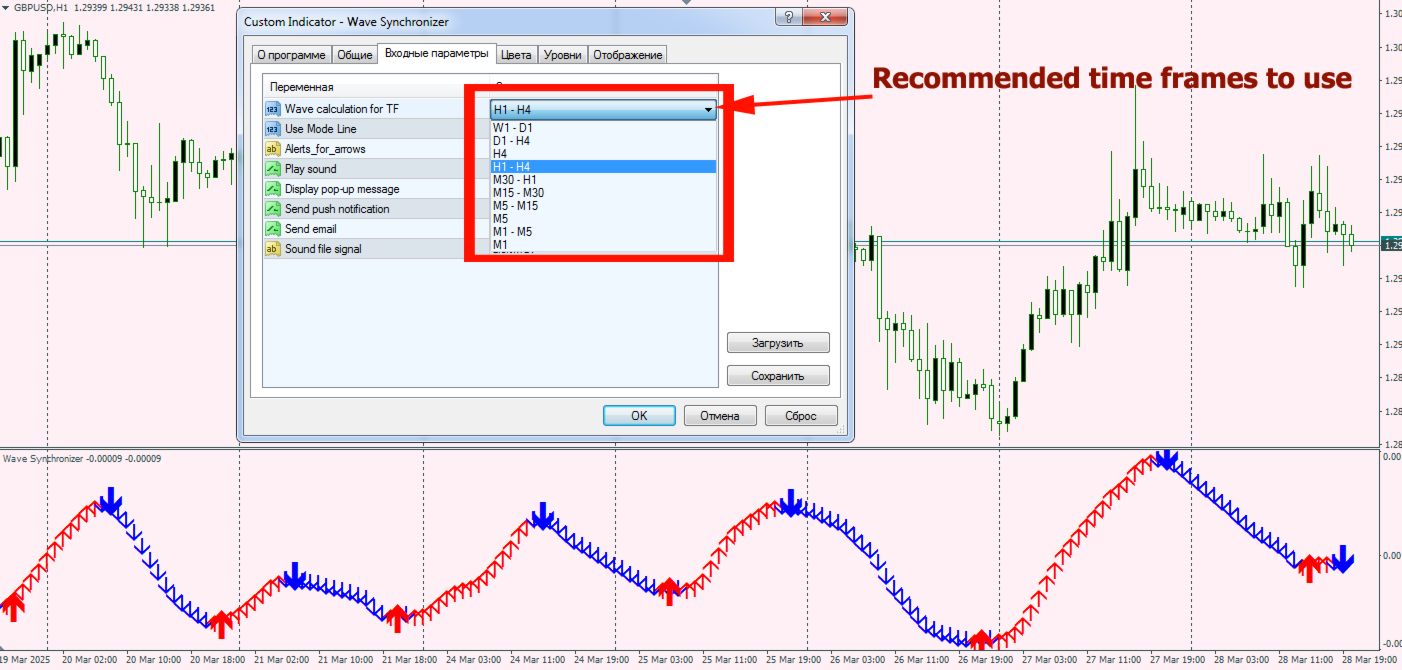
Einfach zu verwenden und zu konfigurieren, enthält nur 2 Eingabeparameter: Auswahl des Zeitrahmens zur Verwendung mit ausgewählten Parametern und Methode zur Berechnung von MA-Linien.
Empfohlene Parameter können um 1–2 Perioden verschoben werden.

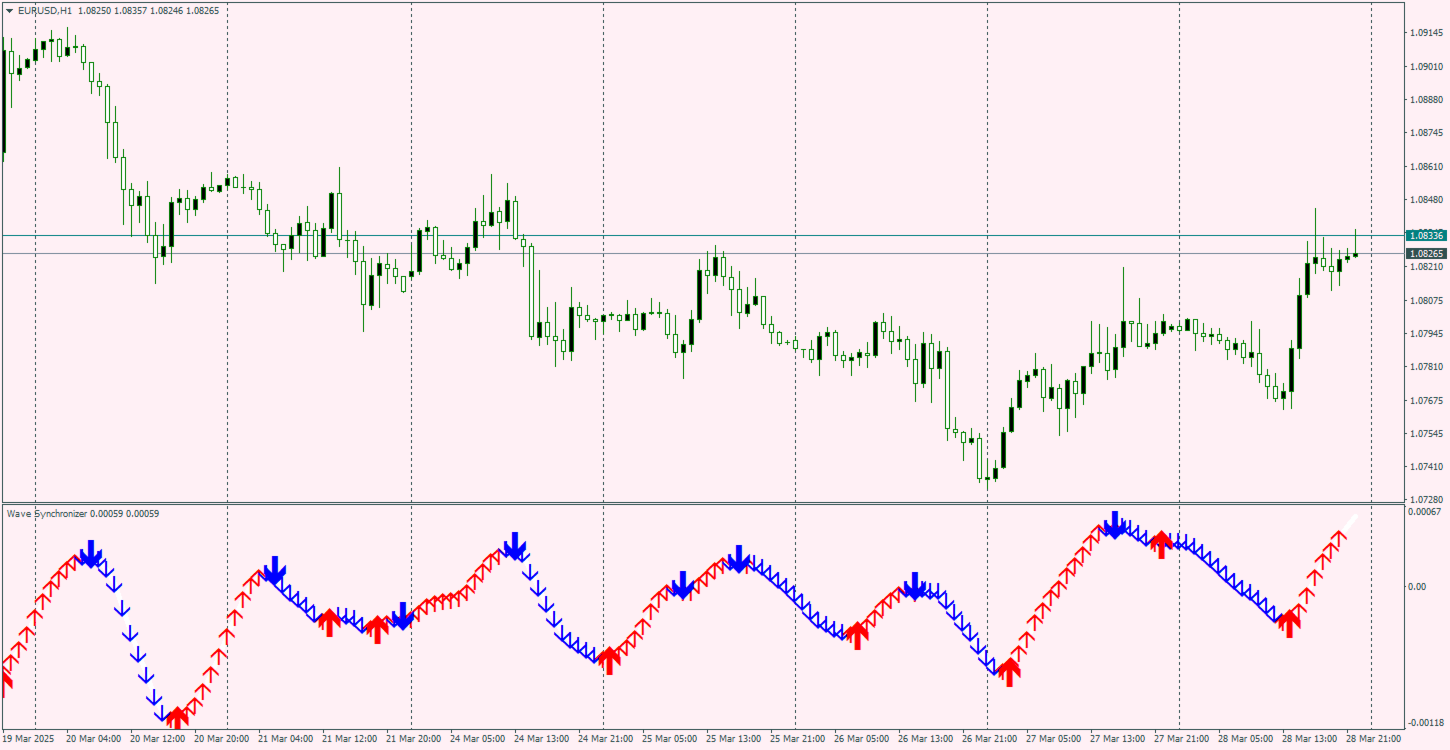
Roter Pfeil zeigt die Richtung für den Kauf eines Handelswerts an.
Blaue Pfeilrichtung zum Verkauf eines Handelswerts.
Empfohlene Produkte
Signal Eskiya, in addition to channel lines, reflects entry signals in the form of arrows. Trading strategies using the channel indicator belong to the classic methods of technical analysis, are easy to execute, and therefore available even to beginners. Price ranges work equally well on any trading assets and timeframes, they can be used both independently and with additional confirmation from oscillators and market volumes. American traders say: “Trend is your friend”, which means “Trend is
Der Indikator „Probability Range Bands“ zeigt eine Vorhersage, um wieviel sich ein Kurs bzgl. seines bisherigen Wertes bewegen wird. Die Bänder grenzen einen Bereich mit einer bestimmten Wahrscheinlichkeit ein, dass die aktuelle Kerze nicht über/unter dem bestimmten Preislevel schließt.   Dieser Indikator basiert auf statistischen Methoden, Wahrscheinlichkeiten und Volatilität. Der Anlagenkurs wird als log-normal-verteilt angenommen. Deshalb werden zur Berechnung der Bereichsbänder die „log retu
SMA Fibonacci EA
Christoph Kreher
Simple EA with 1 SMA and Fibonacci. The Expertadvisor opens positions in the direction of the trend when price levels have exceeded or fallen below the Fibonacci levels. It depends on the market in question and which parameters to use. The EA is programmed in such a way that optimization runs consume little time. A news filter and filter by day of the week are built in.
ReSu mt5
Daniel Opoku
The Wamek Support and Resistant (WSR) Indicator is a remarkable tool that stands out in the world of technical analysis. It sets itself apart by cleverly combining price action and leading indicators to delineate support and resistance levels with a high degree of accuracy. Its unique feature is its adaptability; users can fine-tune the indicator by adjusting input parameters, enabling them to create customized support and resistance levels that suit their trading strategies. Notably, one of WSR
Seasonal Pattern Trader
Dominik Patrick Doser
Disclaimer:   Bedenken Sie, dass saisonale Muster nicht immer zuverlässig sind. Deshalb ist ein durchdachtes Risikomanagement entscheidend, um Verluste zu minimieren. Saisonale Muster in der Finanzwelt sind wie ein gut gehütetes Geheimnis, das erfolgreiche Investoren für ihren Vorteil nutzen.  Diese Muster sind wiederkehrende Preisbewegungen, die in bestimmten Zeiträumen oder um besondere Ereignisse auftreten. Hier sind einige Beispiele und Hinweise zur optimalen Nutzung dieser Muster: Beispiel
FIBO Trend PRO mt5
Evgenii Aksenov
4.5 (8)
The indicator allows you to instantly determine the current trend by color and FIBO levels. Higher Timeframe the panel shows the current trend of higher periods, helping to determine the strength of the trend. Trade according to the trend when changing the color of candles or trade against the trend when the price hit the extreme levels of the FIBO Trend PRO  indicator   Advantages of the FIBO Trend PRO Indicator never repaint and does not change their values Very easy to use and intuitive Appl
FREE
This indicator calculates and displays Murrey Math Lines on the chart. This MT5 version is similar to the МТ4 version: It allows you to plot up to 4 octaves, inclusive, using data from different time frames, which enables you to assess the correlation between trends and investment horizons of different lengths. In contrast to the МТ4 version, this one automatically selects an algorithm to search for the base for range calculation. You can get the values of the levels by using the iCustom() funct
Marktstrukturen sind diejenigen, die bei einem Ausbruch in einem höheren Zeitrahmen dazu beitragen können, einen Trend für einen Händler zu klären. 1. Dieser Indikator zeichnet ZigZag nur zu den letzten 2 Strukturen (vorheriges Hoch und Tief von ZigZag) und ein neuer ZigZag-Balken wird nur gebildet, wenn ein Strukturbruch eintritt 2. Es gibt Terminal- und Push-Benachrichtigungen bei Strukturunterbrechungen 3. Erhöhen und verringern Sie die Tiefe des ZigZag mit den Tasten [ und ], um den Swing
Glider
Vitalii Zakharuk
The Glider indicator gives accurate and timely signals to enter and exit the transaction that appear on the current candle. Using the indicator is very simple. When a dot and a blue line appear, open a buy deal. When a dot and a red line appear, open a sell deal. The main purpose of this indicator is to determine the moments of entry and exit from transactions, therefore the Glider indicator will display only the trend line and entry points, i.e. displays displays the entry points to the marke
CCI Profesional
Ignacio Agustin Mene Franco
CCI Professional, has the simple fact of being able to do a scalping or intraday without using any other indicator to take some operation taking advantage of the rebounds in the lines of -200 for long and +200 for short, it is very easy to use and very practical for each market, it can be used for crash and boom since it works very well to hunt spikes, for volatiles and jumps, also for forex. It is used in any temporality.
Considering the main theories of Forex (Dow Theory, support lines, chart patterns, and Fibonacci retracements), It tells you the price range where whales (large investors) are likely to appear. You can trade at the price points that professionals also aim for. You no longer have to warry about where to aim next. We are live-streaming the actual operation of the system. Please check for yourself if it is usable. Please check it out for yourself. https://www.youtube.com/@ganesha_forex We do not
I recommend you to read the  product's blog  (manual) from start to end so that it is clear from the beginning what the indicator offers. This multi time frame and multi symbol supply and demand zone dashboard indicator sends alerts when the price has reached a supply/demand zone. It is also possible to use it to be alerted about regular double tops/bottoms instead of zones. It can be used with all time frames from M1 to MN. Maximum 9 time frames can be shown in the dashboard at the same time. 
Simple indicator to calculate fibonacci retracement levels on time. Add to chart and move trend line to set the fibonacci retracement levels. Inputs Levels  - levels for which to calculate values, separated by space, default are fibonacci levels Show time  - if true, time will be shown on levels Show date  - if true, date will be shown on levels Show fibonacci level  - if true, value of levels will be shown Fibonacci lines color  - color of levels Trend line color  - color of trend line which de
FREE
DM IND Exclusive
Sergio Vidal Prado
Indicador Para Opções Binarias. Indicator for Binary Options Usa dois gales. Instalar em mt5 Esse indicador é para ser usado no tempo de vela de 5 minutos e em M5. Este também funciona em M1, porém é mais eficiente em M5. Só descompactar e copiar os arquivos na pasta de dados do seu MT5. Arquivos indicator na pasta MQL5 - Indicator. Baixe também a Media Movel totalmente gratis: https://www.mql5.com/pt/market/product/50400 Esse Indicador é para a próxima vela. Apareceu a seta, só aguardar a próx
Titan Backup
Elies Noah Siebenpfeiffer
Einführung in Titan Backup : Sind Sie bereit, Ihr Trading auf das nächste Level zu heben, mit einem automatisierten System, das Präzision und Flexibilität vereint? Lernen Sie Titan Backup kennen – Ihren persönlichen Trading-Assistenten, der darauf ausgelegt ist, profitreiche Breakouts durch das Erkennen von Akkumulationszonen zu nutzen. Dieser leistungsstarke Expert Advisor (EA) ist ideal für hochvolatile Märkte wie den Nasdaq 100 und den Crypto 10 geeignet und bietet sowohl vollautomatisierte a
Moving pivot Average Fibonacci The  indicator compares the selected period with its counterpart from the previous period. The indicator determines the moving Fibonacci levels for the day or any time interval to assess the price movement range from the time average. The indicator helps predict the expected high or low for the day based on historical time data. The pivot line can be considered an average trend line and use it in a variety of trading strategies. If you have any question about the
Product Description: Adaptive Y-Axis Scaling is a powerful MT5 indicator designed to enhance your trading experience by providing precise control over the Y-axis (price) scaling of your charts. This innovative tool allows you to customize the price scaling by specifying the number of pips from the visible chart's highs and lows. The calculated price range from this input is then used to set the maximum and minimum prices for the open chart, ensuring an optimized and comprehensive view of market
FREE
Expert Market Edge is scalping, trending, reversal indicator, with alerts . You can use it all and fit with your strategy whatever it fits you. My recommendation is to combine with my Colored RSI , and when 2 signals are matched, and pointing same direction (for example buy on this indicator, and green on RSI, you can take a long position, stop loss should be last local low, if you want to be more conservative, add ATR. ) you can take position. If you using moving averages, that's even better i
DYJ WITHDRAWAL PLAN: Ein professionelles Handelssystem für Trendwenden   1. Was ist DYJ WITHDRAWAL PLAN? DYJ WITHDRAWAL PLAN   ist ein   intelligentes Handelssystem , das automatisch   Positionen eröffnet und schließt , sobald eine Trendwende im Markt erkannt wird. Das System eignet sich für   alle Handelsinstrumente   und   alle Broker , egal ob   Forex (Devisen)   oder   synthetische Indizes   – der Einsatz ist jederzeit flexibel möglich. ️   2. Die wichtigsten Funktionen im Überblic
Highest High and Lowest Low (HH_LL) Indicator Description: The HH_LL Indicator is a trading tool designed to help traders identify key market points by automatically drawing Higher High (HH) and Lower Low (LL) lines across multiple timeframes. This indicator allows traders to easily spot significant levels on the chart, facilitating more accurate trading decisions. Key Features: Multi-Timeframe Analysis: The indicator supports various timeframes, including M30, H1, and H4. This enables traders t
FREE
Description of the Indicator Trend Stop shows the highest/lowest value of the last N periods. Can help traders identify the trend direction and potential stop levels.    Use Trend Stop indicator to detects the trend direction. Downtrend if the price crosses the Trend Stop line upwards  Uptrend if the price crosses the Trend Stop line downwards  Use Trend Stop indicator to  define  optimal stop levels. Downtrend Place your stops  above the Trend Stop line Uptrend Place your stops below the Tren
MasterCharts
Alexander Berger
You can think of these indicators as moving pivot points. MasterChartsTrading Price Action Indicators show good price levels to enter or exit a trade. The Blue indicator line serves as a Bullish Trend setter. If your instrument closes above the Blue line, we think about going Long (buying). When your trading instrument closes below the Red line, we think about Shorting (selling). It is very easy to read price action if you have a reference point. These support/resistance lines are there to help
NTL Pivot Lines
Northen Trading Labs
Pivot Lines (PL) User Guide Overview and Features The Pivot Lines Indicator (PL) provides traders with a powerful tool for identifying potential support and resistance levels based on well-established pivot point calculation methods. By offering insights into possible price turning points, this indicator helps traders make more informed trading decisions and refine their entry and exit strategies. With customizable settings for different timeframes and calculation methods, PL is versatile and a
Introduction to Harmonic Pattern Scenario Planner The present state of Forex market can go through many different possible price paths to reach its future destination. Future is dynamic. Therefore, planning your trade with possible future scenario is an important step for your success. To meet such a powerful concept, we introduce the Harmonic Pattern Scenario Planner, the first predictive Harmonic Pattern Tool in the world among its kind. Main Features Predicting future patterns for scenario
Ric
Sabina Fik
With this indicator, you can   predict future price behavior   for a certain number of bars ahead, giving you the ability to anticipate market dynamics. The indicator draws a   forecast line , which models potential future price values based on sophisticated algorithms analyzing past data. This information can be leveraged not only for market entry and exit decisions but also for setting or adjusting stop-loss levels to better manage your positions. Application of the Forecast The data provided
Zigzag X Fibo
Ian David Emmanuel Bello
The ZigZag indicator's main objective is to highlight significant price movements by filtering out minor price fluctuations. It enables the visualization of trends by eliminating market "noise," which can assist traders in making more informed decisions. Adding the Fibonacci indicator, which is a powerful tool for identifying potential support and resistance levels in financial markets.
Portfolio Evolution
Salvatore Caligiuri
PRODUCT LAUNCH PROMO  - Only for first 10 buyers, DYNAMIC PORTFOLIO  expert advisor as gift in additional to this special price! Copies left: 3 - Next price: 399$ - Final price: 1500$ LIVE RUSULTS:   click here Portfolio EVOLUTION represents a cutting-edge Expert Advisor concept that utilizes a range of strategies across multiple currency pairs. It can be operated in a MULTICURRENCIES mode or in SINGLE PAIR mode, creating an extensive multi-strategy portfolio designed to achieve safe and ste
mql4 version:  https://www.mql5.com/en/market/product/44606   Simple indicator to calculate profit on fibonacci retracement levels with fixed lot size, or calculate lot size on fibonacci levels with fixed profit. Add to chart and move trend line to set the fibonacci retracement levels. Works similar as default fibonacci retracement line study in Metatrader. Inputs Fixed  - select what value will be fix, lot or profit Fixed value  - value that will be fix on all levels Levels  - levels for which
Aliens dougkang de moviles
Cesar Juan Flores Navarro
Tomamos 5 medios móviles las unimos en una la cual suavizamos y volvemos a suavizar, resultando un mega suavizador de medios móviles suavizadas. Indicador de mql5 funciona en cualquier broker y para todos los tiempos, siendo el mas optimo el de 5, 15 a mas. Funciona mejor en grupo consigo misma osea poner uno de 14 y otro de 50 y 400,, así se observa mejor su desempeño.
The TMA Centered Bands Indicator for MT5 draws bands on the chart and shows the overall price trend. It displays three bands - the lower and upper boundaries of the channel and the median.   The bands are made up of moving averages, and each of them has an MA period. The name TMA comes from triangular moving averages, as the indicator draws triangular bands.   The price will fluctuate between these ranges whenever the trend changes direction, thus creating entry and exit points.   How to trade
FREE
Käufer dieses Produkts erwarben auch
Quantum TrendPulse
Bogdan Ion Puscasu
5 (13)
Wir stellen   Quantum TrendPulse   vor, das ultimative Handelstool, das die Leistung von   SuperTrend   ,   RSI   und   Stochastic   in einem umfassenden Indikator vereint, um Ihr Handelspotenzial zu maximieren. Dieser Indikator wurde für Händler entwickelt, die Präzision und Effizienz suchen, und hilft Ihnen dabei, Markttrends, Momentumverschiebungen und optimale Ein- und Ausstiegspunkte sicher zu erkennen. Hauptmerkmale: SuperTrend-Integration:   Folgen Sie problemlos dem vorherrschenden Markt
TPSpro RFI Levels MT5
Roman Podpora
4.55 (20)
Umkehrzonen / Spitzenvolumina / Aktive Zonen eines Hauptakteurs = TS TPSPROSYSTEM ANLEITUNG RUS    /    ANWEISUNGEN     ENG          /          Version MT4      Jeder Käufer dieses Indikators erhält zusätzlich KOSTENLOS: 6 Monate Zugriff auf Handelssignale vom Dienst RFI SIGNALS – vorgefertigte Einstiegspunkte gemäß dem TPSproSYSTEM-Algorithmus. Schulungsmaterialien mit regelmäßigen Updates – tauchen Sie in die Strategie ein und steigern Sie Ihr berufliches Niveau. 24/5-Support an Wochentagen u
RelicusRoad Pro MT5
Relicus LLC
4.79 (19)
Jetzt 147 US -Dollar (nach ein paar Aktualisierungen auf 499 US -Dollar) - Unbegrenzte Konten (PCs oder MACs) RelicusRoad Benutzerhandbuch + Schulungsvideos + Zugang zur privaten Discord-Gruppe + VIP-Status EINE NEUE ART, DEN MARKT ZU BETRACHTEN RelicusRoad ist der weltweit leistungsstärkste Handelsindikator für Forex, Futures, Kryptowährungen, Aktien und Indizes und gibt Händlern alle Informationen und Tools, die sie benötigen, um profitabel zu bleiben. Wir bieten technische Analysen und Ha
MonetTrend — Премиум-индикатор для торговли по тренду (M30, H1, H4) MonetTrend — это мощный и визуально понятный трендовый индикатор, созданный для торговли на таймфреймах M30, H1 и H4. Он идеально подходит для работы с волатильными инструментами, такими как: • Золото (XAUUSD) • Криптовалюты (BTCUSD) • Валютные пары (EURUSD, USDJPY и др.) Ключевые особенности MonetTrend: • Автоматическое отображение Take Profit 1 (TP1) и Stop Loss (SL): После появления сигнала индикатор сразу показывает: • TP
Dies ist wahrscheinlich der vollständigste Indikator für die automatische Erkennung der harmonischen Preisbildung, den Sie für die MetaTrader-Plattform finden können. Es erkennt 19 verschiedene Muster, nimmt Fibonacci-Projektionen genauso ernst wie Sie, zeigt die potenzielle Umkehrzone (PRZ) an und findet geeignete Stop-Loss- und Take-Profit-Werte. [ Installationsanleitung | Update-Anleitung | Fehlerbehebung | FAQ | Alle Produkte ] Es erkennt 19 verschiedene harmonische Preisbildungen Darges
MONEYTRON – ТВОЙ ЛИЧНЫЙ СИГНАЛ НА УСПЕХ! XAUUSD | AUDUSD | USDJPY | BTCUSD Поддержка таймфреймов: M5, M15, M30, H1 Почему трейдеры выбирают Moneytron? 82% успешных сделок — это не просто цифры, это результат продуманной логики, точного алгоритма и настоящей силы анализа. Автоматические сигналы на вход — не нужно гадать: когда покупать, когда продавать. 3 уровня Take Profit — ты сам выбираешь свой уровень прибыли: безопасный, уверенный или максимум. Четкий Stop Loss — контролируешь риск
Blahtech Supply Demand MT5
Blahtech Limited
4.54 (13)
Was: $299  Now: $149  Supply Demand uses previous price action to identify potential imbalances between buyers and sellers. The key is to identify the better odds zones, not just the untouched ones. Blahtech Supply Demand indicator delivers functionality previously unavailable on any trading platform. This 4-in-1 indicator not only highlights the higher probability zones using a multi-criteria strength engine, but also combines it with multi-timeframe trend analysis, previously confirmed swings
Elliott Wave Trend was designed for the scientific wave counting. This tool focuses to get rid of the vagueness of the classic Elliott Wave Counting using the guideline from the template and pattern approach. In doing so, firstly Elliott Wave Trend offers the template for your wave counting. Secondly, it offers Wave Structural Score to assist to identify accurate wave formation. It offers both impulse wave Structural Score and corrective wave Structure Score. Structural Score is the rating to sh
MTF Supply Demand Zones MT5
Georgios Kalomoiropoulos
5 (1)
Automatisierte Angebots- und Nachfragezonen der nächsten Generation. Neuer und innovativer Algorithmus, der bei jedem Diagramm funktioniert. Alle Zonen werden dynamisch entsprechend der Preisbewegung des Marktes erstellt. ZWEI ARTEN VON WARNUNGEN --> 1) WENN DER PREIS EINE ZONE ERREICHT 2) WENN EINE NEUE ZONE BILDET WIRD Sie erhalten keinen weiteren nutzlosen Indikator. Sie erhalten eine vollständige Handelsstrategie mit nachgewiesenen Ergebnissen.     Neue Eigenschaften:     Warnungen, w
IQ Gold Gann Levels a non-repainting, precision tool designed exclusively for XAUUSD/Gold intraday trading. It uses W.D. Gann’s square root method to plot real-time support and resistance levels, helping traders spot high-probability entries with confidence and clarity. William Delbert Gann (W.D. Gann) was an exceptional market analyst, whose trading technique was based on a complex blend of mathematics, geometry, astrology, and ancient mathematics which proved to be extremely accurate. Download
Spot the Trend. Read the Pattern. Time the Entry. 3 Steps in Under 30 Seconds! Trade effortlessly — no analysis required, Your smart assistant is ready to simplify your workflow No more chart overload. Trade with confidence using smart bias detection. Compatible with all currencies, crypto, stocks, metals, indices, and any timeframe. Just click and execute — it’s that simple. Deal for busy traders who want speed and clarity. TPTSyncX is a powerful all-in-one MetaTrader 5 indicator that seamless
MetaForecast M5
Vahidreza Heidar Gholami
5 (3)
MetaForecast prognostiziert und visualisiert die Zukunft eines beliebigen Marktes basierend auf den Harmonien in den Preisdaten. Obwohl der Markt nicht immer vorhersehbar ist, kann MetaForecast, wenn es ein Muster im Preis gibt, die Zukunft so genau wie möglich voraussagen. Im Vergleich zu ähnlichen Produkten kann MetaForecast durch die Analyse von Markttrends genauere Ergebnisse erzeugen. Eingabeparameter Past size (Vergangene Größe) Gibt an, wie viele Balken MetaForecast verwendet, um ein Mod
Volume by Price MT5
Brian Collard
3.25 (4)
Volume Profile, Footprint and Market Profile TPO (Time Price Opportunity). Volume and TPO histogram bar and line charts. Volume Footprint charts. TPO letter and block marker collapsed and split structure charts. Static, dynamic and flexible range segmentation and compositing methods with relative and absolute visualizations. Session hours filtering and segment concatenation with Market Watch and custom user specifications. Graphical layering, positioning and styling options to suit the user's a
FxaccurateLS
Shiv Raj Kumawat
WHY IS OUR FXACCCURATE LS MT5 THE PROFITABLE ? PROTECT YOUR CAPITAL WITH RISK MANAGEMENT Gives entry, stop and target levels from time to time. It finds Trading opportunities by analyzing what the price is doing during established trends. POWERFUL INDICATOR FOR A RELIABLE STRATEGIES We have made these indicators with a lot of years of hard work. It is made at a very advanced level. Established trends provide dozens of trading opportunities, but most trend indicators completely ignore them! The
CBT Quantum Maverick Hocheffizientes Binäroptionshandelssystem CBT Quantum Maverick ist ein leistungsstarkes Handelssystem für Binäroptionen, das für Händler entwickelt wurde, die Präzision, Einfachheit und diszipliniertes Handeln suchen. Keine Anpassung erforderlich – das System ist von Anfang an optimiert. Mit etwas Übung sind die Signale leicht zu beherrschen. Hauptmerkmale: Präzise Signale: Handelssignale basierend auf der aktuellen Kerze, die auf die nächste Kerze abzielen, ohne häufige N
IVISTscalp5
Vadym Zhukovskyi
5 (6)
Wir stellen Ihnen den iVISTscalp5-Indikator vor, der nicht nur einzigartig, sondern auch effektiv im Handel ist. Dieser Indikator basiert auf Zeitdaten und ist das Ergebnis jahrelanger Erfahrung und eingehender Analyse der Finanzmärkte. Der iVISTscalp5-Indikator ist ein ausgezeichnetes Werkzeug für manuellen Handel. Bequemlichkeit, Einfachheit und Visualisierung - die gesamte Komplexität ist verborgen. Wir haben die Einstellungen und Verwendung des iVISTscalp5-Indikators auf das Maximum vereinfa
Der Precision Index Oscillator (Pi-Osc) von Roger Medcalf von Precision Trading Systems Version 2 wurde sorgfältig neu codiert, um extrem schnell auf Ihrem Chart geladen zu werden, und es wurden einige andere technische Verbesserungen eingearbeitet, um die Erfahrung zu verbessern. Pi-Osc wurde entwickelt, um genaue Handelstimingsignale bereitzustellen, die darauf abzielen, extreme Erschöpfungspunkte zu finden, an die die Märkte gezwungen werden, um einfach die Stops aller herauszunehmen. Die
The   Time_Price_SQ9_Degree   indicator is based on the 9 Gann square. Using this indicator, you can identify strong time and price zones. The indicator displays the levels as a degree value. The degrees can be set in the settings. After launching, the MENU button appears. If it is highlighted, it can be moved to any point on the graph, and after double-clicking on it, it stops being highlighted and menu buttons appear. To hide the menu, just double-click on the button, it will become highlight
Wir stellen vor       Quantum Breakout PRO   , der bahnbrechende MQL5-Indikator, der die Art und Weise, wie Sie mit Breakout-Zonen handeln, verändert! Entwickelt von einem Team erfahrener Händler mit über 13 Jahren Handelserfahrung,       Quantum Breakout PRO       ist darauf ausgelegt, Ihre Handelsreise mit seiner innovativen und dynamischen Breakout-Zone-Strategie auf ein neues Niveau zu heben. Der Quantum Breakout Indicator zeigt Ihnen Signalpfeile auf Breakout-Zonen mit 5 Gewinnzielzonen u
BESCHREIBUNG ICSM (Impulse-Correction SCOB Mapper) ist ein Indikator, der die Preisbewegung analysiert und gültige Impulse, Korrekturen und SCOBs (Single Candle Order Block) identifiziert. Es ist ein leistungsstarkes Werkzeug, das mit jeder Art von technischer Analyse verwendet werden kann, da es flexibel, informativ und einfach zu bedienen ist und das Bewusstsein des Händlers für die liquidesten Interessenzonen erheblich verbessert. EINSTELLUNGEN Allgemein | Visuals Farbthema — definiert d
Suchen Sie nach einem leistungsstarken Indikator für den Devisenhandel, der Ihnen dabei helfen kann, profitable Handelsmöglichkeiten mit Leichtigkeit zu erkennen? Suchen Sie nicht weiter als das Beast Super Signal. Dieser benutzerfreundliche trendbasierte Indikator überwacht kontinuierlich die Marktbedingungen, sucht nach neuen sich entwickelnden Trends oder springt auf bestehende Trends ein. Das Beast Super Signal gibt ein Kauf- oder Verkaufssignal, wenn alle internen Strategien aufeinander abg
Der Forex TPA Indikator deckt die wahren Aktionen der Marktmacher auf, immer dann wenn sie passieren. "Kämpfe nicht gegen die Marktmacher an, sondern folge ihnen", ist wohl der beste Rat, den ein Trader bekommen kann. Der TPA Indikator zeigt jedesmal seine Signale an wenn die Bullen definitiv stärker sind als die Bären und umgekehrt. Dieser Indikator wurde VON Tradern FÜR Trader gemacht und ist 100% NICHT NACHZEICHNEND! Signale werden STRENG am Schluss einer Kerze  generiert. Das sagen unsere Ku
AT Forex Indicator MT5
Marzena Maria Szmit
5 (5)
The AT Forex Indicator MT5 is a sophisticated trading tool designed to provide traders with a comprehensive analysis of multiple currency pairs. This powerful indicator simplifies the complex nature of the forex market, making it accessible for both novice and experienced traders. AT Forex Indicator uses advanced algorithms to detect trends, patterns and is an essential tool for traders aiming to enhance their forex trading performance. With its robust features, ease of use, and reliable signal
[ MT4 Version ]  [ Order Blocks ]  [ Kill Zones ]  [ SMT Divergences ] How to trade using Order Blocks :  Click here User Interface Performance:  During testing in the strategy tester, the UI may experience lag. Rest assured, this issue is specific to the testing environment and does not affect the indicator's performance in live trading. Elevate your trading strategy with the  Order Blocks ICT Multi TF  indicator, a cutting-edge tool designed to enhance your trading decisions through advanced o
[ MT4 Version ]  [ Kill Zones ]  [ SMT Divergences ] How to trade using Order Blocks:  Click here User Interface Performance:  During testing in the strategy tester, the UI may experience lag. Rest assured, this issue is specific to the testing environment and does not affect the indicator's performance in live trading. Elevate your trading strategy with the  Order Blocks ICT Multi TF  indicator, a cutting-edge tool designed to enhance your trading decisions through advanced order block analysis
Was: $249  Now: $149   Market Profile defines a number of day types that can help the trader to determine market behaviour. A key feature is the Value Area, representing the range of price action where 70% of trading took place. Understanding the Value Area can give traders valuable insight into market direction and establish the higher odds trade. It is an excellent addition to any system you may be using. Inspired by Jim Dalton’s book “Mind Over Markets”, this indicator is designed to suit the
MT4 Version SMT Divergences MT5 SMT Divergences is one of the most innovative indicators in the market. It offers the possibility of analyzing price divergences between 2 pairs. These divergences highlight and help to foresee what banks and institutions are planning to do. SMT divergences also provides you with a kill zones indicator and the possibility of filtering divergences occurring during these kill zones.  This indicator is specially powerful if applied in 2 highly correlated pairs. A pri
[ MT4 Version ] Are you tired of spending months on demo or live accounts to test your trading strategies? The Backtesting Simulator is the ultimate tool designed to elevate your backtesting experience to new heights. Utilizing Metatrader historical symbol information, it offers an unparalleled simulation of real market conditions. Take control of your testing speed, test ideas quickly or at a slower pace, and witness remarkable improvements in your testing performance. Forget about wasting tim
The Naveen Dynamic Square  MT5  is one of the best known  technical analysis tools  inspired  by WD Gann along with the Gann Fan and Gann Box. It is considered a cornerstone of his trading technique that is based on time and price symmetry. The Naveen Dynamic Square MT5   is a powerful tool in finance for determining support and resistance levels based on a stock's extreme price points. It works by extrapolating probable price levels from a central value, typically an all-time or cyclical high o
VolumeProfile MT5
Robert Hess
4.14 (7)
Beschreibung: Das Volumen Profil zeigt detailierte Informationen von historischen trading Aktivitäten in bestimmten Preisbereichen (Markt Profil/Preis Profil).  Damit finden Sie die Zonen mit den besten Preisen im Markt und erlangen so einen entscheidenen Vorteil gegenüber anderen Marktteilnehmern. Features: Anpassbares Volume Profil / Markt Profil Zeigt den "fairen" Preisbereich in dem 70% des gesamten Volumens umgesetzt werden Zeigt kritische Zonen mit niedrigem Volumen Zeigt Volume Point of
Weitere Produkte dieses Autors
Volatility Trend System – ein Handelssystem, das Signale für Einstiege gibt. Das Volatilitätssystem liefert lineare und punktuelle Signale in Richtung des Trends sowie Signale zum Verlassen des Trends, ohne Neuzeichnung und Verzögerungen. Der Trendindikator überwacht die Richtung des mittelfristigen Trends, zeigt die Richtung und deren Änderung an. Der Signalindikator basiert auf Änderungen der Volatilität und zeigt Markteintritte an. Der Indikator ist mit mehreren Arten von Warnungen ausgestat
Zyklischer Indikator für den Handel und die Prognose der Marktrichtung. Zeigt das zyklische Verhalten des Preises in Form eines Oszillators. Gibt Signale für die Eröffnung von Trades aus, wenn es eine Erholung von der Ober- und Untergrenze des Oszillators gibt. In Form eines Histogramms zeigt es die geglättete Stärke des Trends.  Ergänzt jede Handelsstrategie, vom Scalping bis zum Intraday.  Der Indikator wird nicht neu gezeichnet.  Geeignet für den Einsatz auf allen Symbolen/Instrumenten.  Gee
Trendindikatoren sind einer der Bereiche der technischen Analyse und werden im Handel an Finanzmärkten eingesetzt. Angular Trend Lines -Indikator – bestimmt umfassend die Trendrichtung und generiert Einstiegssignale. Neben der Glättung der durchschnittlichen Richtung der Kerzen Dabei wird auch der Neigungswinkel von Trendlinien genutzt. Für den Neigungswinkel wurde das Prinzip der Konstruktion von Gann-Winkeln zugrunde gelegt. Der Indikator für die technische Analyse kombiniert Candlestick-Glätt
Level Breakout Indicator ist ein technisches Analyseprodukt, das anhand oberer und unterer Grenzen arbeitet und die Richtung des Trends bestimmen kann. Funktioniert bei Kerze 0 ohne Neuzeichnen oder Verzögerungen. Bei seiner Arbeit verwendet es ein System verschiedener Indikatoren, deren Parameter bereits konfiguriert und zu einem einzigen Parameter zusammengefasst wurden – „ Scale “, der die Abstufung der Perioden vornimmt. Der Indikator ist einfach zu verwenden und erfordert keine Berechnungen
Arrow Micro Scalper ist ein Indikator für Scalping und kurzfristigen Handel, der in alle Diagramme und Finanzinstrumente (Währungen, Kryptowährungen, Aktien, Metalle) integriert werden kann. In ihrer Arbeit verwendet sie Wellenanalyse und einen Trendrichtungsfilter. Empfohlen für die Verwendung in Zeitrahmen von M1 bis H4. So arbeiten Sie mit dem Indikator. Der Indikator enthält 2 externe Parameter zum Ändern von Einstellungen, der Rest ist standardmäßig bereits konfiguriert. Große Pfeile zeig
Ein technischer Indikator, der Diagramme strukturiert und zyklische Preisbewegungen identifiziert. Kann mit allen Diagrammen funktionieren. Mehrere Arten von Benachrichtigungen. Auf dem Diagramm selbst befinden sich zusätzliche Pfeile. Ohne erneutes Zeichnen der Historie wird beim Schließen der Kerze gearbeitet. Empfohlener TF ab M5. Einfach zu verwenden und Parameter zu konfigurieren. Wenn Sie 2 Indikatoren mit unterschiedlichen Parametern verwenden, können Sie diese ohne andere Indikatoren ve
Point Trend Indicator – Ein Indikator für das obere und untere Niveau des Trends, der die Trendrichtung bestimmen und seine Verstärkung anzeigen kann. Die Trendrichtung wird durch runde Punkte bestimmt; liegen die Punkte über der Nulllinie, ist der Trend bullisch, liegen sie darunter, ist der Trend bärisch. Die Zunahme der Richtungsbewegung wird durch Pfeile angezeigt. Es gibt den einzigen Parameter zur manuellen Anpassung – die Dauer der Trendrichtung.   Möglichkeiten Funktioniert in allen Zei
An indicator that determines the point levels of price resistance. The arrows indicate price bounces in the indicated directions. Arrows are not redrawn formed on the current candle, shown on the previous candle for convenience.      It has one setting - the formation intensity: If the parameter is smaller, most of the signals are formed in a wide trend. If the parameter is larger, signals are formed in a narrower trend. Input parameters Formation Intensity - Arrow Formation Intensity Number B
Line Breakouts – System für den Trendhandel. Enthält eine Trendkennung, die mithilfe der Perioden- und Glättungsfunktion an jedes Diagramm und Handelsinstrument angepasst werden kann. Und ein bestimmender Faktor für die Unterstützungs- und Widerstandsniveaus. Wenn der Preis unter der Widerstandslinie liegt, eröffnen Sie Verkaufsgeschäfte, und wenn der Preis über der Unterstützungslinie liegt, eröffnen Sie Kaufgeschäfte. Der Stop-Loss sollte einige Punkte von den Linien entfernt platziert werden.
Arrow indicator with trend filter. Generates trend input without delays or delays - on the emerging candle. Suitable for use on any trading tools and timeframes. Easy to use, contains the direction of the trend in the form of a histogram lines and signal generator. Input parameters Period Trend Line - Period of the Histogram Line Signal Generator Period - If the period is longer, then the arrows are less Play sound Display pop-up message Send push notification Send email Sound file signal - Fi
Indikator für manuellen Handel und technische Analyse für Forex. Es besteht aus einem Trendindikator mit dem Eröffnungsniveau des Handelstages und einem Pfeilindikator zur Bestimmung von Einstiegspunkten. Der Indikator ändert seine Farbe nicht; er funktioniert, wenn die Kerze schließt. Enthält verschiedene Arten von Warnungen für Signalpfeile. Kann für die Arbeit mit jedem Diagramm, Handelsinstrument oder Zeitrahmen konfiguriert werden. Die Arbeitsstrategie basiert auf der Suche nach Preisbewe
A trend indicator showing the strength of bulls and bears in a trading range. Consists of two lines: The green line is a balanced overbought/oversold condition. The red line is the direction of trading activity. Does not redraw calculations. Can be used on all Symbols/Instruments/Time Frames. Easy to use and set up. How to use the indicator and what it determines. The basic rule is to follow the direction of the red line: if it crosses the green line from the bottom up, the market is dominat
FREE
Lines Channel Pro
Vitalyi Belyh
5 (1)
The "Lines Channel Pro" indicator determines price reversals from the High/Low channel. Contains a built-in trend finder, signal lines, entry and exit points. The recommended timeframe for M15 to work is D1. For each timeframe and trading instrument, depending on the volatility, it is necessary to select individual settings. Does not redraw calculations. Input parameters Use Channel trend filter - Turn on/off the trend filter Channel trend period - Trend filter period (from 8 and above) Line
Der Indikator „ ZigZag on Trend “ ist ein Assistent zur Bestimmung der Richtung der Preisbewegung sowie ein Balken- und Pip-Rechner. Es besteht aus einem Trendindikator, der die Richtung des Preises anhand einer Trendlinie in Form eines Zickzacks überwacht, und einem Zähler, der die Anzahl der in Trendrichtung durchlaufenen Balken und die Anzahl der Punkte auf einer vertikalen Skala berechnet. (Berechnungen werden bei der Eröffnung des Balkens durchgeführt) Der Indikator wird nicht neu gezeichne
Channel Cluster
Vitalyi Belyh
5 (1)
Cluster indicator working in the price channel. For operation, the indicator builds a channel line - (dashed line). Inside the channel, cluster sections are determined that determine the direction of the price movement - (histograms in two directions), start with large arrows. Small arrows are plotted above / below each histogram - indicator increase volatility. The indicator does not redraw the values. Works on any tools and timeframes. Entrances are made when large arrows appear, inside small
Oscillatory price direction indicator for Forex. It has 2 operating modes - trend and scalping. The trend mode of operation allows you to determine the direction of the market movement in the medium term. The scalping mode works by determining the price movement in the short term. Consists of a blue line, from which the balance between the directions of the price and signal green / red line. The green line shows the direction of the price up, and the red line shows the direction of the price dow
Zig-Zag indicator with additional signals for inputs. Visually easy to use: The red zig-zag line is an uptrend. The blue zig-zag line is a downward trend. Arrows in the form of additional signals. Works on any trading pairs. On any timeframe. Not redrawn. Input parameters Zig-Zag Period - Zig-zag period (from 5) Signal Period - period of signal arrows (from 3) Alerts for signals Play sound - Sound alert Display pop-up message - Notification by message on the screen Send push notification
A technical indicator that calculates its readings based on trading volumes. It has an oscillatory line that follows the change in volumes. Large arrows on the line indicate reversal values. A channel is built around the line with small arrows showing the strengthening of price movement in the direction of increasing volumes. The indicator does not redraw values. Works on any instrument and timeframe. It can complement any trading strategy by finding a trend or make entries in the direction of a
This indicator is based on a trend guide line and a special oscillator, defining entry points at the moments of potential price movement. The indicator does not redraw. Works on any instrument. The most preferred time frames to use are M5, M15, M30, H1, H4. The guide trend line of the indicator gives an idea about the movement of the market. When the green line crosses the zero level from top to bottom - the market is bearish when it crosses from bottom to top - bull market. The oscillator is
Developed methods for trading collected in one indicator. In the form of arrows, it defines entries in the direction of the trend. It has 2 types of arrows - trend and signal guides, informing about the potential movement in the direction of the trend. Works without redrawing, ready for use on all symbols/tools. The most suitable time frames to use are M15, M30, H1, H4. How to use The indicator finds the direction of the trend in the form of a signal arrow, a graphic rectangle stretches along
Max Min Reversal Arrows - an arrow reversal indicator for predicting price movement. The indicator is built on the support and resistance levels at the local lows and highs of the price. Product features Arrows appear on the current candle. The indicator does not redraw. Can be used on all time frames and trading instruments. Recommended timeframes to use M30, H1, H4. The dotted lines are the support and resistance levels within the signal. Price movement from these levels means a reversal. Pr
Scalping Entry Points - ist ein manuelles Handelssystem, das sich an Preisbewegungen anpassen und Signale für offene Geschäfte ohne Neuzeichnung geben kann. Der Indikator bestimmt die Richtung des Trends anhand des zentralen Unterstützungs- und Widerstandsniveaus. Der Punktindikator liefert Signale für Ein- und Ausstiege. Geeignet für manuellen Intraday-Handel, Scalping und binäre Optionen. Funktioniert für alle Zeitrahmen und Handelsinstrumente. Der Indikator gibt verschiedene Arten von Warnung
Indikator des Preiskanals und des darin enthaltenen Breakpoint-Generators. Es gibt einen Eindruck von der Lage des Preises im Verhältnis zur Nutzungsdauer. Es enthält geglättete Trend-Absprunglinien entlang der Kanalgrenzen und Absprungpunkte, die den Ein- und Ausstiegszeitpunkt bestimmen. Funktioniert mit verschiedenen Handelsinstrumenten und Zeitrahmen. So arbeiten Sie mit dem Indikator Folgen Sie der Kanalunterbrechungslinie. Die blaue Linie zeigt die oberen Eingänge, die rosa Linie die unt
Candle Binary Scalper ist ein technisches Analyseprodukt für Devisen und binäre Optionen. Enthält mehrere technische Indikatoren, die in einem Handelssystem zusammengefasst sind. Geeignet für den manuellen Handel innerhalb eines Trends, für Scalping und binäre Optionen. Funktioniert für alle Zeitrahmen und Handelsinstrumente. Empfohlene Zeitrahmen für den Handel M15, M30, H1 und H4, M5 und M1 sollten bei hoher Volatilität verwendet werden. Es gibt verschiedene Arten von Warnungen. So verwenden
Binary Lines ist ein technischer Analyseindikator für Währungen, Rohstoffe, Kryptowährungen, Aktien, Indizes und alle Finanzinstrumente. Kann für binäre Optionen oder Forex-Scalping verwendet werden. Zeigt Ein- und Ausstiegspunkte in festen Abständen an und stellt bereit Händlern die notwendigen Informationen über die Ergebnisse möglicher Transaktionen. Einstiegspunkte werden ganz am Anfang der Kerze in Richtung der MA-Linie und der Dauer gebildet Trades in Bars können manuell angepasst und an j
Ein technischer Indikator, der seine Messwerte anhand des Handelsvolumens berechnet. In Form eines Histogramms zeigt es die Akkumulation der Stärke der Bewegung des Handelsinstruments. Es verfügt über unabhängige Berechnungssysteme für bullische und bärische Richtungen. Funktioniert mit allen Handelsinstrumenten und Zeitrahmen. Kann jedes Handelssystem ergänzen. Der Indikator zeichnet seine Werte nicht neu, die Signale erscheinen auf der aktuellen Kerze. Es ist einfach zu bedienen, lädt das Diag
Candle Power Signals ist ein Trendindikator, der eine Strategie zur Suche nach potenziell volatilen Signalen verwendet, um Handelsentscheidungen zu treffen. Durch die Analyse des Marktes identifiziert der Indikator Zonen mit erhöhter und verringerter Volatilität innerhalb der Richtungstrendbewegung. Die wichtigsten Signalerzeugungsparameter wurden bereits konfiguriert, die restlichen Einstellungen und Zeiträume sind in 2 Parametern zur manuellen Konfiguration indiziert: 1. "Candle calculation m
Scalping and Binary Signal Detector – Scalping-Indikator, der Richtungssignale für Eröffnungspositionen entlang des Trends liefert. Der Indikator ist ein vollständiges Handelssystem, das für Forex und binäre Optionen verwendet werden kann. Das Algorithmensystem ermöglicht es Ihnen, starke Preisbewegungen in mehreren aufeinanderfolgenden Balken zu erkennen. Der Indikator bietet verschiedene Arten von Warnungen für Pfeile. Funktioniert mit allen Handelsinstrumenten und Zeitrahmen (M5 oder höher em
Level Breakout Indicator ist ein technisches Analyseprodukt, das anhand oberer und unterer Grenzen arbeitet und die Richtung des Trends bestimmen kann. Funktioniert bei Kerze 0 ohne Neuzeichnen oder Verzögerungen. Bei seiner Arbeit verwendet es ein System verschiedener Indikatoren, deren Parameter bereits konfiguriert und zu einem einzigen Parameter zusammengefasst wurden – „ Scale “, der die Abstufung der Perioden vornimmt. Der Indikator ist einfach zu verwenden und erfordert keine Berechnungen
Indicator Waiting Volatility – ein Indikator zur Bestimmung von Volatilitätszonen und flachen Bedingungen. Im Laufe der Zeit weist der Preis im Diagramm unterschiedliche Trends auf, sinkt, steigt oder bleibt gleich. Der Indikator hilft dem Händler zu bestimmen, in welchem ​​Trend sich der Preis befindet. Bei seiner Arbeit nutzt er mehrere Werkzeuge zur technischen Analyse: Zunächst wird die Richtung des Trends bestimmt, dann überwacht der Indikator in dieser Richtung Änderungen der Volatilität.
Auswahl:
Keine Bewertungen
Antwort auf eine Rezension