Short Intermediate Long Terms Low Indicator MT5
- Indikatoren
- Eda Kaya
- Version: 1.11
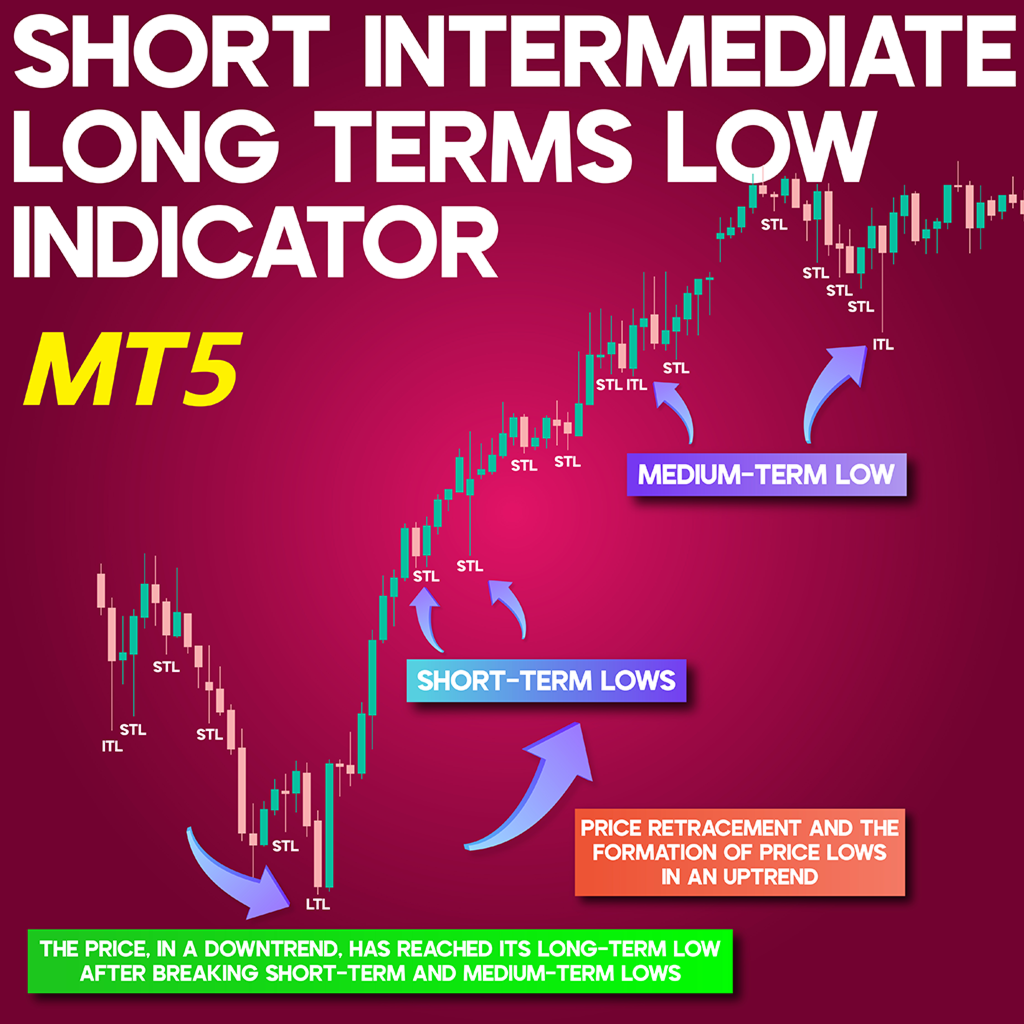
STL, ITL & LTL Indicator for MT5
The STL, ITL, and LTL indicators for MetaTrader 5 are specifically developed to detect Short-Term Lows (STL), Intermediate-Term Lows (ITL), and Long-Term Lows (LTL). Spotting these key lows manually can be quite challenging for traders.
This tool effectively highlights critical price lows that influence market trends, offering traders a broader perspective on price action.
Indicator Table
| Category | ICT - Liquidity - Trend Strength |
| Platform | MetaTrader 5 |
| Skill Level | Intermediate |
| Indicator Type | Continuation - Reversal |
| Time Frame | Multi-Timeframe |
| Trading Style | Intraday Trading |
| Markets | Cryptocurrency - Forex - Stocks |
Overview of the Indicator
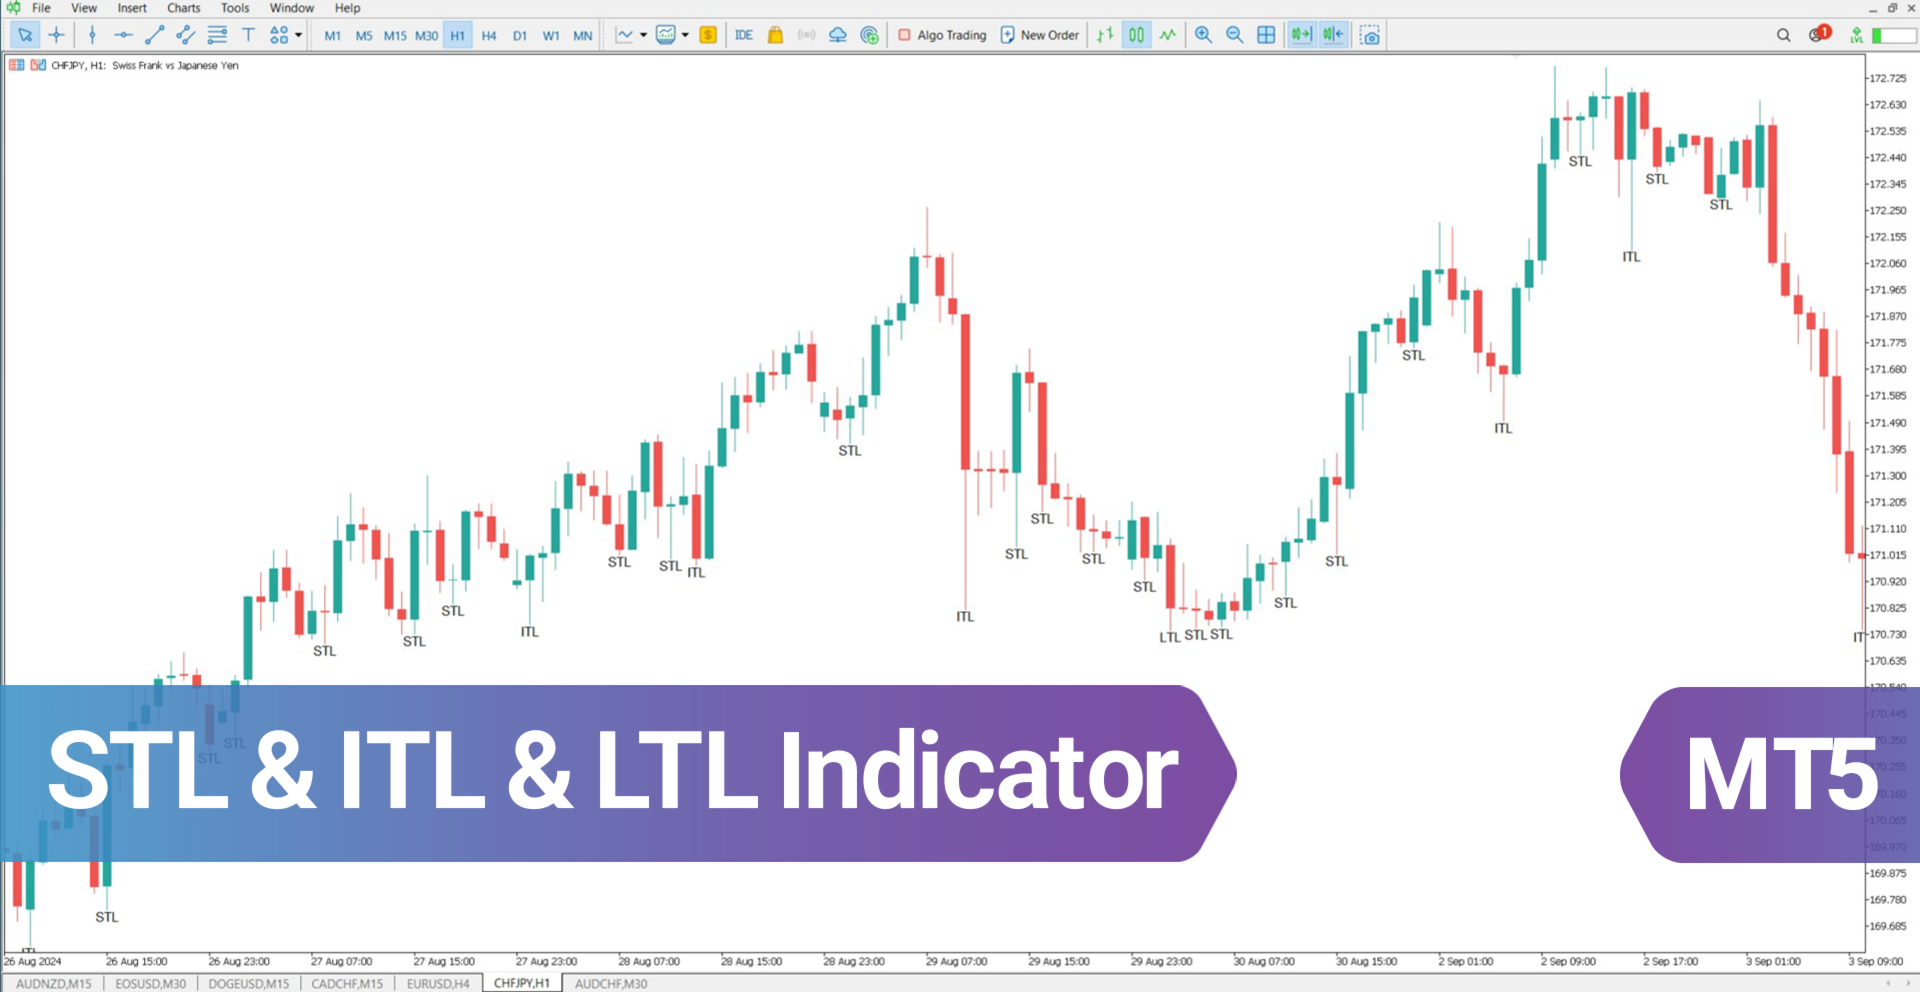
The indicator evaluates a sequence of three consecutive candles, marking the middle candle with the lowest low as a Short-Term Low (STL). Intermediate-Term Lows (ITL) are determined based on significant price movements observed in higher timeframes.
By identifying these levels, traders can better understand price trends and optimize trade execution while minimizing risk.
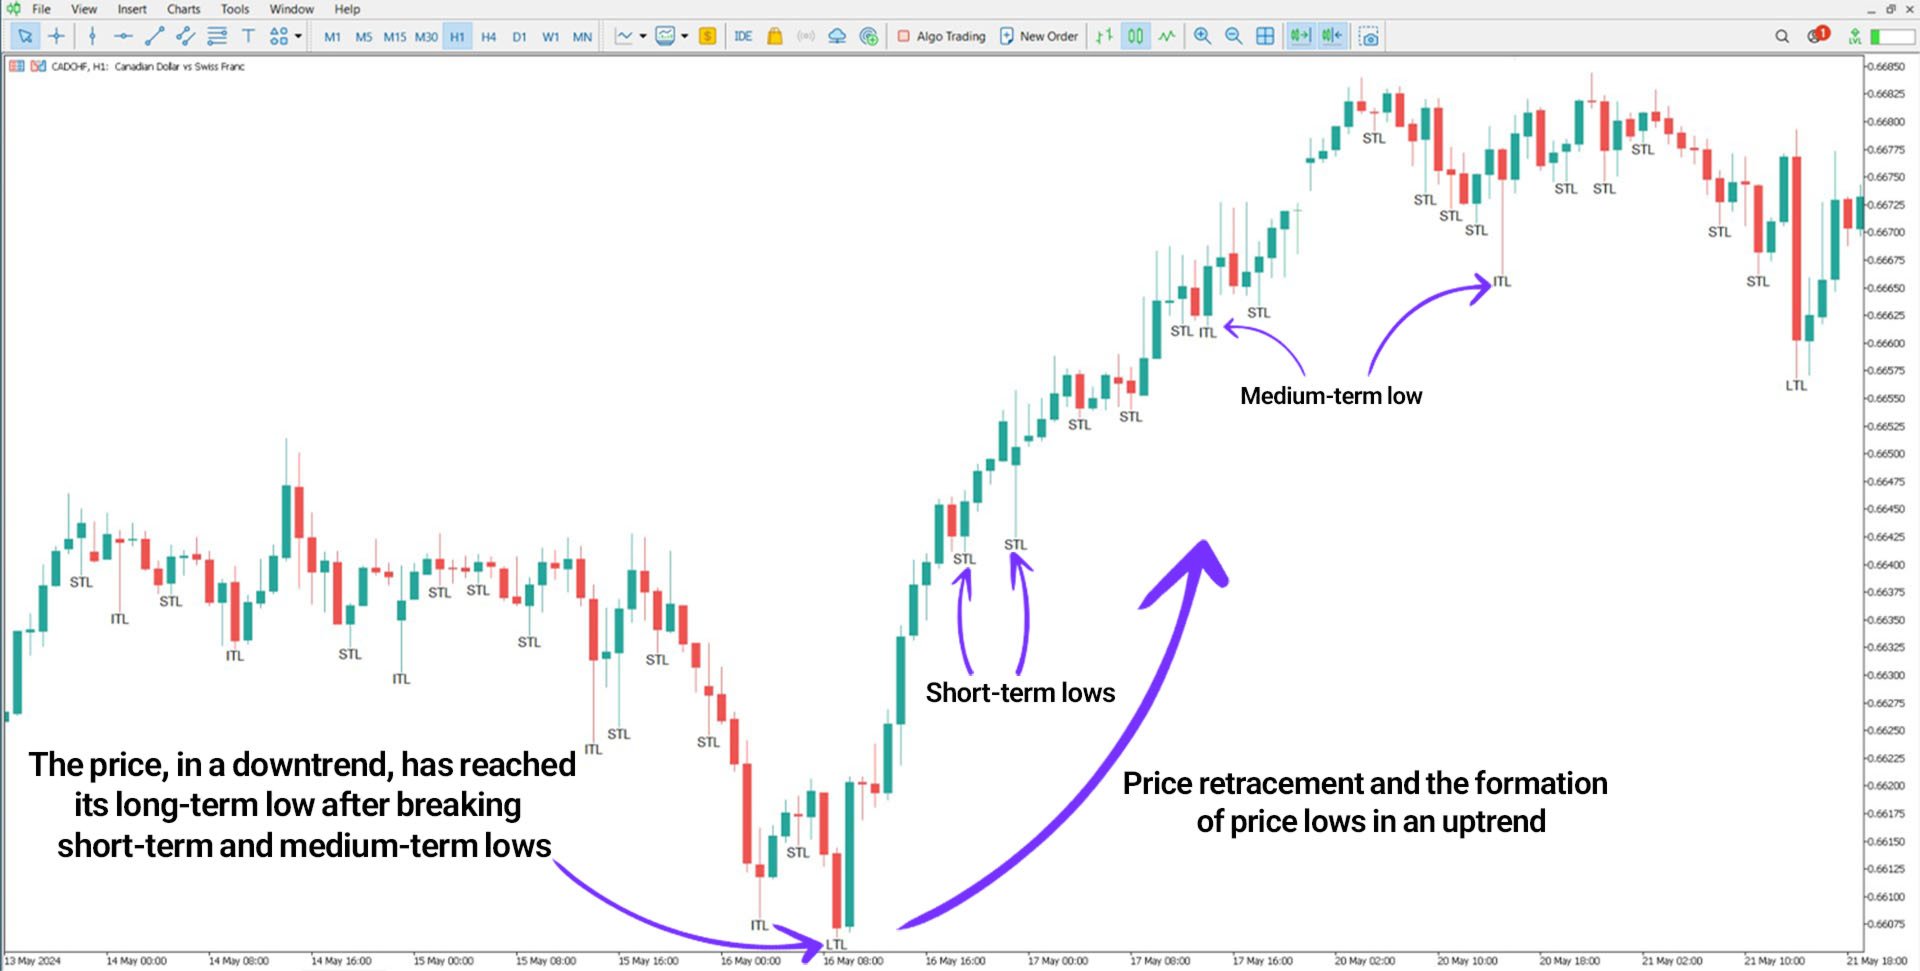
Indicator in an Uptrend
In the following CAD/CHF 1-hour chart, the price moves downward after breaking Short-Term Lows (STL) and Intermediate-Term Lows (ITL), eventually reaching the Long-Term Low (LTL). At this point, a reversal to the upside takes place.
Traders looking for long entries may position their stop-loss orders below the Long-Term Low (LTL) for added security.
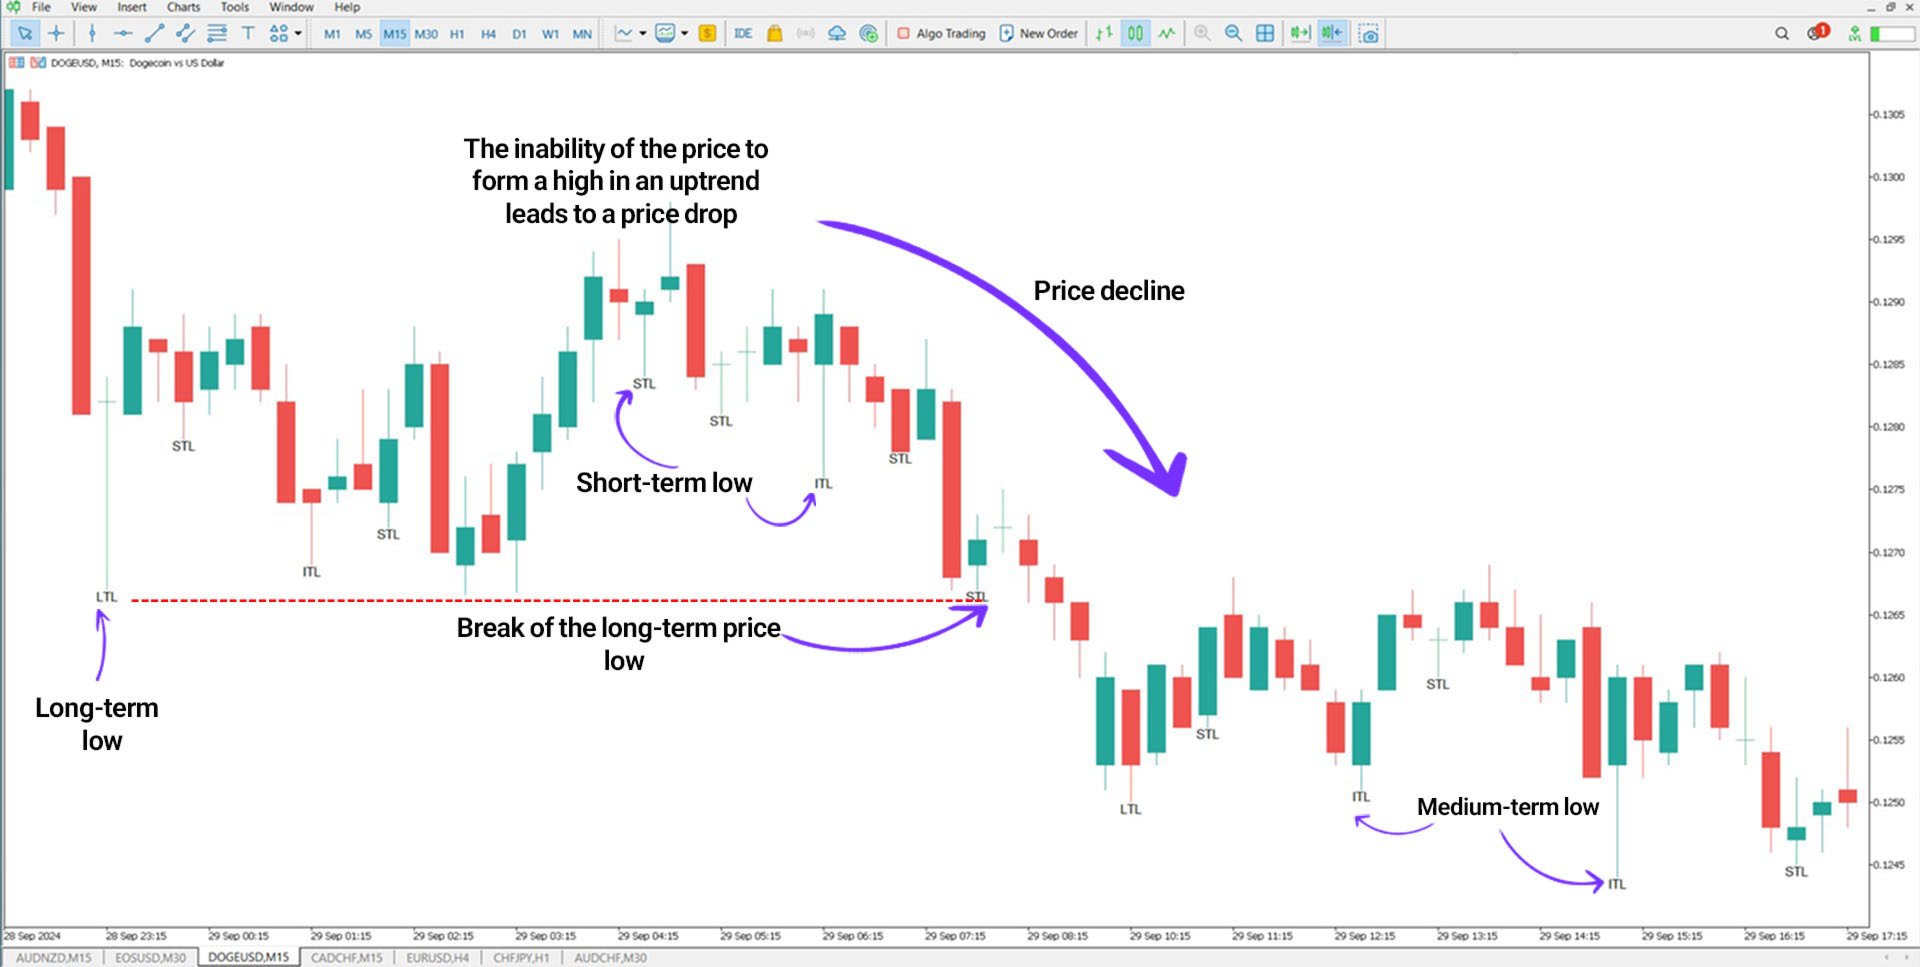
Indicator in a Downtrend
On the 15-minute DOGE/USD chart, after the price breached several lows and touched the Long-Term Low, a minor upward movement occurred, but the price failed to establish higher highs.
As a result, when the Long-Term Low was broken, the bearish trend continued. This indicator provides traders with opportunities to enter short positions and refine their risk assessment strategies.
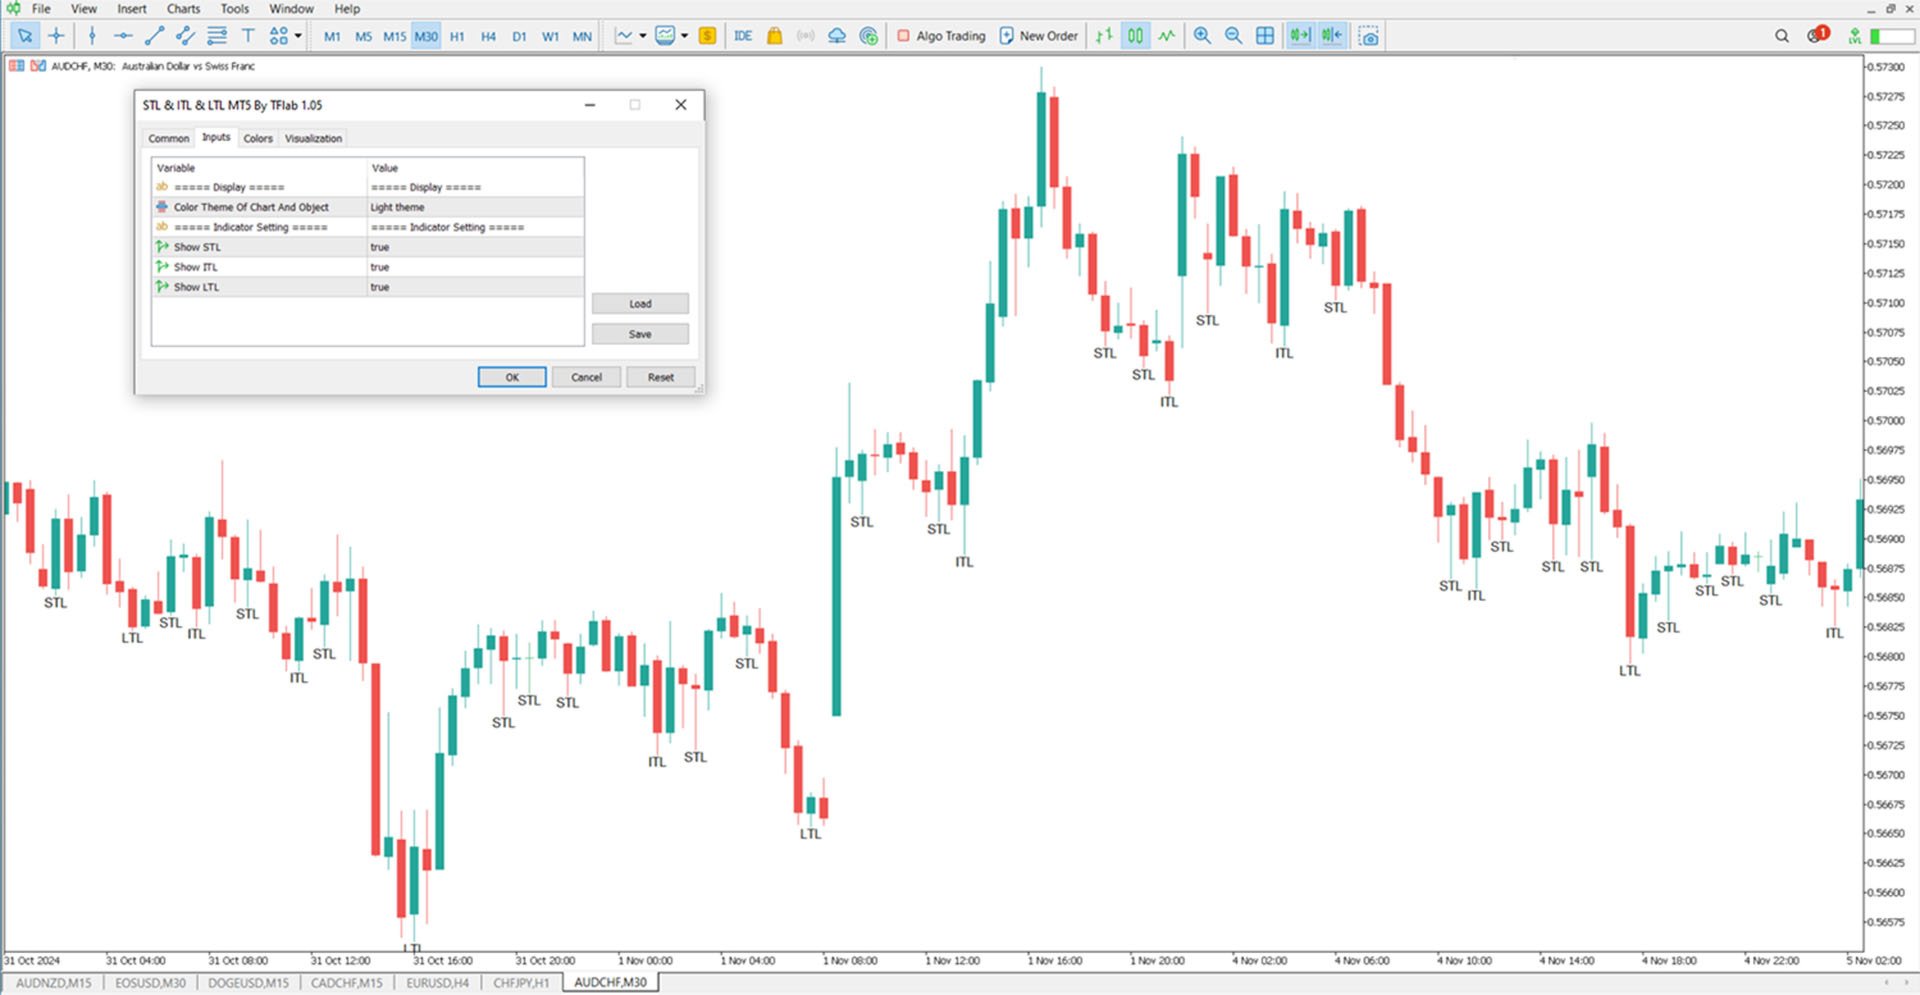
Indicator Settings
- Chart & Object Theme – Defines the chart background color.
- Show STL – Enables or disables the display of short-term lows.
- Show ITL – Enables or disables the display of intermediate-term lows.
- Show LTL – Enables or disables the display of long-term lows.
Conclusion
The STL, ITL, and LTL indicators provide an essential structure for market trend analysis, particularly for traders using ICT methodologies. The STL marks short-term lows, the ITL highlights intermediate-term lows, and the LTL represents long-term lows.
These tools help traders recognize potential trend reversals and refine their trading approaches with better precision.