Accumulation Manipulation and Distribution ICT MT5
- Indikatoren
- Eda Kaya
- Version: 1.11
- Aktivierungen: 10
Accumulation, Manipulation, and Distribution ICT Indicator MT5
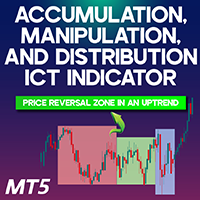
The AMD indicator is a sophisticated and highly effective tool designed for MetaTrader 5. By analyzing price fluctuations and trading volume across specific market sessions, it classifies price behavior into three key stages: Accumulation, Manipulation, and Distribution. To ensure clear distinction, the indicator highlights the Accumulation phase in pink, the Distribution phase in blue, and the Manipulation phase in green.
Indicator Specifications
| Category | ICT - Price Action - Liquidity |
| Platform | MetaTrader 5 |
| Skill Level | Advanced |
| Indicator Type | Continuation - Reversal |
| Time Frames | 15m - 30m - 1H |
| Trading Style | Swing Trading - Day Trading |
| Markets | Crypto - Forex - Stocks - Commodities |
Indicator Overview
By breaking down price behavior into the three fundamental market phases, the AMD ICT Indicator provides traders with valuable insights into the structure of the trading day. Typically, in the Accumulation phase, buying interest grows stronger, gradually absorbing sell orders and increasing upward pressure.
As the market shifts, the Distribution phase begins, where assets are offloaded, and selling pressure overtakes buying demand. The transition between Accumulation and Distribution is marked by the Manipulation phase, where liquidity is often taken before the trend fully develops.
Bullish Market Conditions
In the Binance Coin (BNB) price chart on the 1-minute timeframe, a clear price reversal towards an uptrend can be identified. The Accumulation and Distribution zones serve as strong indications of trend strength, allowing traders to determine optimal Entry and Exit points by analyzing shifts in momentum within these areas.
Bearish Market Conditions
On the EUR/USD price chart, also in a 1-minute timeframe, the Accumulation and Distribution regions highlight weakness in price movement. After the Distribution phase is complete, a reversal pattern frequently follows, presenting high-probability short-selling opportunities for traders.
Indicator Settings
- Theme: Customize the indicator's appearance
- Session Type: Select AMD session mode
- Lookback Days: Adjust the historical data range (default: 5 days)
Conclusion
The AMD ICT Indicator effectively detects Accumulation, Manipulation, and Distribution patterns by analyzing session highs and lows. Through a detailed evaluation of strength and weakness within these key zones, traders can anticipate potential trend reversals and refine their long and short trade entries accordingly.
