• Übersicht
  • Bewertungen
  • Diskussion

Monte Carlo Trading Heatmap

Der Indikator verwendet brownsche Bewegung und Monte-Carlo-Iterationen , um die Wahrscheinlichkeit zu berechnen, dass sich der Preis in eine bestimmte Richtung bewegt.

Was zeigt der Indikator?

Er zeichnet eine Heatmap , die den Bereich in drei Zonen unterteilt, je nachdem, mit welcher Wahrscheinlichkeit der Preis bestimmte Niveaus erreicht:

  • 🔴 Rote Zone: Wahrscheinlichkeit über 50%.
  • 🟠 Orange Zone: Wahrscheinlichkeit zwischen 25% und 50%.
  • 🟢 Grüne Zone: Wahrscheinlichkeit unter 25%.

Zusätzlich zeichnet er eine blaue Linie, die die wahrscheinlichste Preisbewegung darstellt.

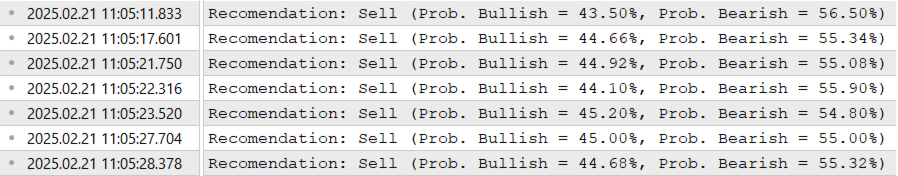
Schließlich berücksichtigt der Indikator die Anzahl der bullischen und bärischen Zustände und gibt im Expertenfenster die Wahrscheinlichkeit aus, ob die Gesamtbewegung bullisch oder bärisch ist.
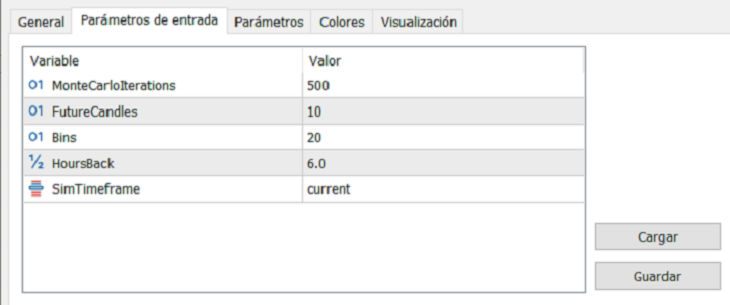
Eingabeparameter

  • MonteCarloIterations - Anzahl der Monte-Carlo-Simulationen pro zukünftiger Kerze. Ein höherer Wert erhöht die Genauigkeit der Wahrscheinlichkeitsschätzung, verlangsamt jedoch die Berechnung.
  • FutureCandles - Anzahl der zukünftigen Kerzen, die simuliert werden sollen, also wie viele Kerzen auf der Heatmap und der blauen Linie projiziert werden.
  • Bins - Anzahl der Unterteilungen im Histogramm der Heatmap. Mehr Bins bedeuten eine höhere Granularität in der Preisverteilung.
  • HoursBack - Anzahl der historischen Stunden, die für die Analyse herangezogen werden. Mehr Stunden verbessern die statistische Stabilität.
  • SimTimeframe - Der Zeitrahmen, der für die Simulation verwendet wird. Es können verschiedene Zeitrahmen genutzt oder der aktuelle Chart-Zeitrahmen übernommen werden.

Passen Sie diese Parameter an die Leistungsfähigkeit Ihres Systems und Ihre Analyseanforderungen an.

Wie kann ich den Indikator verwenden?

Dieser Indikator kann für verschiedene Zwecke genutzt werden:

  • Die äußere Begrenzung der grünen Zone kann als Referenz für die Platzierung eines Stop-Loss genutzt werden.
  • Die Heatmap ermöglicht eine Schätzung des Zeitrahmens und der Geschwindigkeit, mit der ein Ziel erreicht werden kann.
  • Die blaue Linie hilft bei der Bestätigung von Marktbewegungen oder Einstiegssignalen.
  • Wenn das Expertenfenster eine signifikante Abweichung in der bullischen-bärischen Wahrscheinlichkeit zeigt, kann dies als Signal zur Bestätigung oder zum Suchen von Einstiegsmöglichkeiten dienen.   


Empfohlene Produkte
The 4 headed dragon is an indicator that has two functions. 1) Set the background trend. 2) Mark the predominant trend. By combining these two indicator signals, we will be able to trade for or against the trend, adapting the signals to your reading of the market. You can download the demo and test it yourself. 1) Set the background trend.    Define four possibilities of trend that are the four heads of the dragon, marked by colors on the indicator, marking a) Powerful buying trend. b) Weak
[ MT4 Version ]  [ Kill Zones ]  [ SMT Divergences ] How to trade using Order Blocks:  Click here User Interface Performance:  During testing in the strategy tester, the UI may experience lag. Rest assured, this issue is specific to the testing environment and does not affect the indicator's performance in live trading. Elevate your trading strategy with the  Order Blocks ICT Multi TF  indicator, a cutting-edge tool designed to enhance your trading decisions through advanced order block analysis
Impulse fractals indicator - is counter-trend oriented complex market fractal pattern.  Market creates bull/bear impulse, trend starts, fractals on impulsed wave are an agressive pullback signals. Buy arrow is plotted when market is bearish and it's impulse showed up-side fractal, and sell arrow is plotted when market is bullish and it's impulse showed dn-side fractal. Main indicator's adjustable inputs : impulsePeriod - main period of impulse histogram  filterPeriod  - smoothes impulse accordi
High Low Open Close
Alexandre Borela
4.98 (42)
Wenn Sie dieses Projekt mögen, hinterlassen Sie eine 5-Sterne-Bewertung. Dieser Indikator zieht die offenen, hohen, niedrigen und schließenden Preise für die angegebenen und kann für eine bestimmte Zeitzone eingestellt werden. Dies sind wichtige Ebenen, die von vielen institutionellen und professionellen Händler und kann nützlich sein, um die Orte, wo sie vielleicht mehr aktiv. Die verfügbaren Zeiträume sind: Vorheriger Tag. Vorherige Woche. Vorheriger Monat. Vorheriges Viertel. Vorheriges Jahr
FREE
The intelligent algorithm of the Godfather indicator accurately determines the trend, filters out market noise and generates entry and exit levels. The indicator will help in finding entry points when analyzing the price chart. The program first receives a "snapshot" of the graph, then analyzes it. The results are reported to the trader in the form of signals. The main purpose of this indicator is to determine the moments of entries and exits from transactions, so the indicator displays only th
Value Chart Candlesticks
Flavio Javier Jarabeck
4.73 (11)
The idea of a Value Chart indicator was presented in the very good book I read back in 2020 , " Dynamic Trading Indicators: Winning with Value Charts and Price Action Profile ", from the authors Mark Helweg and David Stendahl. The idea is simple and the result is pure genius: Present candlestick Price analysis in a detrended way! HOW TO READ THIS INDICATOR Look for Overbought and Oversold levels. Of course, you will need to test the settings a lot to find the "correct" one for your approach. It
FREE
Manyal trading system, CovEchoTrend Robot, focuses on reliability and flexibility. By employing statistical analysis methods to study the relationships between the base indicator and market patterns, the system enables a deeper understanding of market processes. Intelligent pattern analysis: The application of statistical data processing helps identify key trend reversal points more accurately, signaling significant market shifts. Informed decision-making is based on the intersection of indicato
Blahtech VWAP MT5
Blahtech Limited
5 (1)
Was: $69  Now: $49   Blahtech VWAP - Volume Weighted Average Price (VWAP) is the ratio of price to total volume. It provides an average price over a specified time interval.  Links [  Install  |  Update  |  Documentation   ] Feature Highlights Configurable VWAP Line Sessions, intervals, anchored or continuous Previous day settlement line Standard Deviation bands Alerts at bar close or real time Automatic Broker or Tick volumes Significantly reduced CPU usage Input Parameters Expert Advisor Mo
Dieser Z-Score Indikator zeigt den korrekten Z-Score eines Assets, da es die normierten (normal-verteilten) Preisdaten benutzt. Das ist der einzige Weg den Z-Score richtig zu berechnen. Der Z-Score darf nur basierend auf normal-verteilten Daten berechnet werden, deshalb wird für die Berechnung die normierten Returns benutzt, als normalverteilt angenommen werden. Die Berechnung des Z-Scores basierend nur auf dem Preis selbst ist nicht zulässig, da der Preis einer eher log-normal Verteilung folgt.
EYeQ Indicator ist ein leistungsstarkes Tool, um Einstiegssignale für STEP INDEX, VOLATILITY 10, 25,50,75 100, BOOM und CRUSH anzubieten. Es ist effektiver zum Fangen von SPIKES auf BOOM und CRUSH 300, 500 und 1000. Der EYeQ-Indikator analysiert Märkte über mehrere Zeiträume hinweg und findet basierend auf Trends die am besten geeigneten Einstiegspunkte. Sie müssen nur die Desktop-Benachrichtigungen einschalten, damit Sie benachrichtigt werden können, wenn Signale freigegeben werden. Erlauben
Range Directional Force Indicator – Designed for You to Optimize! The Range Directional Force Indicator is a cutting-edge tool designed to empower traders by visualizing market dynamics and directional strength. Built to offer insights into market trends and reversals, this indicator is an invaluable asset for traders seeking precision in their strategies. However, it is important to note that this indicator is not optimized, leaving room for you to tailor it to your unique trading preferences.
CChart
Rong Bin Su
Overview In the fast-paced world of forex and financial markets, quick reactions and precise decision-making are crucial. However, the standard MetaTrader 5 terminal only supports a minimum of 1-minute charts, limiting traders' sensitivity to market fluctuations. To address this issue, we introduce the Second-Level Chart Candlestick Indicator , allowing you to effortlessly view and analyze market dynamics from 1 second to 30 seconds on a sub-chart. Key Features Support for Multiple Second-Level
The   Pairs Cross indicator   is a unique tool for negatively correlated trading instruments, such as EURUSD and USDCHF currency pairs. It is based on a concept called pairs trading (or spread trading). Our indicator compares the strength of two currency pairs that are inversely correlated and quickly tells you when it’s time to buy the first pair and short a second pair, and vice versa. This is a straightforward approach to trading currency pairs that works very well. How to you use the Pairs
With Fixed Range Volume Profile,The traces left by the big players will not go unnoticed by you. Professional   Volume Profile   Indicator reveals Institutional order flow. This advanced market indicator will teach you to spot the buying and selling. Dont want to say more because its well known by most professionals  trader. This Indicator : -  Quickly Identify the Strongest Institutional S/R Zones. - W orks with all Trading Instruments (Forex, Futures, Indexes, Commodities, Stocks, Cryptocurr
Bei diesem Indikator handelt es sich um einen Indikator für die automatische Wellenanalyse, der sich perfekt für den praktischen Handel eignet! Fall... Hinweis:   Ich bin es nicht gewohnt, westliche Namen für die Welleneinstufung zu verwenden. Aufgrund des Einflusses der Namenskonvention von Tang Lun (Tang Zhong Shuo Zen) habe ich die Grundwelle als   Stift   und das sekundäre Wellenband als   Segment   bezeichnet Gleichzeitig hat das Segment die   Trendrichtung   benannt (diese Benennungsmeth
Entdecken Sie die wahren, verborgenen Muster des Marktes mit dem PREDATOR AURORA Trading-System – dem Endgegner der hybriden Trading-Indikatoren. Sehen Sie, was andere nicht sehen! Das PREDATOR AURORA Trading-System ist eine Kraft, die für diejenigen entwickelt wurde, die sich weigern, im Schatten der Mittelmäßigkeit zu verharren. Dies ist nicht nur ein weiterer Indikator; es ist der Cheat-Code; es ist Ihr unfairer Vorteil, ein ausgeklügeltes hybrides Jagdsystem, das Marktbewegungen mit tödli
QuantumAlert RSI Navigator is a free indicator available for MT4/MT5 platforms, its work is to provide "alerts" when the market is inside "overbought and oversold" regions in the form of "buy or sell" signals. This indicator comes with many customization options mentioned in the parameter section below, user can customise these parameters as needful. Join our MQL5 group , where we share important news and updates. You are also welcome to join our private channel as well, contact me for the priva
FREE
Volume Delta Panel  is a very powerful indicator that read the supply on Market. It calculates the Delta from movement of the price and the difference of BUY volumes and SELL volumes. The Volumes are added to price and normalized to symbol points.  Its special structure allows you to get all Time Frames values available on the platform MT5. Panel can show 50 instruments simultaneously all customizable according to the offer of the Broker. A good observation of this instrument can suggest great e
Follow The Line MT5
Oliver Gideon Amofa Appiah
4.52 (29)
This indicator obeys the popular maxim that: "THE TREND IS YOUR FRIEND" It paints a GREEN line for BUY and also paints a RED line for SELL. (you can change the colors). It gives alarms and alerts of all kinds. IT DOES NOT REPAINT and can be used for all currency pairs and timeframes. Yes, as easy and simple as that. Even a newbie can use it to make great and reliable trades. NB: For best results, get my other premium indicators for more powerful and reliable signals. Get them here: https://www.m
FREE
移動平均線クロス、ボリンジャーと移動平均線のクロス、移動平均線の角度でサイン表示 MT5インジケータ こちらに サイト があります。 このインジケータは3つのパターンでサインを表示(切り替え可能)します。 ① 移動平均線のクロス ② ボリンジャーバンドと短期移動平均線とのクロス ③ ボリンジャーバンドと短期移動平均線とのクロスと、中期移動平均線と長期移動平均線の角度 ⓸ ボリンジャーバンドと短期移動平均線とのクロス(サインを交互に表示) 移動平均線のクロス 指定した短期移動平均線と長期移動平均線のゴールデンクロスでは買いサイン、デットクロスでは売りサインを表示します。 ディフォルトでは短期は5,長期は20となっています。 もちろん変更可能になります。 移動平均線の種類をEMA(指数平滑移動平均線)やSMMA(平滑化移動平均)などに変更可能で適する価格も変更可能になります。 ボリンジャーバンドと短期移動平均線のクロス ボリンジャーバンド(以降BB)と短期移動平均線のクロスでサインを表示します。 ディフォルトではBB+1σと5MAのゴールデンクロスで買いサイン、BB-1σと5MAのデット
Der Trendfänger: Die Strategie des Trendfängers mit Alarmindikator ist ein vielseitiges technisches Analysewerkzeug, das Händlern hilft, Markttrends und potenzielle Ein- und Ausstiegspunkte zu identifizieren. Sie verfügt über eine dynamische Trendfängerstrategie, die sich den Marktbedingungen anpasst, um eine klare visuelle Darstellung der Trendrichtung zu ermöglichen. Händler können die Parameter an ihre Vorlieben und Risikotoleranz anpassen. Der Indikator hilft bei der Trendidentifikation, s
FREE
Deriv Boom sell
Yaovi Inoussa Atchou
Our BOOM SELL ALERT indicator is specifically engineered to   take candles on BOOM 1000 , BOOM 500 is tool is optimized for M1 (1-minute) timeframe, ensuring you receive timely and actionable insights.   The indicator is a combination of   many indicators. -        AO Oscillator -        Stochastic   HOW TO USE THIS INDICATOR To use well this indicator , it   need to use SCHAFF TREND RSX ( 5 MIN OR M5) IF SCHAFF trend RSX is GREEN and you have a signal then SELL when you have ENTRY and out with
The key logic of SignalTech is generated by Artificial Intelligence. The machine learning module should continue optimizing the core logic on the server side to guarantee that SignalTech System can accurately track the market's movement.  SignalTech can generate AI based signals with Buy/Sell Arrows and Pop-Up/Sound Alerts. Each signal has clear Entry and stop Loss levels, which should be automatically flagged on the chart, as well as potential Targets 1, 2, and 3. SignalTech can work on EURU
Adjustable Consecutive Fractals  looks for 2 or more fractals in one direction and sends out a on screen alert, sound alert and push notification, for strong reversal points . Adjustable Consecutive Fractals, shows the fractals on chart along with a color changing text for buy and sell signals when one or more fractals appear on one side of price. Adjustable Consecutive Fractals is based Bill Williams Fractals . The standard Bill Williams fractals are set at a non adjustable 5 bars, BUT withe th
About indicator > The indicator is a function based on one value (open/high prices up to now) and then it is a mathematical representation of the whole function that is totally independent from any else values. So, if you ask yourself will the future be as it is on the graph... I can tell you - as it was the same as the trading function up to the moment "now"... In conclusion, the point of the indicator is  to try to show the future of the trading function into eternity. The graphic is sometime
Free automatic Fibonacci is an indicator that automatically plots a Fibonacci retracement based on the number of bars you select on the BarsToScan setting in the indicator. The Fibonacci is automatically updated in real time as new highest and lowest values appears amongst the selected bars. You can select which level values to be displayed in the indicator settings. You can also select the color of the levels thus enabling the trader to be able to attach the indicator several times with differe
FREE
Moving line
Jun Chao Jiang
The one minute chart has a bug, but the one-day chart can still be used after deleting the bug and reloading the indicators, This indicator can be used to determine how far the indicator goes up to place an order to buy, how far it goes down to place an order to sell, and not placing an order until it reaches this distance, which is considered oscillation, open an account gift index
FREE
Seasonal Pattern Trader
Dominik Patrick Doser
Disclaimer:   Bedenken Sie, dass saisonale Muster nicht immer zuverlässig sind. Deshalb ist ein durchdachtes Risikomanagement entscheidend, um Verluste zu minimieren. Saisonale Muster in der Finanzwelt sind wie ein gut gehütetes Geheimnis, das erfolgreiche Investoren für ihren Vorteil nutzen.  Diese Muster sind wiederkehrende Preisbewegungen, die in bestimmten Zeiträumen oder um besondere Ereignisse auftreten. Hier sind einige Beispiele und Hinweise zur optimalen Nutzung dieser Muster: Beispiel
The Trap Play MT5
Carl Gustav Johan Ekstrom
5 (1)
Trap Play  refers to a market situation where price initially makes a new high or low, luring traders into believing a strong trend is forming. However, the price quickly reverses and invalidates the breakout, trapping those traders who entered positions based on the initial move. This sudden reversal often results in a rapid exit of positions, leading to significant price movement in the opposite direction.  Trap plays  can occur in various financial markets and timeframes and are characterized
My PVSR
Ashok Kumar Singha
My PVSR   is based on All Type of Pivot Points. Use this Indicator to get proper Support / Resistance Zone and Trade accordingly.. Recommendation: Use this Indicator along with my another Indicator --->>> Dr. Trend   <<<--- Click Here ; To get the best output result feel free to contact me ; Best of Luck It can be used for: All Pairs: Forex, Cryptocurrencies, Metals, Stocks, Indices etc. All Timeframe All Brokers All type of Trading Style like Scalping, Swing, Intraday, Short-Term, Long-
Käufer dieses Produkts erwarben auch
Trend Screener Pro MT5
STE S.S.COMPANY
4.84 (76)
Nutzen Sie die Macht des Trendhandels mit Trend Screener Indicator: Ihrer ultimativen Trendhandelslösung, die auf Fuzzy-Logik und einem System mit mehreren Währungen basiert! Steigern Sie Ihren Trendhandel mit Trend Screener, dem revolutionären Trendindikator mit Fuzzy-Logik. Es handelt sich um einen leistungsstarken Trendfolgeindikator, der über 13 Premium-Tools und -Funktionen sowie 3 Handelsstrategien kombiniert und ihn zu einer vielseitigen Wahl macht, um Ihren Metatrader in einen Trendanaly
Golden Trend Indicator MT5
Noha Mohamed Fathy Younes Badr
4.88 (16)
Golden Trend indicator  is The best indicator for predicting trend movement this indicator never lags and never repaints and never back paints    and give  arrow buy and sell    before the candle appear  and it will help you and  will make your trading decisions clearer its work on all currencies and  gold and crypto and all time frame This unique  indicator uses very secret algorithms to catch the  trends, so you can trade using this indicator and see the trend clear on charts  manual guide and
FX Power MT5 NG
Daniel Stein
5 (11)
FX Power: Analysieren Sie die Stärke von Währungen für intelligentere Handelsentscheidungen Übersicht FX Power ist Ihr unverzichtbares Werkzeug, um die tatsächliche Stärke von Währungen und Gold unter allen Marktbedingungen zu verstehen. Indem Sie starke Währungen kaufen und schwache verkaufen, vereinfacht FX Power Ihre Handelsentscheidungen und deckt Chancen mit hoher Wahrscheinlichkeit auf. Ob Sie Trends folgen oder extreme Delta-Werte nutzen, um Umkehrungen zu prognostizieren, dieses Tool p
FX Volume MT5
Daniel Stein
4.82 (17)
FX Volume: Erleben Sie den echten Marktüberblick aus der Sicht eines Brokers Kurzüberblick Möchten Sie Ihre Handelsstrategie auf das nächste Level bringen? FX Volume liefert Ihnen Echtzeit-Einblicke in die Positionierung von Retail-Tradern und Brokern — lange bevor verzögerte Berichte wie der COT verfügbar sind. Ob Sie nach beständigen Gewinnen streben oder einfach einen tieferen Vorteil am Markt suchen, FX Volume hilft Ihnen, große Ungleichgewichte zu erkennen, Breakouts zu bestätigen und Ihr
FX Levels MT5
Daniel Stein
5 (3)
FX Levels: Außerordentlich präzise Unterstützungs- und Widerstandszonen für alle Märkte Kurzüberblick Suchen Sie eine verlässliche Methode, um Support- und Resistance-Level in jedem Markt zu identifizieren—egal ob Währungspaare, Indizes, Aktien oder Rohstoffe? FX Levels vereint die traditionelle „Lighthouse“-Methode mit einem modernen dynamischen Ansatz und bietet nahezu universelle Genauigkeit. Durch unsere Erfahrung mit echten Brokern sowie automatischen täglichen und Echtzeit-Updates hilft
TPSproTREND PrO MT5
Roman Podpora
4.71 (17)
TPSpro TREND PRO   ist ein Trendindikator, der den Markt automatisch analysiert und Informationen über den Trend und jede seiner Änderungen liefert sowie Signale für den Einstieg in Geschäfte ohne Neuzeichnung gibt! Der Indikator verwendet jede Kerze und analysiert sie separat. bezieht sich auf verschiedene Impulse – Aufwärts- oder Abwärtsimpuls. Exakte Einstiegspunkte in Transaktionen für Währungen, Krypto, Metalle, Aktien, Indizes! Version MT5                   VOLLSTÄNDIGE BESCHREIBUNG DES IN
PUMPING STATION – Ihre Gewinnpumpe im Forex-Handel! Wir präsentieren Ihnen PUMPING STATION , einen revolutionären Forex-Indikator, der Ihr Trading in eine echte Gewinnmaschine verwandelt! Dieser Indikator ist nicht nur ein Assistent, sondern ein vollständiges Handelssystem mit leistungsstarken Algorithmen, die Ihnen helfen, kontinuierlich Gewinne zu erzielen. Beim Kauf dieses Produkts erhalten Sie zusätzlich KOSTENLOS: Exklusive Set-Dateien für eine automatische Einrichtung und maximale Performa
TPSpro RFI Levels MT5
Roman Podpora
4.53 (19)
ANWEISUNGEN       Russland       -        ENG    Die Empfehlung basiert auf dem Indikator -   TPSpro   TREND PRO -   Version MT5 Die wichtigsten Elemente in der Branche sind entweder in Zonen oder in der Fabrik enthalten, oder sie führen zu einer Lösung bei einem Kauf oder dem Verkauf eines anderen Instruments. Wenn viele Menschen ihre Rechte nicht auf dem Händlerkonto verschlüsseln, werden die Folgen nicht schnell genug sein. Ich habe es damit abgeschlossen, dass ich diese Folgen nun noch inter
IX Power MT5
Daniel Stein
4.86 (7)
IX Power: Markteinblicke für Indizes, Rohstoffe, Kryptowährungen und Forex Überblick IX Power ist ein vielseitiges Tool zur Analyse der Stärke von Indizes, Rohstoffen, Kryptowährungen und Forex-Symbolen. Während FX Power die höchste Präzision für Währungspaare bietet, indem es alle verfügbaren Paardaten einbezieht, konzentriert sich IX Power ausschließlich auf die Marktdaten des zugrunde liegenden Symbols. Dies macht IX Power zu einer hervorragenden Wahl für Nicht-Forex-Märkte und zu einem zuv
Matrix Arrow Indicator MT5
Juvenille Emperor Limited
5 (13)
Matrix Arrow Indicator MT5   ist ein einzigartiger 10-in-1-Trend, der zu   100 % nicht neu gezeichnet   werden kann. Multi-Timeframe-Indikator, der für alle Symbole/Instrumente verwendet werden kann:   Forex ,   Rohstoffe ,   Kryptowährungen ,   Indizes ,   Aktien .  Der  Matrix Arrow Indicator MT5  wird den aktuellen Trend in seinen frühen Stadien bestimmen und Informationen und Daten von bis zu 10 Standardindikatoren sammeln, die sind: Durchschnittlicher Richtungsbewegungsindex (ADX) Rohstoff
This indicator is based on the mathematics of the great trader W.D. Ganna. With its help, you can easily find strong levels by analyzing swings to find the optimal entry point. The indicator works on all instruments and all timeframes. The indicator is fully manual and has control buttons. All you need to do is press the NEW button, a segment will appear, which you can place on any movement, swing or even 1 candle that you want to analyze. By placing the segment, press the OK button. A grid (th
Dieses Dashboard zeigt die   neuesten verfügbaren harmonischen   Muster für die ausgewählten Symbole, so dass Sie Zeit sparen und effizienter sein werden /   MT4-Version . Kostenloser Indikator:   Basic Harmonic Pattern Spalten des Indikators Symbol:   die ausgewählten Symbole werden angezeigt Trend:   bullish oder bearish Pattern :   Art des Musters (Gartley, Schmetterling, Fledermaus, Krabbe, Hai, Cypher oder ABCD) Entry :   Einstiegskurs SL:   Stop-Loss-Kurs TP1:   1. Take-Profit-Kurs TP2
Quantum TrendPulse
Bogdan Ion Puscasu
5 (13)
Wir stellen   Quantum TrendPulse   vor, das ultimative Handelstool, das die Leistung von   SuperTrend   ,   RSI   und   Stochastic   in einem umfassenden Indikator vereint, um Ihr Handelspotenzial zu maximieren. Dieser Indikator wurde für Händler entwickelt, die Präzision und Effizienz suchen, und hilft Ihnen dabei, Markttrends, Momentumverschiebungen und optimale Ein- und Ausstiegspunkte sicher zu erkennen. Hauptmerkmale: SuperTrend-Integration:   Folgen Sie problemlos dem vorherrschenden Markt
This indicator identifies and displays zones, as it were areas of strength, where the price will unfold. The indicator can work on any chart, any instrument, at any timeframe. The indicator has two modes. The indicator is equipped with a control panel with buttons for convenience and split into two modes. Manual mode: To work with manual mode, you need to press the NEW button, a segment will appear. This segment is stretched over the movement and the LVL button is pressed. The level is displayed
Gold Stuff mt5
Vasiliy Strukov
4.92 (173)
Gold Stuff mt5-Ein Trendindikator, der speziell für Gold entwickelt wurde, kann auch auf allen Finanzinstrumenten verwendet werden. Der Indikator wird nicht neu gezeichnet und verzögert sich nicht. Empfohlener Zeitrahmen H1. WICHTIG! Kontaktieren Sie mich sofort nach dem Kauf, um Anweisungen und Bonus zu erhalten!     Sie können eine kostenlose Kopie unseres Strong Support- und Trendscanner-Indikators erhalten, bitte senden Sie uns eine persönliche Nachricht. Mich! DATEN Draw Arrow - inkl.a
FX Dynamic: Volatilität und Trends mit anpassbarer ATR-Analyse im Blick Übersicht FX Dynamic ist ein leistungsstarkes Tool, das die Berechnungen des Average True Range (ATR) nutzt, um Tradern unübertroffene Einblicke in die tägliche und intraday-Volatilität zu geben. Durch das Festlegen klarer Volatilitätsschwellen — beispielsweise 80%, 100% und 130% — kannst du schnell potenzielle Gewinnchancen erkennen oder Warnungen erhalten, wenn der Markt seine üblichen Spannen überschreitet. FX Dynamic p
Support And Resistance Screener ist ein Level-Indikator für MetaTrader, der mehrere Tools innerhalb eines Indikators bietet. Die verfügbaren Werkzeuge sind: 1. Marktstruktur-Screener. 2. Bullische Pullback-Zone. 3. Bärische Pullback-Zone. 4. Tägliche Pivot-Punkte 5. wöchentliche Pivots-Punkte 6. monatliche Pivots-Punkte 7. Starke Unterstützung und Widerstand basierend auf harmonischem Muster und Volumen. 8. Zonen auf Bankebene. ZEITLICH BEGRENZTES ANGEBOT: HV Support and Resistance Indicator ist
Zunächst einmal ist es wichtig zu betonen, dass dieses Handelstool ein Nicht-Repaint-, Nicht-Redraw- und Nicht-Verzögerungsindikator ist, was es ideal für professionelles Trading macht. Online-Kurs, Benutzerhandbuch und Demo. Der Smart Price Action Concepts Indikator ist ein sehr leistungsstarkes Werkzeug sowohl für neue als auch erfahrene Händler. Er vereint mehr als 20 nützliche Indikatoren in einem und kombiniert fortgeschrittene Handelsideen wie die Analyse des Inner Circle Traders und Str
Gold Trend 5
Sergei Linskii
3.5 (2)
Gold Trend - dies ist ein guter technischer Indikator für Aktien. Der Algorithmus des Indikators analysiert die Preisbewegung eines Vermögenswerts und spiegelt die Volatilität und mögliche Einstiegszonen wider. Die besten Indikatorsignale: - Für VERKAUFEN = rotes Histogramm + roter SHORT-Zeiger + gelber Signalpfeil in dieselbe Richtung. - Für KAUFEN = blaues Histogramm + blauer LONG-Zeiger + aquafarbener Signalpfeil in dieselbe Richtung. Vorteile des Indikators: 1. Der Indikator erzeugt S
Atomic Analyst MT5
Issam Kassas
4.32 (19)
Zunächst einmal ist es erwähnenswert, dass dieser Handelsindikator nicht neu malt, nicht neu zeichnet und keine Verzögerung aufweist, was ihn sowohl für manuellen als auch für Roboterhandel ideal macht. Benutzerhandbuch: Einstellungen, Eingaben und Strategie. Der Atom-Analyst ist ein PA-Preisaktionsindikator, der die Stärke und das Momentum des Preises nutzt, um einen besseren Vorteil auf dem Markt zu finden. Ausgestattet mit fortschrittlichen Filtern, die helfen, Rauschen und falsche Signale z
PZ Trend Trading MT5
PZ TRADING SLU
3.8 (5)
Trend Trading ist ein Indikator, der so weit wie möglich von den Markttrends profitiert, indem er Pullbacks und Breakouts zeitlich festlegt. Sie findet Handelsmöglichkeiten, indem sie analysiert, was der Preis während etablierter Trends tut. [ Installationsanleitung | Update-Anleitung | Fehlerbehebung | FAQ | Alle Produkte ] Handeln Sie mit Zuversicht und Effizienz an den Finanzmärkten Profitieren Sie von etablierten Trends, ohne ins Wanken zu geraten Profitable Pullbacks, Ausbrüche und vorze
Easy Breakout MT5
Mohamed Hassan
5 (3)
After your purchase, feel free to contact me for more details on how to receive a bonus indicator called VFI, which pairs perfectly with Easy Breakout for enhanced confluence!     Easy Breakout MT5   is a powerful price action trading system built on one of the most popular and widely trusted strategies among traders: the   Breakout strategy ! This indicator delivers crystal-clear Buy and Sell signals based on breakouts from key support and resistance zones. Unlike typical breakout indicators
MetaForecast M5
Vahidreza Heidar Gholami
5 (2)
MetaForecast prognostiziert und visualisiert die Zukunft eines beliebigen Marktes basierend auf den Harmonien in den Preisdaten. Obwohl der Markt nicht immer vorhersehbar ist, kann MetaForecast, wenn es ein Muster im Preis gibt, die Zukunft so genau wie möglich voraussagen. Im Vergleich zu ähnlichen Produkten kann MetaForecast durch die Analyse von Markttrends genauere Ergebnisse erzeugen. Eingabeparameter Past size (Vergangene Größe) Gibt an, wie viele Balken MetaForecast verwendet, um ein Mod
Dies ist ein Indikator für MT5, der genaue Signale für den Einstieg in einen Handel ohne Repainting (Neuzeichnen) liefert. Er kann auf alle Finanzwerte angewendet werden: Forex, Kryptowährungen, Metalle, Aktien, Indizes. Er liefert ziemlich genaue Schätzungen und sagt Ihnen, wann es am besten ist, eine Position zu eröffnen und zu schließen. Sehen Sie sich das Video (6:22) mit einem Beispiel für die Verarbeitung nur eines Signals an, das sich für den Indikator gelohnt hat! Die meisten Händler ver
RelicusRoad Pro MT5
Relicus LLC
4.78 (18)
Jetzt 147 US -Dollar (nach ein paar Aktualisierungen auf 499 US -Dollar) - Unbegrenzte Konten (PCs oder MACs) RelicusRoad Benutzerhandbuch + Schulungsvideos + Zugang zur privaten Discord-Gruppe + VIP-Status EINE NEUE ART, DEN MARKT ZU BETRACHTEN RelicusRoad ist der weltweit leistungsstärkste Handelsindikator für Forex, Futures, Kryptowährungen, Aktien und Indizes und gibt Händlern alle Informationen und Tools, die sie benötigen, um profitabel zu bleiben. Wir bieten technische Analysen und Ha
Trend Line Map Pro MT5
STE S.S.COMPANY
4.09 (11)
Trend Line Map Indicator ist ein Add-On für Trend Screener Indicator. Es arbeitet als Scanner für alle Signale, die vom Trendscreener (Trendliniensignale) erzeugt werden. Es ist ein Trend Line Scanner basierend auf dem Trend Screener Indicator. Wenn Sie keinen Trend Screener Pro Indicator haben, funktioniert die Trend Line Map Pro nicht. It's a Trend Line Scanner based on Trend Screener Indicator. If you don't have Trend Screener Pro Indicator,     the Trend Line Map Pro will not work . Wen
Timeframes Trend Scanner is a trend analyzer or trend screener indicator that helps you know the trend in all timeframes of symbol you're watching. This indicator provides clear & detailed analysis results on a beautiful dashboard, let you able to use this result right away without need to do any additional analysis. Please note that this indicator doesn't work with Strategy Tester. Sorry for that! How it works Step 1: Calculate values of 23 selected & trusted technical indicators (Oscillator &
EXCLUSIVE! JUST  10 COPIES  AVAILABLE!   BONUS AUX VIP Club 2024 : Include EA CAP, CEP, LDH, PSC307 & AO4C to enhance the performance of this tool to its maximum potential  Click Here to Download Files   ( for users only ) FREE Trading Education Available Daily via Zoom --- For More Info or Instant Message Click link ---  https://t.me/abcdwave Transform your trading with the "Five Magic Bullets" Indicator, tailored for traders who embrace the power of Elliott Wave Chaos Theory.
Bill Williams Advanced
Siarhei Vashchylka
5 (9)
Bill Williams Advanced is designed for automatic chart analysis using Bill Williams' "Profitunity" system. The indicator analyzes four timeframes at once. Manual (Be sure to read before purchasing) Advantages 1. Automatically analyzes the chart using the "Profitunity" system of Bill Williams. The found signals are placed in a table in the corner of the screen. 2. Equipped with a trend filter based on the Alligator indicator. Most of the system signals are recommended to be used only according t
Gartley Hunter Multi
Siarhei Vashchylka
5 (9)
Gartley Hunter Multi - An indicator for searching for harmonic patterns simultaneously on dozens of trading instruments and on all possible timeframes. Manual (Be sure to read before purchasing) | Version for MT4 Advantages 1. Patterns: Gartley, Butterfly, Shark, Crab. Bat, Alternate Bat, Deep Crab, Cypher 2. Simultaneous search for patterns on dozens of trading instruments and on all possible timeframes 3. Search for patterns of all possible sizes. From the smallest to the largest 4. All fou
Auswahl:
Keine Bewertungen
Antwort auf eine Rezension