• Übersicht
  • Bewertungen
  • Diskussion

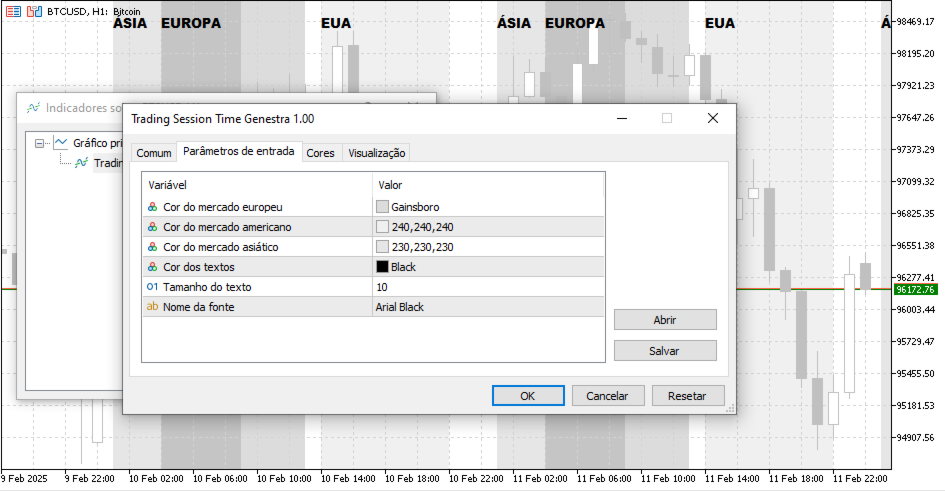
Trading Sessions Time Genestra

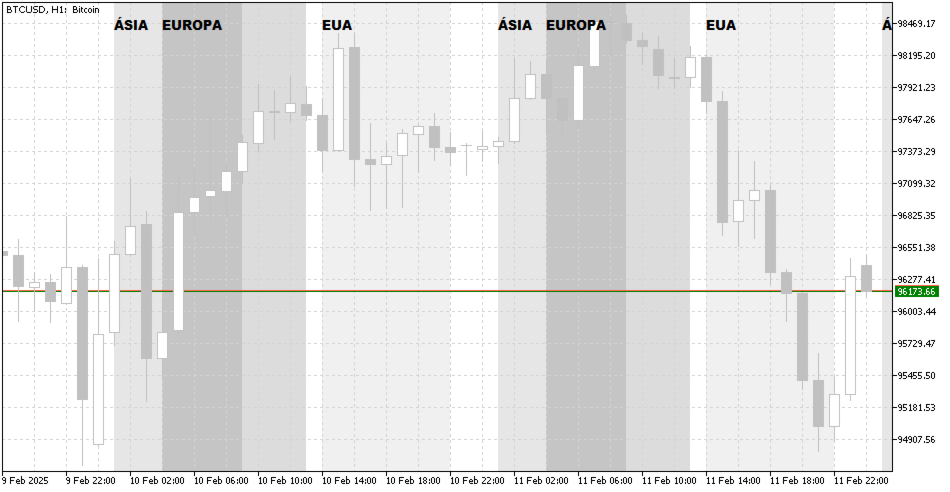
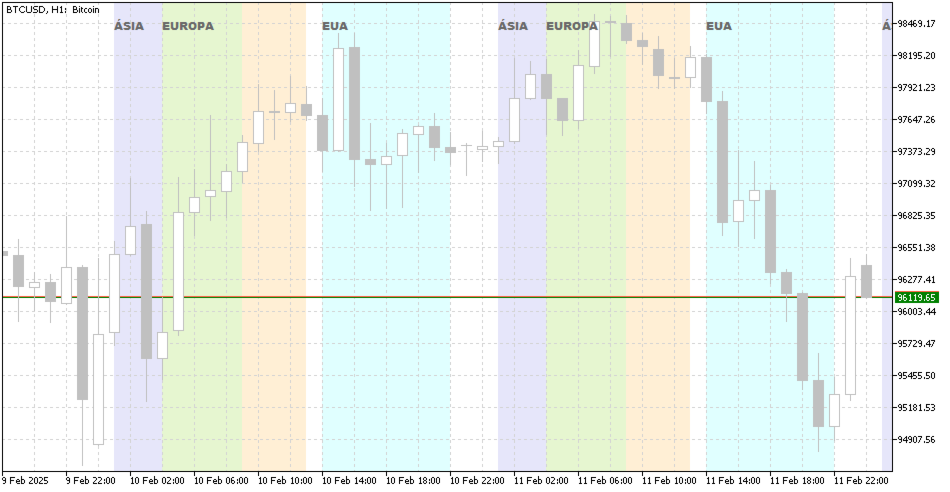
Dieser MetaTrader 5-Indikator identifiziert und zeigt visuell die Handelszeiten der wichtigsten Finanzmärkte (Europa, USA und Asien) im Chart an. Durch anpassbare farbige Füllungen markiert er die Handelsperioden jedes Marktes unter Berücksichtigung der Serverzeit (GMT+2) und ausgenommen Wochenenden. Die Marktnamen werden in Arial Black-Schrift nahe der Chartspitze angezeigt, ebenfalls mit anpassbarer Farbe. Der Indikator passt sich automatisch der Chartskala an und behält die Füllung über den gesamten vertikalen Bereich bei.
Empfohlene Produkte
Wave Box Market Frenquency
Jean Jacques Huve Ribeiro
4.75 (4)
Totally linked to the result of a movement and the duration he had. Its height records how many ticks the asset walked during a given movement, its width shows us the duration that movement had. Its configuration must be in line with the Weis Wave Indicator configuration to observe the movement force and can indicate a possible accumulation or distribution of the movement;
FREE
Tabajara V5
Flavio Javier Jarabeck
4.83 (35)
Metatrader 5 version of the famous Andre Machado's Tabajara indicator. If you don't know Andre Machado's Technical Analysis work you don't need this indicator... For those who need it and for those several friend traders who asked this porting from other platforms, here it is... FEATURES 8-period Moving Average 20-period Moving Average 50-period Moving Average 200-period Moving Average Colored candles according to the inflexion of the 20-period MA SETTINGS You can change the Period of all MA's
FREE
Value Chart Candlesticks
Flavio Javier Jarabeck
4.73 (11)
The idea of a Value Chart indicator was presented in the very good book I read back in 2020 , " Dynamic Trading Indicators: Winning with Value Charts and Price Action Profile ", from the authors Mark Helweg and David Stendahl. The idea is simple and the result is pure genius: Present candlestick Price analysis in a detrended way! HOW TO READ THIS INDICATOR Look for Overbought and Oversold levels. Of course, you will need to test the settings a lot to find the "correct" one for your approach. It
FREE
MIDAS Super VWAP
Flavio Javier Jarabeck
4.44 (9)
Imagine VWAP, MVWAP and MIDAS in one place... Well, you found it! Now you can track the movement of Big Players in various ways, as they in general pursue the benchmarks related to this measuring, gauging if they had good execution or poor execution on their orders. Traders and analysts use the VWAP to eliminate the noise that occurs throughout the day, so they can measure what prices buyers and sellers are really trading. VWAP gives traders insight into how a stock trades for that day and deter
FREE
Cybertrade Keltner Channels
Emanuel Andriato
4.75 (4)
Cybertrade Keltner Channels - MT5 Created by Chester Keltner, this is a volatility indicator used by technical analysis. It is possible to follow the trend of financial asset prices and generate support and resistance patterns. In addition, envelopes are a way of tracking volatility in order to identify opportunities to buy and sell these assets. It works on periods longer than the period visible on the chart. All values ​​are available in the form of buffers to simplify possible automations.
FREE
Forex Indicator Arrows
Nguyen Nghiem Duy
1 (1)
Forex Indicator Arrows is an arrow Indicator used as an assistant tool for your trading strategy. The indicator analyzes the standard deviation of bar close for a given period and generates a buy or sell signals if the deviation increases. It good to combo with Martingale EA to follow Trend and Sellect Buy Only/Sell Only for EA work Semi-Automatic. You can use this  Indicator with any EAs in my Products.
FREE
Coral Indi
Dinh Duong Luong
Coral trend is   a trend-following indicator that is widely popular among FOREX traders . It is usually used as a confluence with other indicators. It uses combinations of moving averages with complex smoothing formulas! It has two configurable parameters: Coefficient   - smoothing ratio (*) Applied price Calculation: Coral = (-0.064) * B6 + 0.672 * B5 - 2.352 * B4 + 2.744 * B3
FREE
Follow The Line MT5
Oliver Gideon Amofa Appiah
4.52 (29)
This indicator obeys the popular maxim that: "THE TREND IS YOUR FRIEND" It paints a GREEN line for BUY and also paints a RED line for SELL. (you can change the colors). It gives alarms and alerts of all kinds. IT DOES NOT REPAINT and can be used for all currency pairs and timeframes. Yes, as easy and simple as that. Even a newbie can use it to make great and reliable trades. NB: For best results, get my other premium indicators for more powerful and reliable signals. Get them here: https://www.m
FREE
Der Indikator   "Haven Key Levels PDH PDL"   hilft Tradern dabei, wichtige Schlüssellevels im Chart zu visualisieren. Er markiert automatisch die folgenden Levels: DO (Daily Open)   — Eröffnungslevel des Tages. NYM (New York Midnight)   — Mitternachtslevel von New York. PDH (Previous Day High)   — Höchststand des Vortages. PDL (Previous Day Low)   — Tiefststand des Vortages. WO (Weekly Open)   — Eröffnungslevel der Woche. MO (Monthly Open)   — Eröffnungslevel des Monats. PWH (Previous Week High
FREE
RSI abcd
Francisco Gomes Da Silva
RSI ABCD-Musterfinder: Technische Strategie 1. Funktionsweise des Indikators Kombiniert den klassischen RSI mit automatischer Erkennung von ABCD-Harmonie-Mustern . Hauptkomponenten Standard-RSI (einstellbare Periode) Hoch- und Tiefpunkte-Markierungen (Pfeile) ABCD-Muster (grüne/rote Linien) Überkauft (70) und Überverkauft (30) Filter 2. MT5-Einstellungen period = 14 ; // RSI-Periode size = 4 ; // Maximale Muster-Größe OverBought = 70 ; // Überkauft-Level OverSold = 30 ; // Überverkauft-Level Fil
FREE
Weis Waves RSJ
JETINVEST
4.56 (9)
The Weis Waves RSJ Indicator sums up volumes in each wave. This is how we receive a bar chart of cumulative volumes of alternating waves. Namely the cumulative volume makes the Weis wave charts unique. It allows comparing the relation of the wave sequence characteristics, such as correspondence of the applied force (expressed in the volume) and received result (the price progress). If you still have questions, please contact me by direct message:  https://www.mql5.com/en/users/robsjunqueira/
FREE
Donchian Pro
Paulo Henrique Faquineli Garcia
5 (3)
The Donchian Channel Channels are among the most popular tools of technical analysis, as they visually convey to the analyst the limits within which most price movement tends to occur. Channel users know that valuable information can be obtained at any time, whether prices are in the central region of a band or close to one of the border lines. One of the best known techniques to explore these concepts is Bollinger Bands. However, John Bollinger was not the only one to research the application
FREE
Economic Markers
Flavio Javier Jarabeck
4.79 (14)
Easily get all relevant economic events of the current day right into your chart, as markers. Filter what kind of markers do you want: by country (selected individually) and by Importance (High relevance, Medium, Low or any combination of these). Configure the visual cues to your liking. If there is more than one event set to the very same time, their Names will be stacked and you will see the messages merged with the plus (+) sign on the marker. Obviously that long or too much events on the sam
FREE
Weis Waves
Flavio Javier Jarabeck
2.83 (18)
The original author is David Weis, an expert in the Wyckoff Method. The Weis Wave is a modern adaptation of the 1930's Wyckoff Method, another expert in Tape Reading techniques and Chart Analysis. Weis Waves takes market volume and stacks it into waves according to price conditions giving the trader valuable insights about the market conditions. If you want to learn more about this subject you can find tons of videos in YouTube. Just look for "The Wickoff Method", "Weis Wave" and "Volume Spread
FREE
Stackable VWAP
Flavio Javier Jarabeck
3.5 (4)
Volume Weighted Average Price (VWAP) is a trading benchmark commonly used by Big Players that gives the average price a Symbol has traded throughout the day. It is based on both Volume and price. Additionally we put in this indicator the MVWAP (Moving Volume Weighted Average Price). For those who do not know the usage and the importance od this indicator I recommend a great article about this subject at Investopedia ( https://www.investopedia.com/articles/trading/11/trading-with-vwap-mvwap.asp
FREE
Cybertrade ATR Trend Zone - MT5 The indicator shows, by calculating the ATR (Average True Range), the zone of probable price resistance. Indicated to be used as a probable exit point of an operation. It works on periods longer than the period visible on the chart. All values ​​are available in the form of buffers to simplify possible automations. This indicator is the same one we use in our EA. Also check out our other products.
FREE
APF SuperTrend Light
Humberto Leite Juca
5 (2)
Transform your way of analyzing the market with our innovative trend and support/resistance indicator! By combining the robustness of pivot points, the sensitivity of price adjustment, and the reliability of moving averages, our indicator provides a comprehensive and intuitive view of price behavior. Whether to detect emerging trends, track significant price shifts, or map critical support and resistance zones, this tool is your reliable guide amidst market volatility (BMF WIN). T ested for B
FREE
Bounce Zone MT5
Nguyen Thanh Cong
4.43 (7)
Introduction The Bounce Zone indicator is a cutting-edge non-repainting technical tool built to identify key areas on the price chart where market sentiment is likely to cause a significant price reversal. Using advanced algorithms and historical price data analysis, this indicator pinpoints potential bounce zones. Combined with other entry signal, this indicator can help forex traders place the best trades possible Signal A possible buy signal is generated when price is in the green zone an
FREE
Willkommen zu unserem   Preiswellenmuster   MT5 – (ABCD-Muster) – Das ABCD-Muster ist ein leistungsstarkes und weit verbreitetes Handelsmuster in der Welt der technischen Analyse. Es handelt sich um ein harmonisches Preismuster, das Händler nutzen, um potenzielle Kauf- und Verkaufschancen auf dem Markt zu identifizieren. Mit dem ABCD-Muster können Händler potenzielle Preisbewegungen vorhersehen und fundierte Entscheidungen darüber treffen, wann sie Geschäfte eingehen und beenden. EA Version:  
FREE
LT Donchian Channel
Thiago Duarte
4.83 (6)
Donchian Channel is an indicator created by Richard Donchian. It is formed by taking the highest high and the lowest low of the last specified period in candles. The area between high and low is the channel for the chosen period. Its configuration is simple. It is possible to have the average between the upper and lower lines, plus you have alerts when price hits one side. If you have any questions or find any bugs, please contact me. Enjoy!
FREE
RFOC Mini Chart
Ronaldo Franco De Oliveira Cardoso
The RFOC Mini Chart was created to project a macro view of the market, which the option to select the timeframe of interest other than the main chart, it is possible to include 2 indicators: 1 - Moving average channel On the mini chart, the moving average will be created based on the prices of the selected time frame for the RFOC Mini Chart. The moving average period must be selected in the indicator settings pannel. 2 - Boillinger Band In the mini chart, a boillinger band will be created based
FREE
Arrows Cleaner
Flavio Javier Jarabeck
5 (3)
For those who use the Trading Arrows on the chart for later study, but use the Triple Screen approach and got all those arrows everywhere on all additional charts, here it is: Arrows Cleaner! Just drop it on the chart and leave it there. When needed, just with 1-click you get rid of all those annoying arrows... SETTINGS You can position the little Button on any corner of the chart. Additionally you can displace it with the Offset settings. You can enlarge or shrink its size, as well as the text
FREE
Quantitative Candlesticks Qstick
Flavio Javier Jarabeck
4 (2)
Qstick is a way to objectively quantify candlestick analysis and improve the interpretation of candlestick patterns. Qstick was developed by Tushar Chande and published in his book " The New Technical Trader - Boost Your Profit by Plugging Into the Latest Indicators (1994) ". Qstick is built based on a moving average of the difference between the Open and Close prices. The basis of the idea is that the Opening and Closing prices are the heart of candlestick analysis. We strongly recommend the re
FREE
Money Flow Index EA Friendly
Flavio Javier Jarabeck
3.67 (3)
The traditional Money Flow Index indicator, this time, EA friendly . There are 3 buffers exposed that can be used by EAs to automatically analyze the Overbought and Oversold conditions of the quote. Just use the traditional iCustom() function to get these signals. This Money Flow Index calculation is based on the traditional Metaquote's MFI indicator. SETTINGS MFI Period Volume type to analyze (Real Volume or Ticks) Starting Overbought region Starting Oversold region USING WITH EAs Buffer #0: 
FREE
Spike Catch Pro
Amani Fungo
4.14 (7)
Spike Catch Pro 22:03 release updates Advanced engine for searching trade entries in all Boom and Crash pairs (300,500 and 1000) Programmed strategies improvements Mx_Spikes (to combine Mxd,Mxc and Mxe), Tx_Spikes,   RegularSpikes,   Litho_System,   Dx_System,   Md_System,   MaCross,   Omx_Entry(OP),  Atx1_Spikes(OP),   Oxc_Retracement (AT),M_PullBack(AT) we have added an arrow on strategy identification, this will help also in the visual manual backtesting of the included strategies and see ho
FREE
Are you tired of drawing trendlines every time you're analyzing charts? Or perhaps you would like more consistency in your technical analysis. Then this is for you. This indicator will draw trend lines automatically when dropped on a chart. How it works Works similar to standard deviation channel found on mt4 and mt5. It has 2 parameters: 1. Starting Bar 2. Number of bars for calculation The   starting bar   is the bar which drawing of the trend lines will begin, while the   number of bars for c
FREE
Renko Box
Andrey Dik
5 (1)
Description. The basis for the formation of the Renko chart is the price range. If the price goes beyond its limits, the chart shows a box above or below the previous one. As a result, we see price movement without additional "noise" and important support and resistance levels. Features. For use in conjunction with the Expert Advisor, an additional buffer is implemented-a box counter. For convenience and to increase the speed of testing, the user can use the "new box" event, which the indicator
FREE
Aggression Volume
Flavio Javier Jarabeck
4.2 (15)
Aggression Volume Indicator is the kind of indicator that is rarely found in the MQL5 community because it is not based on the standard Volume data provided by the Metatrader 5 platform. It requires the scrutiny of all traffic Ticks requested on the platform... That said, Aggression Volume indicator requests all Tick Data from your Broker and processes it to build a very special version of a Volume Indicator, where Buyers and Sellers aggressions are plotted in a form of Histogram. Additionally,
FREE
The indicator highlights the points that a professional trader sees in ordinary indicators. VisualVol visually displays different volatility indicators on a single scale and a common align. Highlights the excess of volume indicators in color. At the same time, Tick and Real Volume, Actual range, ATR, candle size and return (open-close difference) can be displayed. Thanks to VisualVol, you will see the market periods and the right time for different trading operations. This version is intended f
FREE
Free automatic Fibonacci is an indicator that automatically plots a Fibonacci retracement based on the number of bars you select on the BarsToScan setting in the indicator. The Fibonacci is automatically updated in real time as new highest and lowest values appears amongst the selected bars. You can select which level values to be displayed in the indicator settings. You can also select the color of the levels thus enabling the trader to be able to attach the indicator several times with differe
FREE
Käufer dieses Produkts erwarben auch
Trend Screener Pro MT5
STE S.S.COMPANY
4.85 (82)
Nutzen Sie die Macht des Trendhandels mit Trend Screener Indicator: Ihrer ultimativen Trendhandelslösung, die auf Fuzzy-Logik und einem System mit mehreren Währungen basiert! Steigern Sie Ihren Trendhandel mit Trend Screener, dem revolutionären Trendindikator mit Fuzzy-Logik. Es handelt sich um einen leistungsstarken Trendfolgeindikator, der über 13 Premium-Tools und -Funktionen sowie 3 Handelsstrategien kombiniert und ihn zu einer vielseitigen Wahl macht, um Ihren Metatrader in einen Trendanaly
Algo Pumping
Ihor Otkydach
5 (11)
PUMPING STATION – Ihre persönliche „All-inclusive“-Strategie Wir präsentieren Ihnen PUMPING STATION – einen revolutionären Forex-Indikator, der Ihr Trading in eine spannende und effektive Erfahrung verwandeln wird. Es handelt sich nicht nur um ein Hilfsmittel, sondern um ein vollwertiges Handelssystem mit leistungsstarken Algorithmen, die Ihnen helfen, stabiler zu traden. Beim Kauf dieses Produkts erhalten Sie KOSTENLOS: Exklusive Set-Dateien: Für automatische Einrichtung und maximale Leistung.
Golden Trend Indicator MT5
Noha Mohamed Fathy Younes Badr
4.89 (18)
Golden Trend indicator  is The best indicator for predicting trend movement this indicator never lags and never repaints and never back paints    and give  arrow buy and sell    before the candle appear  and it will help you and  will make your trading decisions clearer its work on all currencies and  gold and crypto and all time frame This unique  indicator uses very secret algorithms to catch the  trends, so you can trade using this indicator and see the trend clear on charts  manual guide and
Divergence Bomber
Ihor Otkydach
5 (2)
Jeder Käufer dieses Indikators erhält zusätzlich kostenlos: Das exklusive Tool „Bomber Utility“, das jede Handelsposition automatisch begleitet, Stop-Loss- und Take-Profit-Niveaus setzt und Trades gemäß den Regeln der Strategie schließt Set-Dateien zur Konfiguration des Indikators für verschiedene Handelsinstrumente Set-Dateien zur Konfiguration des Bomber Utility in den Modi: „Minimales Risiko“, „Ausgewogenes Risiko“ und „Abwartende Strategie“ Ein Schritt-für-Schritt-Videohandbuch, das Ihnen hi
MonetTrend — Премиум-индикатор для торговли по тренду (M30, H1, H4) MonetTrend — это мощный и визуально понятный трендовый индикатор, созданный для торговли на таймфреймах M30, H1 и H4. Он идеально подходит для работы с волатильными инструментами, такими как: • Золото (XAUUSD) • Криптовалюты (BTCUSD) • Валютные пары (EURUSD, USDJPY и др.) Ключевые особенности MonetTrend: • Автоматическое отображение Take Profit 1 (TP1) и Stop Loss (SL): После появления сигнала индикатор сразу показывает: • TP
Support And Resistance Screener ist ein Level-Indikator für MetaTrader, der mehrere Tools innerhalb eines Indikators bietet. Die verfügbaren Werkzeuge sind: 1. Marktstruktur-Screener. 2. Bullische Pullback-Zone. 3. Bärische Pullback-Zone. 4. Tägliche Pivot-Punkte 5. wöchentliche Pivots-Punkte 6. monatliche Pivots-Punkte 7. Starke Unterstützung und Widerstand basierend auf harmonischem Muster und Volumen. 8. Zonen auf Bankebene. ZEITLICH BEGRENZTES ANGEBOT: HV Support and Resistance Indicator ist
TPSpro RFI Levels MT5
Roman Podpora
4.55 (20)
Umkehrzonen / Spitzenvolumina / Aktive Zonen eines Hauptakteurs = TS TPSPROSYSTEM ANLEITUNG RUS    /    ANWEISUNGEN     ENG          /          Version MT4      Jeder Käufer dieses Indikators erhält zusätzlich KOSTENLOS: 6 Monate Zugriff auf Handelssignale vom Dienst RFI SIGNALS – vorgefertigte Einstiegspunkte gemäß dem TPSproSYSTEM-Algorithmus. Schulungsmaterialien mit regelmäßigen Updates – tauchen Sie in die Strategie ein und steigern Sie Ihr berufliches Niveau. 24/5-Support an Wochentagen u
FX Volume MT5
Daniel Stein
4.82 (17)
FX Volume: Erleben Sie den echten Marktüberblick aus der Sicht eines Brokers Kurzüberblick Möchten Sie Ihre Handelsstrategie auf das nächste Level bringen? FX Volume liefert Ihnen Echtzeit-Einblicke in die Positionierung von Retail-Tradern und Brokern — lange bevor verzögerte Berichte wie der COT verfügbar sind. Ob Sie nach beständigen Gewinnen streben oder einfach einen tieferen Vorteil am Markt suchen, FX Volume hilft Ihnen, große Ungleichgewichte zu erkennen, Breakouts zu bestätigen und Ihr
NOTE: CYCLEMAESTRO is distributed only on this website, there are no other distributors. Demo version is for reference only and is not supported. Full versione is perfectly functional and it is supported. CYCLEMAESTRO , the first and only indicator of Cyclic Analysis, useful for giving signals of TRADING, BUY, SELL, STOP LOSS, ADDING. Created on the logic of   Serghei Istrati   and programmed by   Stefano Frisetti ;   CYCLEMAESTRO   is not an indicator like the others, the challenge was to inter
RelicusRoad Pro MT5
Relicus LLC
4.78 (18)
Jetzt 147 US -Dollar (nach ein paar Aktualisierungen auf 499 US -Dollar) - Unbegrenzte Konten (PCs oder MACs) RelicusRoad Benutzerhandbuch + Schulungsvideos + Zugang zur privaten Discord-Gruppe + VIP-Status EINE NEUE ART, DEN MARKT ZU BETRACHTEN RelicusRoad ist der weltweit leistungsstärkste Handelsindikator für Forex, Futures, Kryptowährungen, Aktien und Indizes und gibt Händlern alle Informationen und Tools, die sie benötigen, um profitabel zu bleiben. Wir bieten technische Analysen und Ha
Gold Stuff mt5
Vasiliy Strukov
4.93 (178)
Gold Stuff mt5-Ein Trendindikator, der speziell für Gold entwickelt wurde, kann auch auf allen Finanzinstrumenten verwendet werden. Der Indikator wird nicht neu gezeichnet und verzögert sich nicht. Empfohlener Zeitrahmen H1. WICHTIG! Kontaktieren Sie mich sofort nach dem Kauf, um Anweisungen und Bonus zu erhalten!     Sie können eine kostenlose Kopie unseres Strong Support- und Trendscanner-Indikators erhalten, bitte senden Sie uns eine persönliche Nachricht. Mich! DATEN Draw Arrow - inkl.a
MetaForecast M5
Vahidreza Heidar Gholami
5 (3)
MetaForecast prognostiziert und visualisiert die Zukunft eines beliebigen Marktes basierend auf den Harmonien in den Preisdaten. Obwohl der Markt nicht immer vorhersehbar ist, kann MetaForecast, wenn es ein Muster im Preis gibt, die Zukunft so genau wie möglich voraussagen. Im Vergleich zu ähnlichen Produkten kann MetaForecast durch die Analyse von Markttrends genauere Ergebnisse erzeugen. Eingabeparameter Past size (Vergangene Größe) Gibt an, wie viele Balken MetaForecast verwendet, um ein Mod
FX Power MT5 NG
Daniel Stein
5 (15)
FX Power: Analysieren Sie die Stärke von Währungen für intelligentere Handelsentscheidungen Übersicht FX Power ist Ihr unverzichtbares Werkzeug, um die tatsächliche Stärke von Währungen und Gold unter allen Marktbedingungen zu verstehen. Indem Sie starke Währungen kaufen und schwache verkaufen, vereinfacht FX Power Ihre Handelsentscheidungen und deckt Chancen mit hoher Wahrscheinlichkeit auf. Ob Sie Trends folgen oder extreme Delta-Werte nutzen, um Umkehrungen zu prognostizieren, dieses Tool p
Quantum TrendPulse
Bogdan Ion Puscasu
5 (13)
Wir stellen   Quantum TrendPulse   vor, das ultimative Handelstool, das die Leistung von   SuperTrend   ,   RSI   und   Stochastic   in einem umfassenden Indikator vereint, um Ihr Handelspotenzial zu maximieren. Dieser Indikator wurde für Händler entwickelt, die Präzision und Effizienz suchen, und hilft Ihnen dabei, Markttrends, Momentumverschiebungen und optimale Ein- und Ausstiegspunkte sicher zu erkennen. Hauptmerkmale: SuperTrend-Integration:   Folgen Sie problemlos dem vorherrschenden Markt
MONEYTRON – ТВОЙ ЛИЧНЫЙ СИГНАЛ НА УСПЕХ! XAUUSD | AUDUSD | USDJPY | BTCUSD Поддержка таймфреймов: M5, M15, M30, H1 Почему трейдеры выбирают Moneytron? 82% успешных сделок — это не просто цифры, это результат продуманной логики, точного алгоритма и настоящей силы анализа. Автоматические сигналы на вход — не нужно гадать: когда покупать, когда продавать. 3 уровня Take Profit — ты сам выбираешь свой уровень прибыли: безопасный, уверенный или максимум. Четкий Stop Loss — контролируешь риск
Die beste Lösung für jeden Newbie oder Expert Trader! Dieser Indikator ist ein einzigartiges, qualitativ hochwertiges und erschwingliches Trading-Tool, da wir eine Reihe von proprietären Funktionen und eine neue Formel integriert haben. Mit nur EINEM Chart können Sie die Währungsstärke für 28 Forex-Paare ablesen! Stellen Sie sich vor, wie sich Ihr Handel verbessern wird, weil Sie in der Lage sind, den genauen Auslösungspunkt eines neuen Trends oder einer Scalping-Gelegenheit zu erkennen. Benu
Atomic Analyst MT5
Issam Kassas
4.32 (19)
Zunächst einmal ist es erwähnenswert, dass dieser Handelsindikator nicht neu malt, nicht neu zeichnet und keine Verzögerung aufweist, was ihn sowohl für manuellen als auch für Roboterhandel ideal macht. Benutzerhandbuch: Einstellungen, Eingaben und Strategie. Der Atom-Analyst ist ein PA-Preisaktionsindikator, der die Stärke und das Momentum des Preises nutzt, um einen besseren Vorteil auf dem Markt zu finden. Ausgestattet mit fortschrittlichen Filtern, die helfen, Rauschen und falsche Signale z
CBT Quantum Maverick Hocheffizientes Binäroptionshandelssystem CBT Quantum Maverick ist ein leistungsstarkes Handelssystem für Binäroptionen, das für Händler entwickelt wurde, die Präzision, Einfachheit und diszipliniertes Handeln suchen. Keine Anpassung erforderlich – das System ist von Anfang an optimiert. Mit etwas Übung sind die Signale leicht zu beherrschen. Hauptmerkmale: Präzise Signale: Handelssignale basierend auf der aktuellen Kerze, die auf die nächste Kerze abzielen, ohne häufige N
Matrix Arrow Indicator MT5
Juvenille Emperor Limited
5 (13)
Matrix Arrow Indicator MT5   ist ein einzigartiger 10-in-1-Trend, der zu   100 % nicht neu gezeichnet   werden kann. Multi-Timeframe-Indikator, der für alle Symbole/Instrumente verwendet werden kann:   Forex ,   Rohstoffe ,   Kryptowährungen ,   Indizes ,   Aktien .  Der  Matrix Arrow Indicator MT5  wird den aktuellen Trend in seinen frühen Stadien bestimmen und Informationen und Daten von bis zu 10 Standardindikatoren sammeln, die sind: Durchschnittlicher Richtungsbewegungsindex (ADX) Rohstoff
Grabber System MT5
Ihor Otkydach
5 (5)
Ich präsentiere Ihnen den hervorragenden technischen Indikator Grabber, der als eine vollständig einsatzbereite „All-Inclusive“-Handelsstrategie funktioniert. In einem einzigen Code sind leistungsstarke Werkzeuge zur technischen Marktanalyse, Handelssignale (Pfeile), Alarmfunktionen und Push-Benachrichtigungen integriert. Jeder Käufer dieses Indikators erhält zusätzlich kostenlos: Grabber Utility: ein Tool zur automatischen Verwaltung offener Orders Schritt-für-Schritt-Videoanleitung: wie man de
TPSproTREND PrO MT5
Roman Podpora
4.72 (18)
VERSION MT4        —        ИНСТРУКЦИЯ RUS           —        INSTRUCTIONS  ENG Hauptfunktionen: Präzise Eingangssignale OHNE RENDERING! Wenn ein Signal erscheint, bleibt es relevant! Dies ist ein wichtiger Unterschied zu Redraw-Indikatoren, die ein Signal liefern und es dann ändern können, was zu einem Verlust des eingezahlten Geldes führen kann. Jetzt können Sie mit größerer Wahrscheinlichkeit und Genauigkeit in den Markt eintreten. Es gibt auch eine Funktion zum Einfärben der Kerzen nach dem
Auto Order Block with break of structure based on ICT and Smart Money Concepts (SMC) Futures Break of Structure ( BoS )             Order block ( OB )            Higher time frame Order block / Point of Interest ( POI )    shown on current chart           Fair value Gap ( FVG ) / Imbalance   -  MTF      ( Multi Time Frame )    HH/LL/HL/LH  -  MTF      ( Multi Time Frame )  Choch  MTF      ( Multi Time Frame )  Volume Imbalance     ,  MTF          vIMB Gap’s Power of 3 Equal High / Low’s  
Gold Trend 5
Sergei Linskii
3.5 (2)
Gold Trend - dies ist ein guter technischer Indikator für Aktien. Der Algorithmus des Indikators analysiert die Preisbewegung eines Vermögenswerts und spiegelt die Volatilität und mögliche Einstiegszonen wider. Die besten Indikatorsignale: - Für VERKAUFEN = rotes Histogramm + roter SHORT-Zeiger + gelber Signalpfeil in dieselbe Richtung. - Für KAUFEN = blaues Histogramm + blauer LONG-Zeiger + aquafarbener Signalpfeil in dieselbe Richtung. Vorteile des Indikators: 1. Der Indikator erzeugt S
Dieses Dashboard zeigt die   neuesten verfügbaren harmonischen   Muster für die ausgewählten Symbole, so dass Sie Zeit sparen und effizienter sein werden /   MT4-Version . Kostenloser Indikator:   Basic Harmonic Pattern Spalten des Indikators Symbol:   die ausgewählten Symbole werden angezeigt Trend:   bullish oder bearish Pattern :   Art des Musters (Gartley, Schmetterling, Fledermaus, Krabbe, Hai, Cypher oder ABCD) Entry :   Einstiegskurs SL:   Stop-Loss-Kurs TP1:   1. Take-Profit-Kurs TP2
Zunächst einmal ist es wichtig zu betonen, dass dieses Handelstool ein Nicht-Repaint-, Nicht-Redraw- und Nicht-Verzögerungsindikator ist, was es ideal für professionelles Trading macht. Online-Kurs, Benutzerhandbuch und Demo. Der Smart Price Action Concepts Indikator ist ein sehr leistungsstarkes Werkzeug sowohl für neue als auch erfahrene Händler. Er vereint mehr als 20 nützliche Indikatoren in einem und kombiniert fortgeschrittene Handelsideen wie die Analyse des Inner Circle Traders und Str
Black Dragon indicator mt5
Ramil Minniakhmetov
4.84 (61)
Der Trenderkennungsindikator ergänzt jede Strategie und kann auch als unabhängiges Werkzeug verwendet werden. Vorteile Einfach zu bedienen, überfrachtet das Diagramm nicht mit unnötigen Informationen; Kann als Filter für jede Strategie verwendet werden; Verfügt über eingebaute dynamische Unterstützungs- und Widerstandsebenen, die sowohl zur Gewinnmitnahme als auch zum Setzen von Stop-Loss verwendet werden können; Der Indikator ändert seine Farbe nicht, nachdem die Kerze geschlossen wurde;  F
FX Levels MT5
Daniel Stein
5 (4)
FX Levels: Außerordentlich präzise Unterstützungs- und Widerstandszonen für alle Märkte Kurzüberblick Suchen Sie eine verlässliche Methode, um Support- und Resistance-Level in jedem Markt zu identifizieren—egal ob Währungspaare, Indizes, Aktien oder Rohstoffe? FX Levels vereint die traditionelle „Lighthouse“-Methode mit einem modernen dynamischen Ansatz und bietet nahezu universelle Genauigkeit. Durch unsere Erfahrung mit echten Brokern sowie automatischen täglichen und Echtzeit-Updates hilft
Wir stellen vor       Quantum Breakout PRO   , der bahnbrechende MQL5-Indikator, der die Art und Weise, wie Sie mit Breakout-Zonen handeln, verändert! Entwickelt von einem Team erfahrener Händler mit über 13 Jahren Handelserfahrung,       Quantum Breakout PRO       ist darauf ausgelegt, Ihre Handelsreise mit seiner innovativen und dynamischen Breakout-Zone-Strategie auf ein neues Niveau zu heben. Der Quantum Breakout Indicator zeigt Ihnen Signalpfeile auf Breakout-Zonen mit 5 Gewinnzielzonen u
*** Entry In The Zone und SMC Multi Timeframe ist ein Echtzeit-Marktanalyse-Tool, das auf dem Smart Money Concept (SMC) basiert. Es integriert effektiv Umkehrsignale und identifiziert automatisch wichtige Umkehrzonen durch Multi-Timeframe-Strukturerkennung sowie die Identifizierung von Points of Interest (POI). Dieses Tool wurde entwickelt, um Händlern zu helfen, mit mehr Vertrauen und einem strukturierten Ansatz zu planen und Entscheidungen zu treffen. *** Funktionen: - Automatische Markstruktu
Suchen Sie nach einem leistungsstarken Indikator für den Devisenhandel, der Ihnen dabei helfen kann, profitable Handelsmöglichkeiten mit Leichtigkeit zu erkennen? Suchen Sie nicht weiter als das Beast Super Signal. Dieser benutzerfreundliche trendbasierte Indikator überwacht kontinuierlich die Marktbedingungen, sucht nach neuen sich entwickelnden Trends oder springt auf bestehende Trends ein. Das Beast Super Signal gibt ein Kauf- oder Verkaufssignal, wenn alle internen Strategien aufeinander abg
Weitere Produkte dieses Autors
Watermark Label Genestra
Renato Genestra Martins
This indicator creates a watermark with the asset symbol (e.g., BTCUSD) in the center of the MetaTrader 5 chart. The text is displayed in Arial Black sans-serif font, with customizable size, color, and opacity through indicator settings. The watermark stays centered both horizontally and vertically on the chart, remaining behind candles and other elements to avoid interfering with visualization. By default, it uses light gray color with 30% opacity, creating a subtle effect that helps quickly id
FREE
Three Dragons Genestra
Renato Genestra Martins
The THREE DRAGONS is a technical indicator that portrays three mystical Chinese dragons flying through the price chart: 1. The Green Dragon (SeaGreen): - The most agile and fastest of the three - Reacts quickly to market direction changes - Usually leads the movements 2. The Red Dragon (Tomato): - Moves with balance between speed and caution - Confirms movements initiated by the Green Dragon - Its interactions with the Green Dragon may indicate opportunities 3. The Black Dragon (Black): - Th
FREE
Auswahl:
Keine Bewertungen
Antwort auf eine Rezension