Ichimoku Stage 2
- Experten
- Mangaliso Mashiya
- Version: 1.0
- Aktivierungen: 5
This is the tried and tested Ichimoku Kinko Hyo strategy in the form of an expert advisor. This expert advisor makes use of institutional grade portfolio management. More specifically, it uses Value at risk (VaR) to determine whether an additional position should be opened or not.
Value at Risk (VaR) is a statistical measure used in portfolio management to estimate the potential loss in value of a portfolio over a specified time period, given a certain confidence level. It quantifies the maximum expected loss under normal market conditions, helping investors understand and manage risk. If the value at risk exceeds a certain threshold, a potential position (in addition to one that is currently open) will not be opened.
In addition to the institutional grade portfolio management feature, this expert advisor makes use of a trailing "stealth stoploss". The idea behind this is to have a virtual stoploss that follows price movements and is not visible to other market participants (especially the broker) as it is not unheard of for brokers to manipulate stop losses. And so if you don't see a physical stoploss on the screen, that is why.
The Ichimoku Kinko Hyo trading strategy is a comprehensive technical analysis tool that provides insights into market trends, momentum, support/resistance levels, and potential entry/exit points. It consists of five key components:
-
Tenkan-Sen (Conversion Line): A short-term moving average, indicating short-term momentum.
-
Kijun-Sen (Base Line): A medium-term moving average, acting as a support/resistance level and trend indicator.
-
Senkou Span A (Leading Span A): The midpoint between Tenkan-Sen and Kijun-Sen, projected 26 periods ahead, forming one edge of the "Kumo" (cloud).
-
Senkou Span B (Leading Span B): A long-term moving average, projected 26 periods ahead, forming the other edge of the Kumo.
-
Chikou Span (Lagging Span): The current closing price plotted 26 periods behind, used to confirm trends.
Key Signals:
-
Trend Direction: Price above the Kumo indicates an uptrend; below suggests a downtrend.
-
Momentum: Tenkan-Sen crossing above/below Kijun-Sen signals potential buy/sell opportunities.
-
Support/Resistance: The Kumo acts as dynamic support/resistance. A thicker cloud indicates stronger support/resistance.
-
Confirmation: Chikou Span above/below price confirms bullish/bearish sentiment.
This strategy is versatile, offering a holistic view of the market, and is used across various timeframes.
Settings:
Magic Number - the unique magic number used to distinguish the expert advisor from others
Lot Mode - this determines the position sizing method:
Fixed Lots - the position is set according to the desired lots and will be fixed
Money - Sets the amount of money to be risked per trade (in account currency)
Lots Based on % of Account - The amount risked per trade will be a specified percentage based on the account size. e.g if account size = $1000 and percent = 2 (only enter the number without '%' character), then amount risked per trade = $20
lots / money / percent - sets the amount to be risked based on the Lot Mode
TenKan-sen - sets the look back period of the Tenkan-sen line
Kijun-sen - sets the look back period of the Kijun-sen line
Senkou Span B - sets the look back period of the Senkou Span B line
Symbols to trade - enter the desired symbol e.g EURUSD. Multi-symbol functionality is supported. To trade multiple symbols, enter a list of symbols separated by the '|' character. e.g EURUSD|USDJPY|XAUSUD
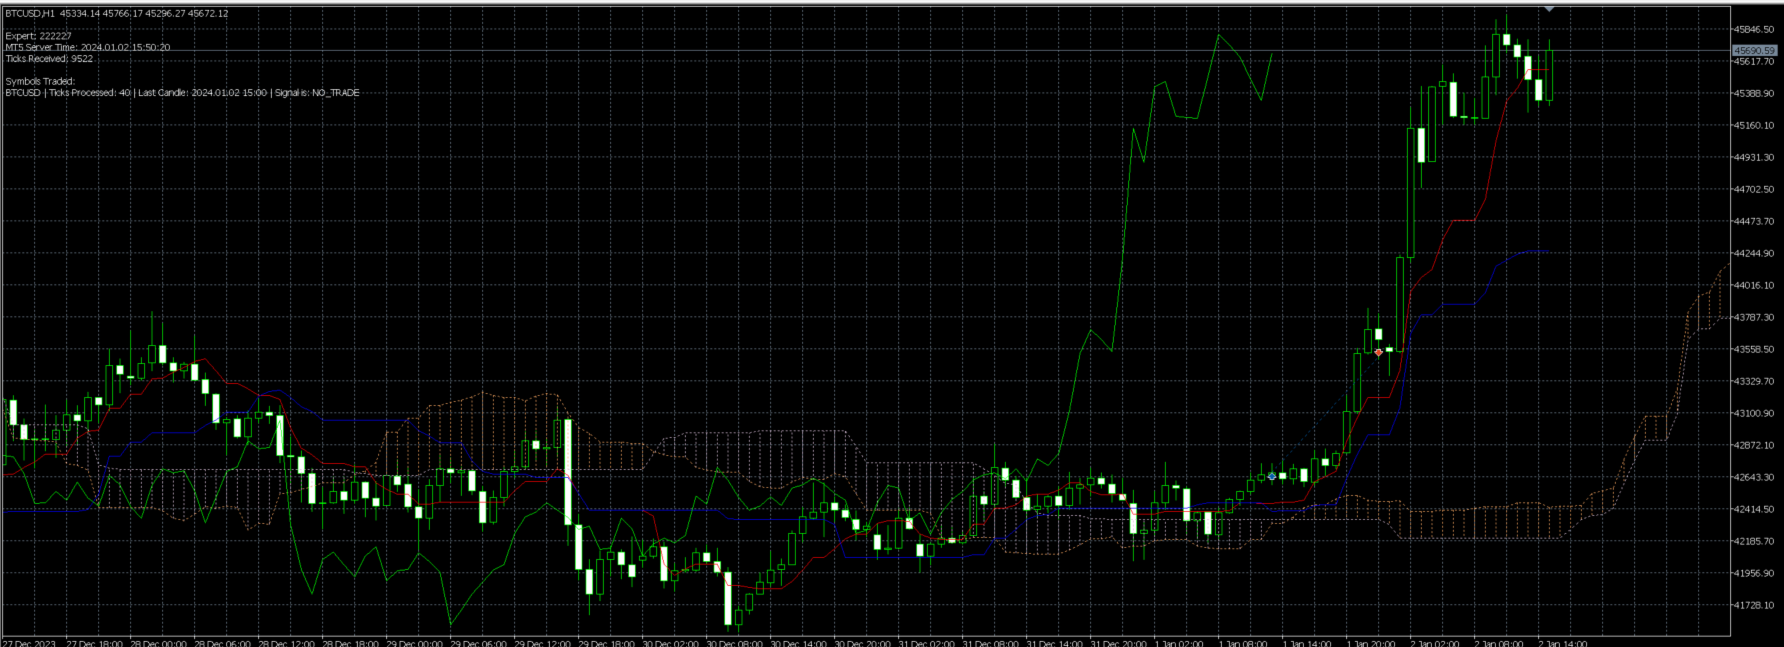
Screenshots shown are for the BTCUSD (Bitcoin) symbol on the 1H time frame. Feel free to play around with different time frames and symbols.