Optimum Points MT5
- Indikatoren
- Yuriy Lyachshenko
- Version: 1.0
- Aktivierungen: 10
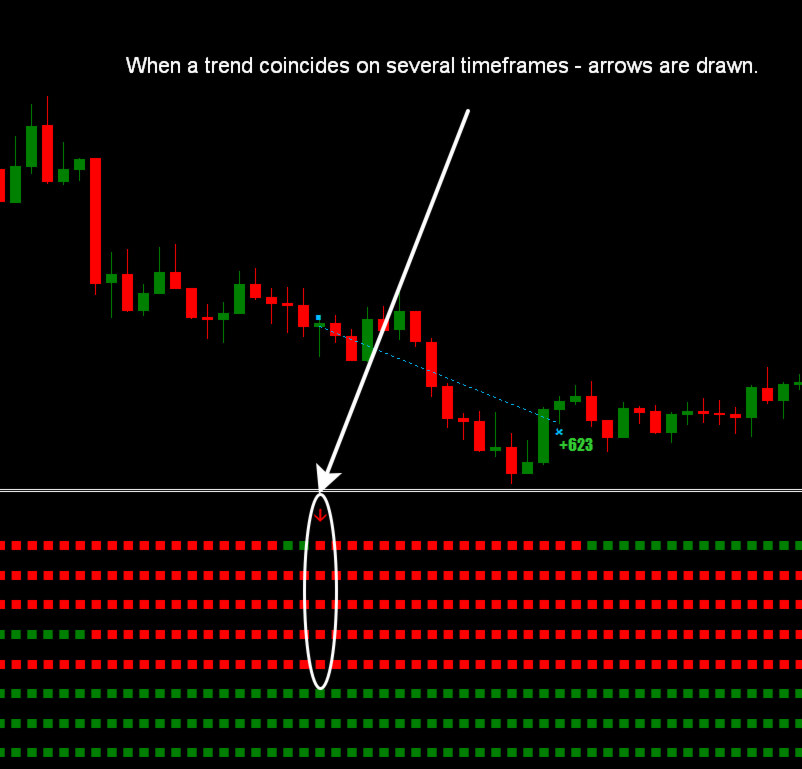
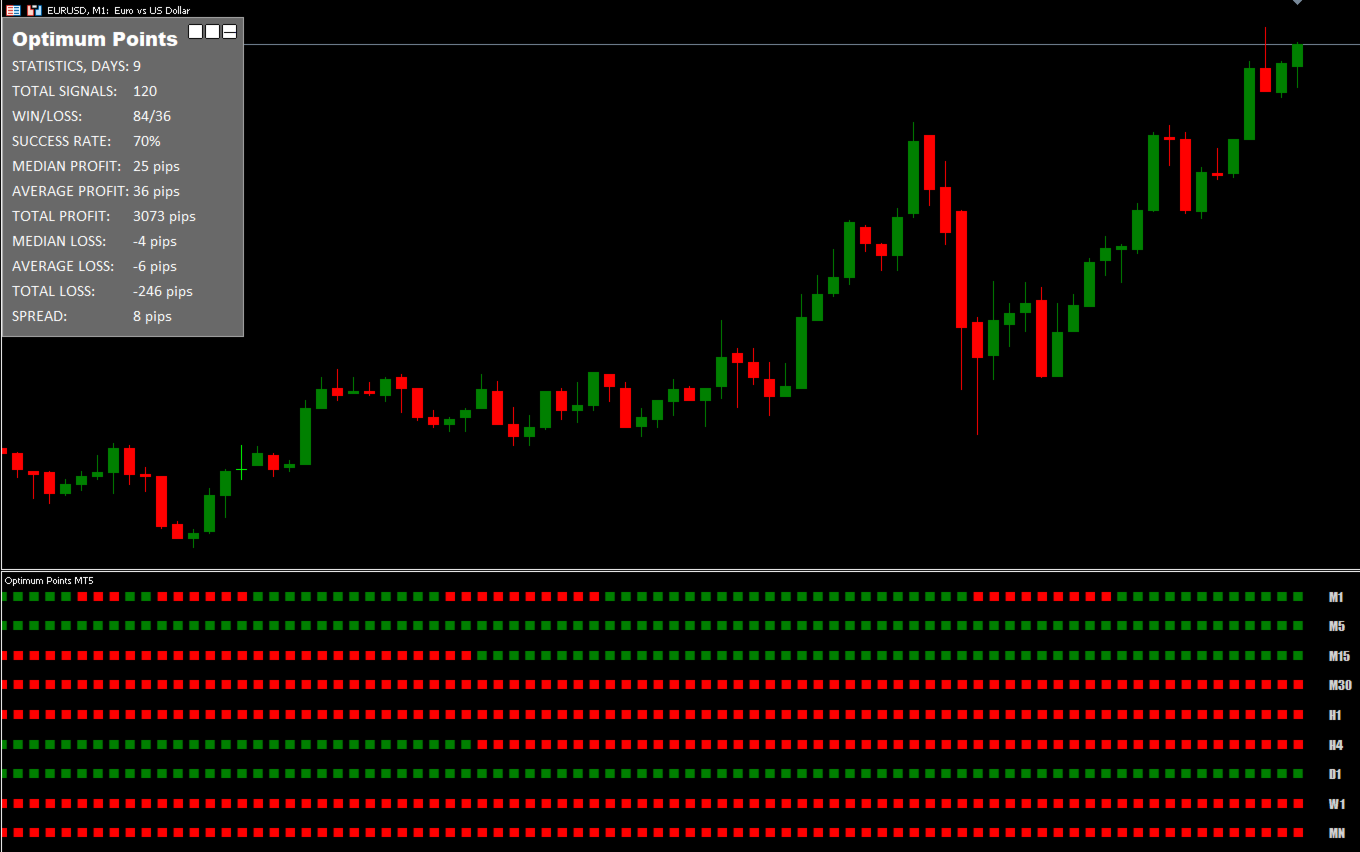
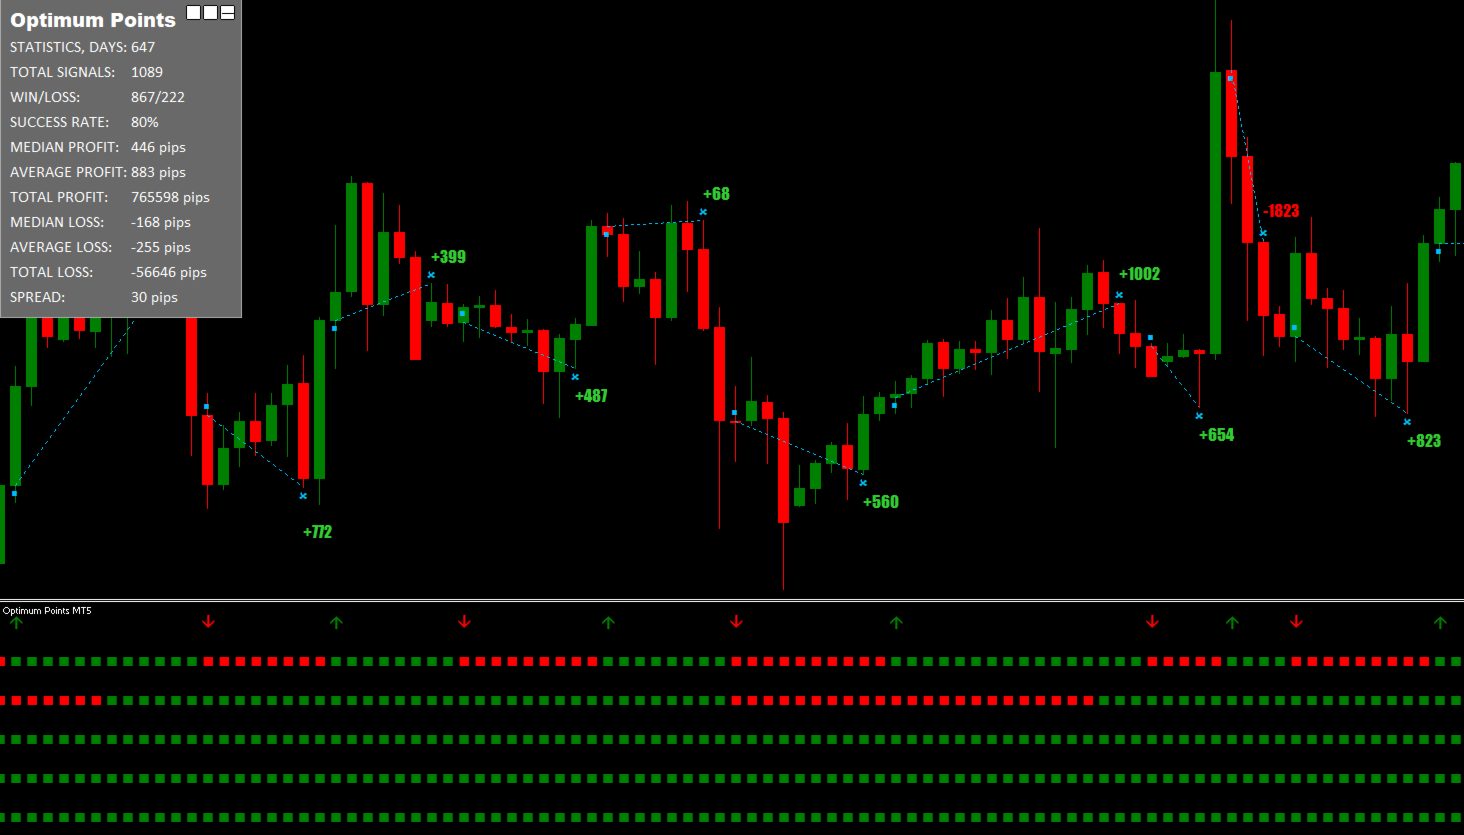
Der Indikator zeigt die Trendrichtung von mehreren Zeitrahmen in einem Fenster an. Wenn der Trend aus mehreren Zeitrahmen übereinstimmt, werden Pfeile eingezeichnet. Sie können auch zum Histogramm wechseln, das den Trend im aktuellen Zeitrahmen anzeigt.
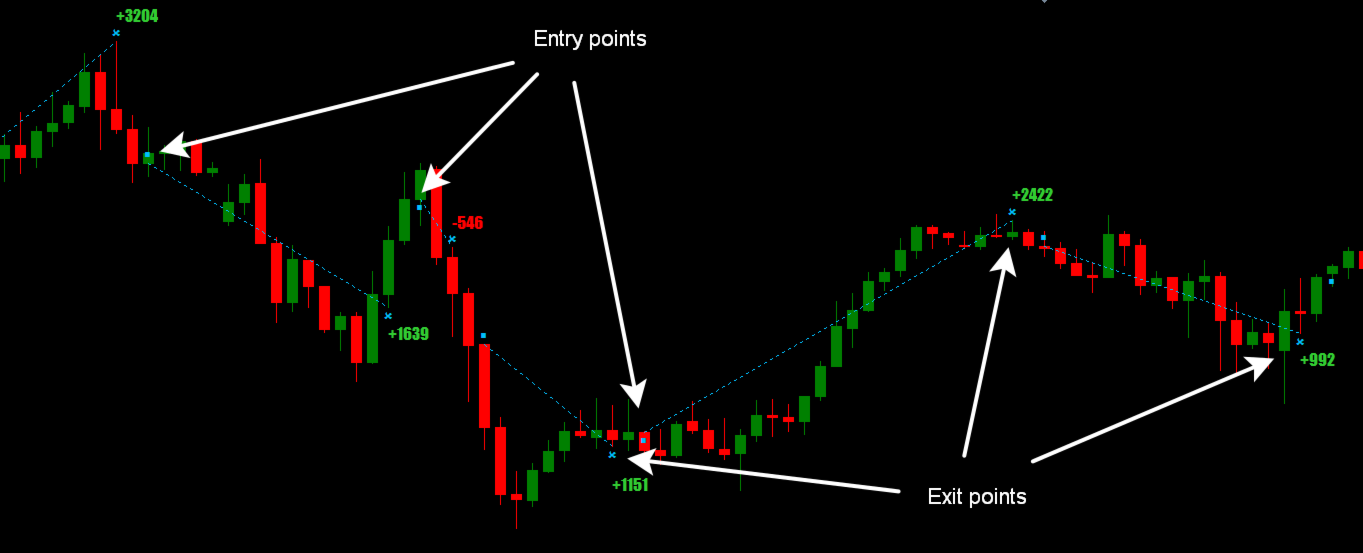
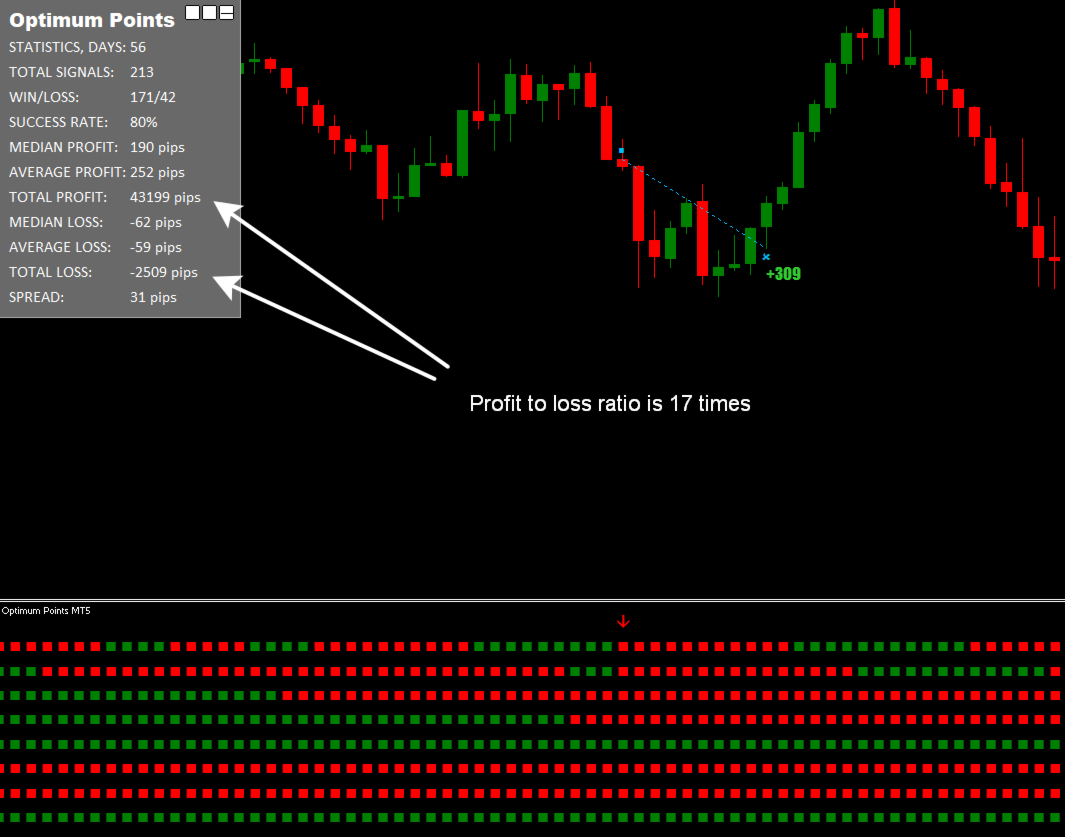
Der Indikator zeichnet Einstiegspunkte und ungefähre Ausstiegspunkte auf dem Chart ein.
Achtung: Da der Indikator mehrere Zeitrahmen umfasst, sollten bei der Verwendung im Strategietester die Kurse für alle erforderlichen Zeitrahmen im Voraus heruntergeladen werden. Um nicht lange auf das Herunterladen von Kursen im Tester zu warten, können Sie das Startdatum 2025.01.01 und das Modell „Open price only“ oder „Control points“ einstellen.
Eigenschaften
- Dieser Indikator wird nicht neu gezeichnet. Was auf dem historischen Chart angezeigt wird, wird in Echtzeit angezeigt.
- Er kann für den Handel mit beliebigen Vermögenswerten verwendet werden: Kryptowährungen, Aktien, Metalle, Indizes, Rohstoffe und Währungen.
- Funktioniert mit allen Zeitfenstern.
- Signale für den Einstieg erscheinen bei der Eröffnung einer neuen Kerze und werden nicht neu gezeichnet.
- Signale für den Ausstieg aus einem Geschäft werden vorsorglich gegeben, denn oft kann man ein Geschäft mit mehr Gewinn abschließen.
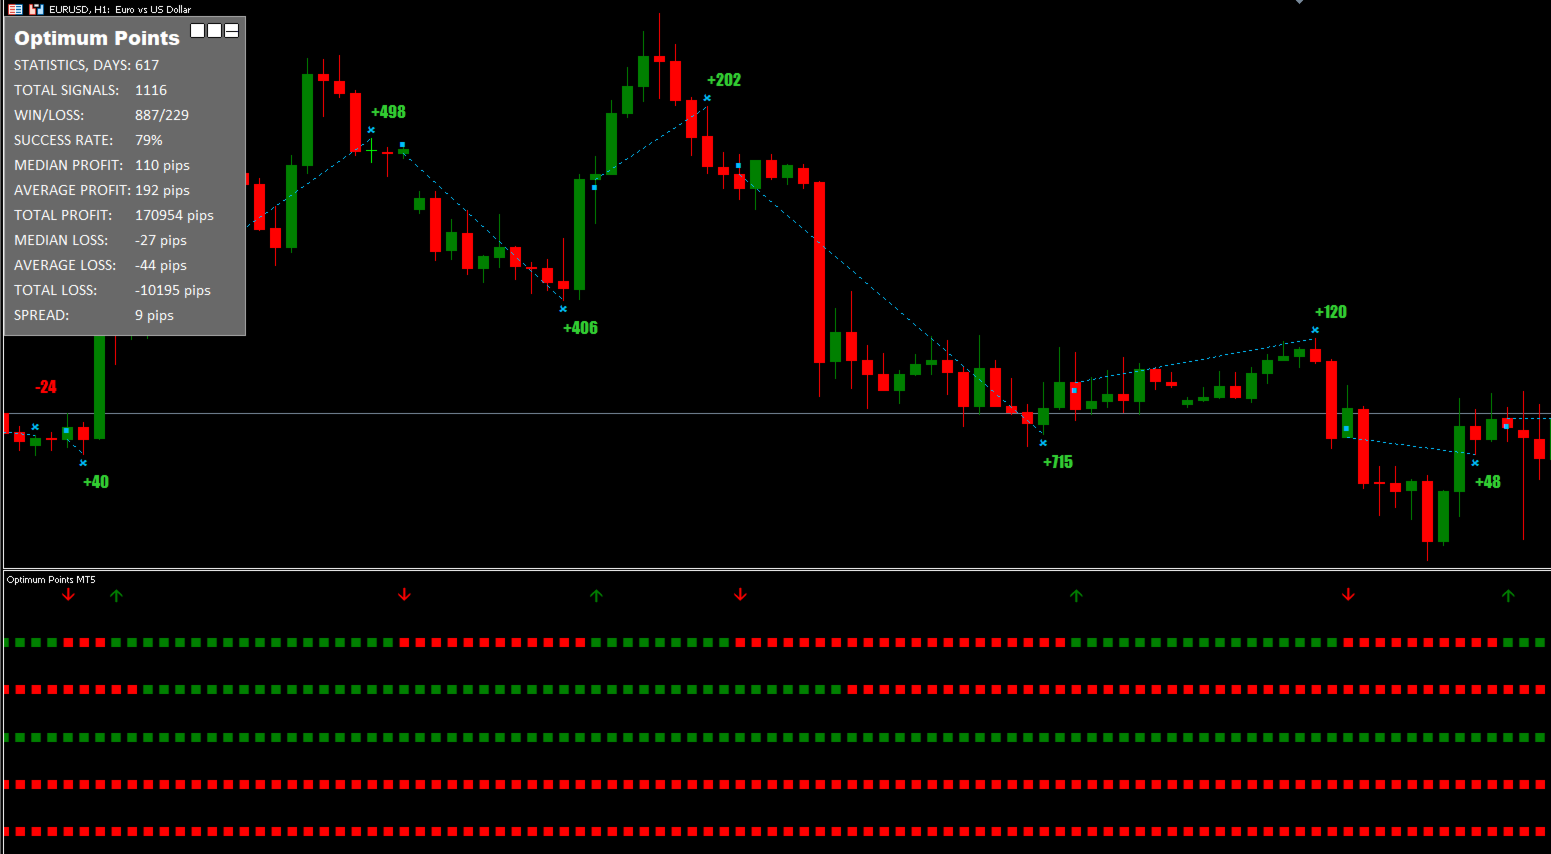
- Oben links befindet sich ein detailliertes Panel mit Transaktionsstatistiken, das minimiert werden kann.
- Für die Berechnung des gleitenden Durchschnitts, der die Richtung des Trends bestimmt, wird eine spezielle Formel verwendet.
- Um das Auftreten eines Handelssignals nicht zu verpassen, können Sie eine Benachrichtigung im Alarmfenster und per Push erhalten.
- Für Benutzer aller Niveaus, vom Anfänger bis zum Experten.
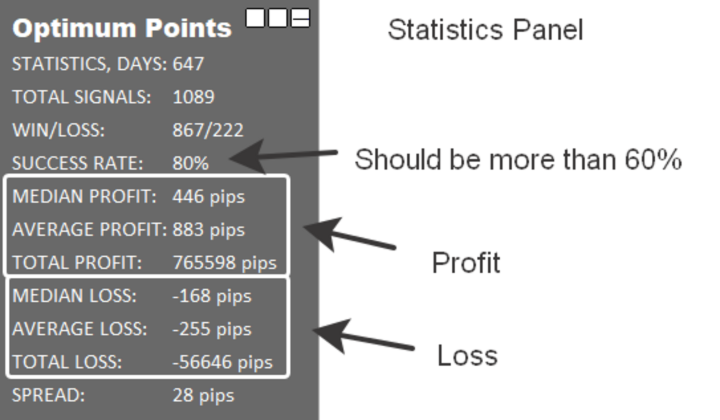
Statistik-Panel
- Anzahl der Tage, von denen die Geschichte der Signale genommen wird.
- Gesamtzahl der Signale, für die eine Statistik erstellt wurde.
- Verhältnis der Anzahl der profitablen und unprofitablen Signale.
- Prozentualer Anteil der profitablen Signale an der Gesamtzahl der Signale.
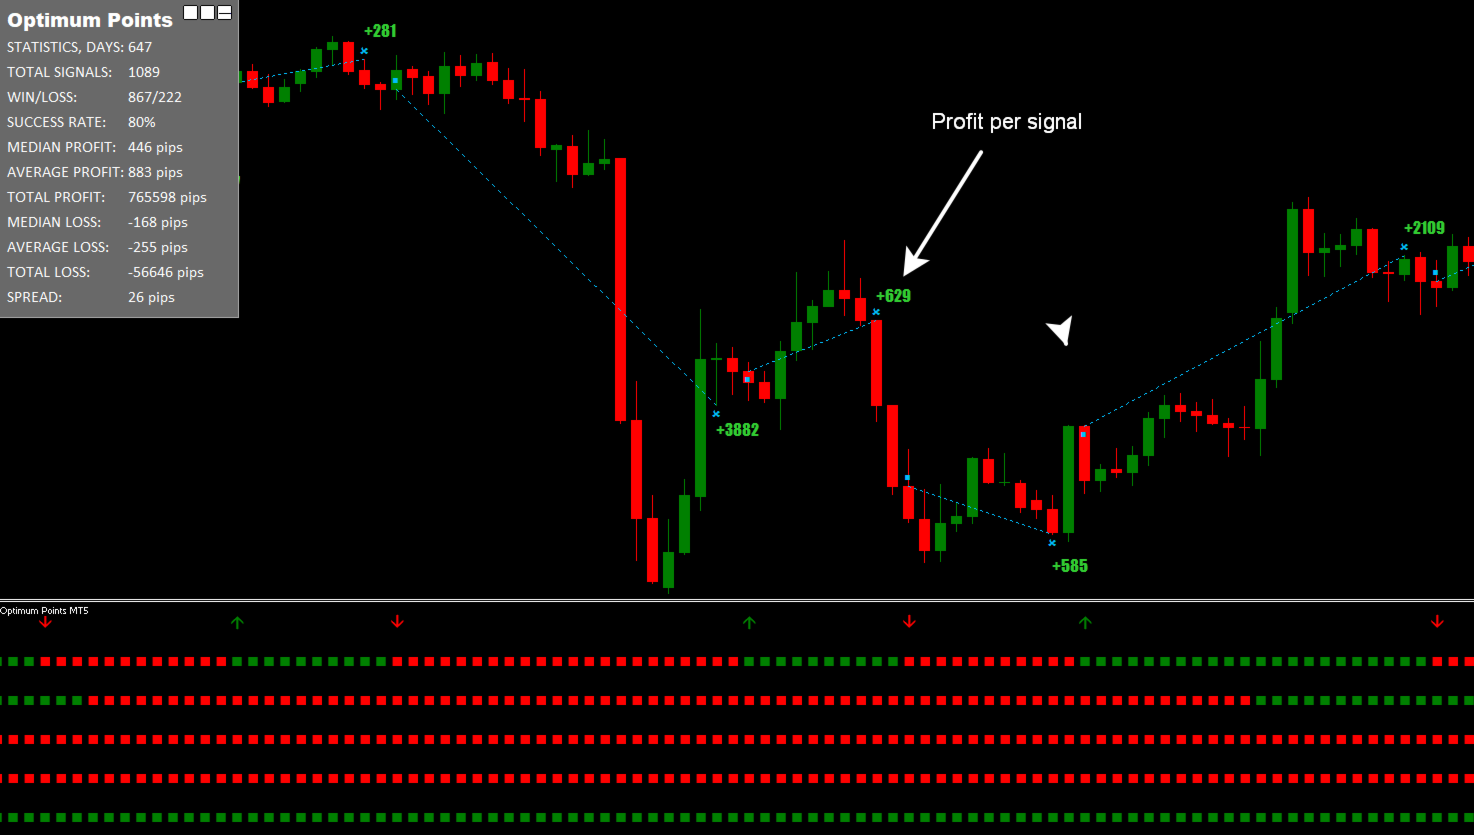
- Medianer Gewinn pro Signal.
- Durchschnittlicher Gewinn pro Signal.
- Gesamtgewinn für alle Signale.
- Mittlerer Verlust pro Signal.
- Durchschnittlicher Verlust pro Signal.
- Gesamtverlust für alle Signale.
- Aktueller Spread.
Parameter der Einstellungen
| Period | Indikatorempfindlichkeit, je empfindlicher, desto mehr Signale |
| M1-MN1 coincidences | Auswahl der Zeitrahmen, auf denen die Pfeile gezeichnet werden, wenn der Trend zusammenfällt |
| Font size | Textgröße auf dem Statistikpanel |
| Show entry/exit points | Ein- und Ausstiegspunkte anzeigen an/aus. |
| Use alert notification | Pop-up-Fenster und akustische Benachrichtigung ein-/ausschalten. |
| Use push notification | Push-Benachrichtigung ein/aus |
Bei Fragen oder Schwierigkeiten können Sie mir gerne eine private Nachricht schicken.