PZ Wolfe Waves
- Indikatoren
- PZ TRADING SLU
- Version: 7.0
- Aktualisiert: 19 Juli 2024
- Aktivierungen: 20
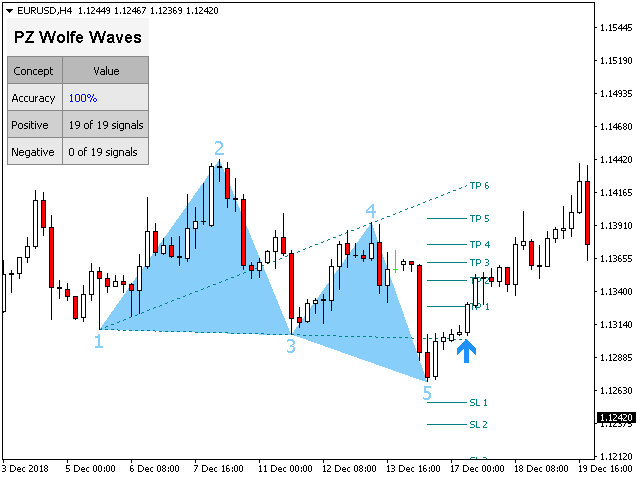
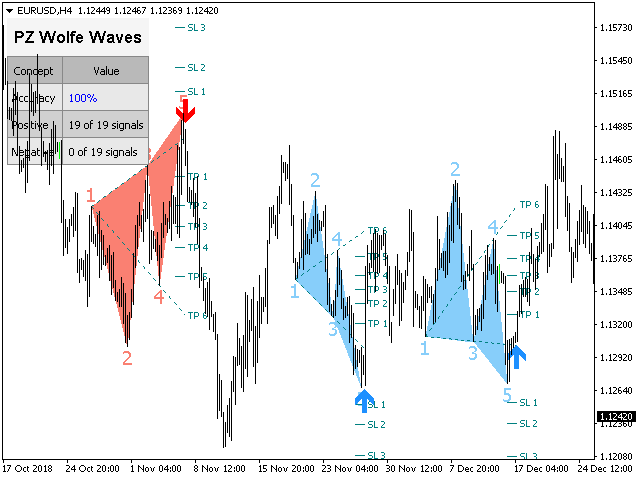
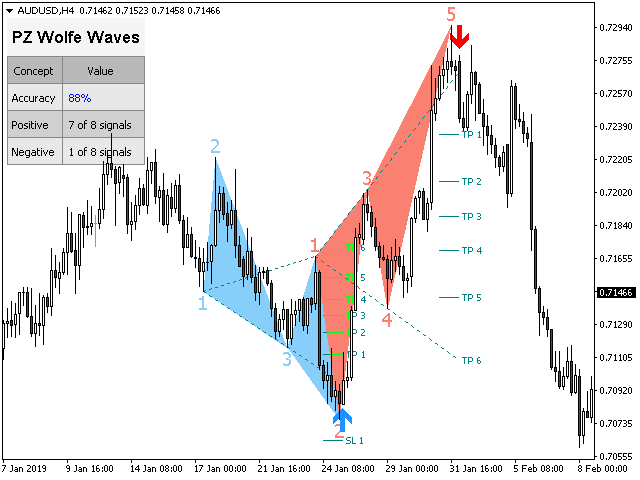
Wolfe Waves sind natürlich vorkommende Handelsmuster, die an allen Finanzmärkten vorhanden sind und einen Kampf um einen Gleichgewichtspreis darstellen. Diese Muster können sich über kurze und lange Zeiträume entwickeln und sind eines der zuverlässigsten prädiktiven Umkehrmuster, die es gibt und die normalerweise starken und langen Kursbewegungen vorausgehen.
[ Installationsanleitung | Update-Anleitung | Fehlerbehebung | FAQ | Alle Produkte ]
- Klare Handelssignale
- Erstaunlich einfach zu handeln
- Anpassbare Farben und Größen
- Implementiert Leistungsstatistiken
- Zeigt geeignete Stop-Loss- und Take-Profit-Werte an
- Es implementiert E-Mail / Sound / visuelle Warnungen
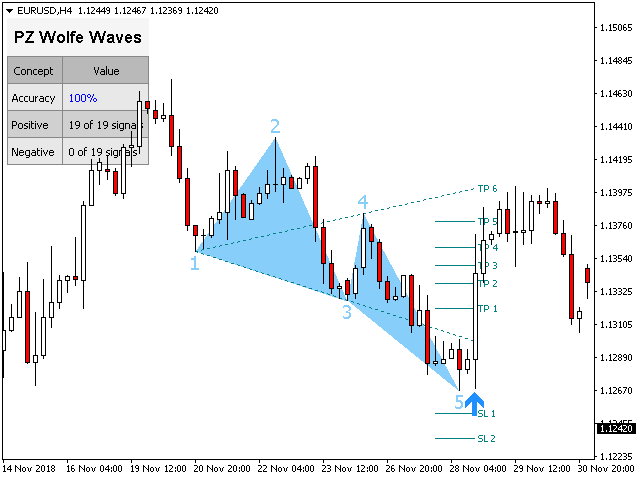
Der Indikator zeichnet das Muster und den Ausbruchspfeil gleichzeitig, um zu verhindern, dass der Indikator das Muster beim Erweitern neu malt. Es kann jedoch vorkommen, dass der Indikator - nicht sehr häufig - sparsam neu gezeichnet wird, wenn der Eintragsausbruch mehrmals auftritt und der Indikator neu gezeichnet wird. Der Indikator ist kein Backpainting.
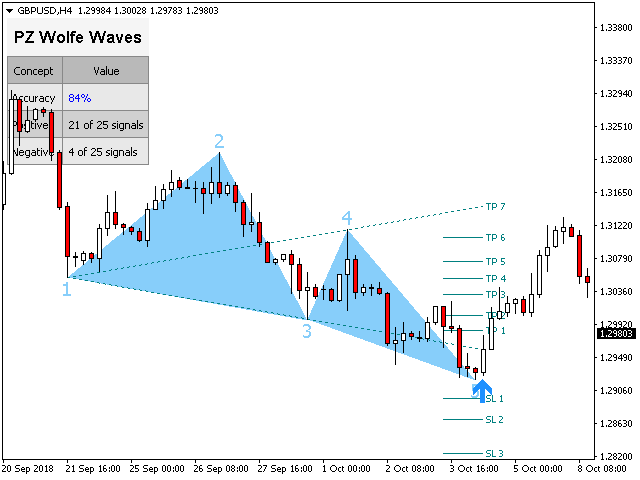
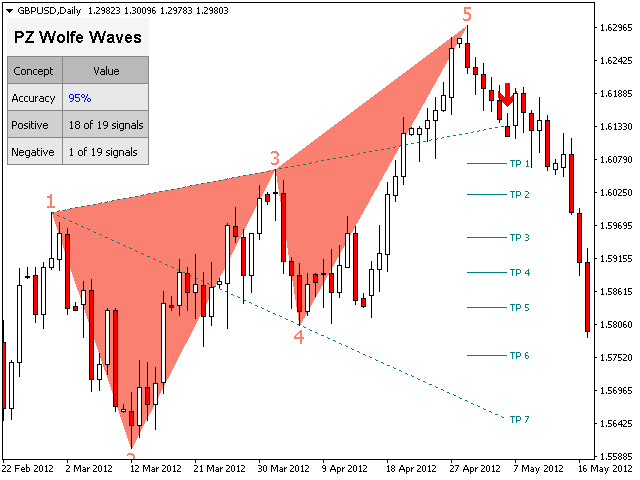
Definition von Wolve Wave
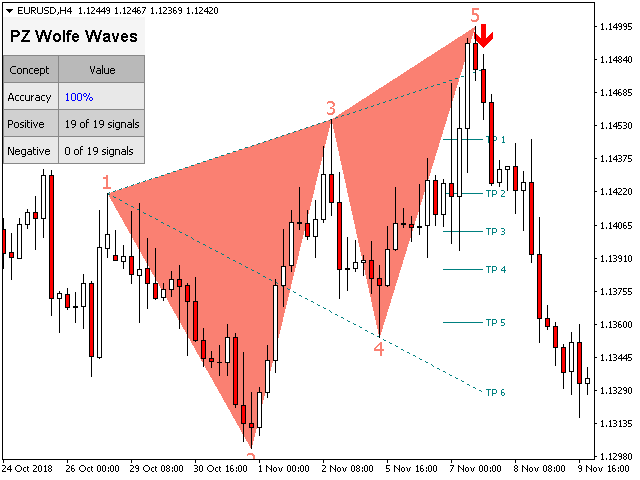
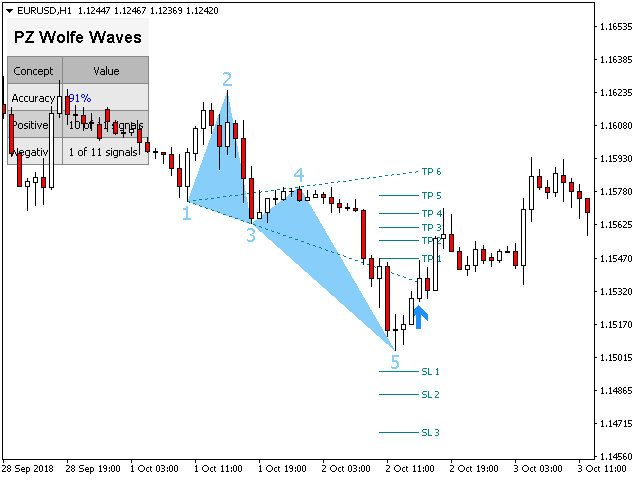
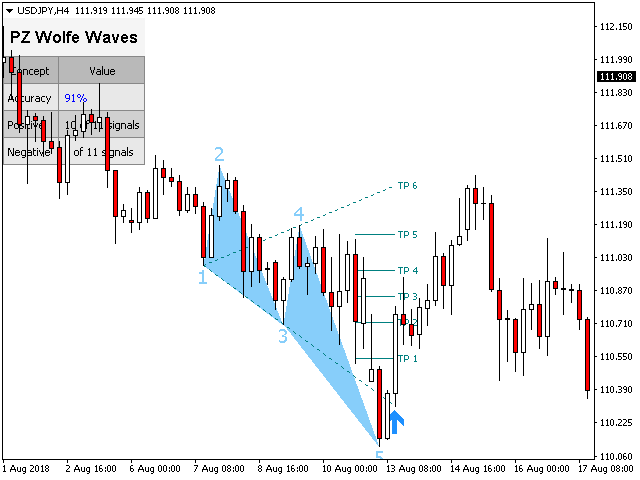
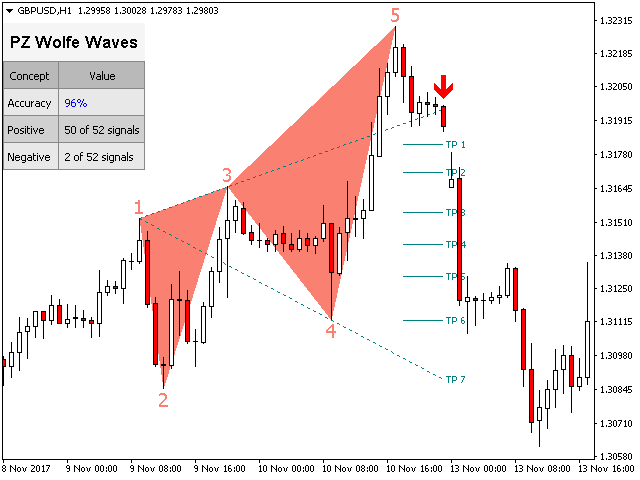
Eine Wolfe-Welle muss die folgenden Eigenschaften haben. ( Klicken Sie hier, um ein Beispiel zu sehen. )- Wellen 3-4 müssen innerhalb des mit 1-2 erstellten Kanals bleiben
- Welle 4 liegt innerhalb des Kanals, der durch Wellen 1-2 erzeugt wird
- Welle 5 übersteigt die von Welle 1 und 3 erzeugte Trendlinie
Eingabeparameter
- Amplitude - Die Amplitude gibt die Mindestanzahl von Balken zwischen alternativen Preispunkten an. Erhöhen Sie den Amplitudenparameter, um große Muster zu finden. Verringern Sie den Amplitudenparameter, um kleinere Muster zu finden. Sie können den Indikator mehrmals in das Diagramm laden, um überlappende Muster unterschiedlicher Größe zu finden.
- Breakout-Periode - Donchianische Breakout-Periode zur Bestätigung von Wolfe-Wellen-Breakouts. Null bedeutet nicht verwendet.
- Max. Verlaufsbalken - Anzahl der vorherigen Balken, die ausgewertet werden sollen, wenn der Indikator in das Diagramm geladen wird.
- Statistiken anzeigen - Zeigt das Statistik-Dashboard und die Leistungsdaten an oder blendet sie aus.
- SL / TP-Pegel anzeigen - Zeigen oder verbergen Sie geeignete SL- und TP-Pegel für jedes Signal.
- Preisschilder anzeigen - Anzeigen oder Ausblenden der Musterpreisschilder.
- Zeichenoptionen - Farben und Größen für bullishe oder bearishe Linien und Beschriftungen sowie Schriftgrößen.
- Ausbrüche - Farben und Größen für Ausbruchspfeile.
- Warnungen - Aktivieren oder deaktivieren Sie Warnungen nach Belieben.
Autor
Arturo López Pérez, privater Investor und Spekulant, Softwareentwickler und Gründer von Point Zero Trading Solutions.

Well, for the moment doens't work as it should