Visual Vortex Signal Indicator
- Indikatoren
- AL MOOSAWI ABDULLAH JAFFER BAQER
- Version: 1.22
- Aktualisiert: 23 März 2025
- Aktivierungen: 5
Visual Vortex Signal Indicator
The Visual Vortex Signal Indicator is your pathway to exploring dynamic market conditions and refining your trading strategy. This indicator is not optimized—it is intentionally designed for traders to tweak and perfect it to suit their trading preferences and objectives. By taking full control of its parameters, you can tailor it to complement your trading approach.
How It Works
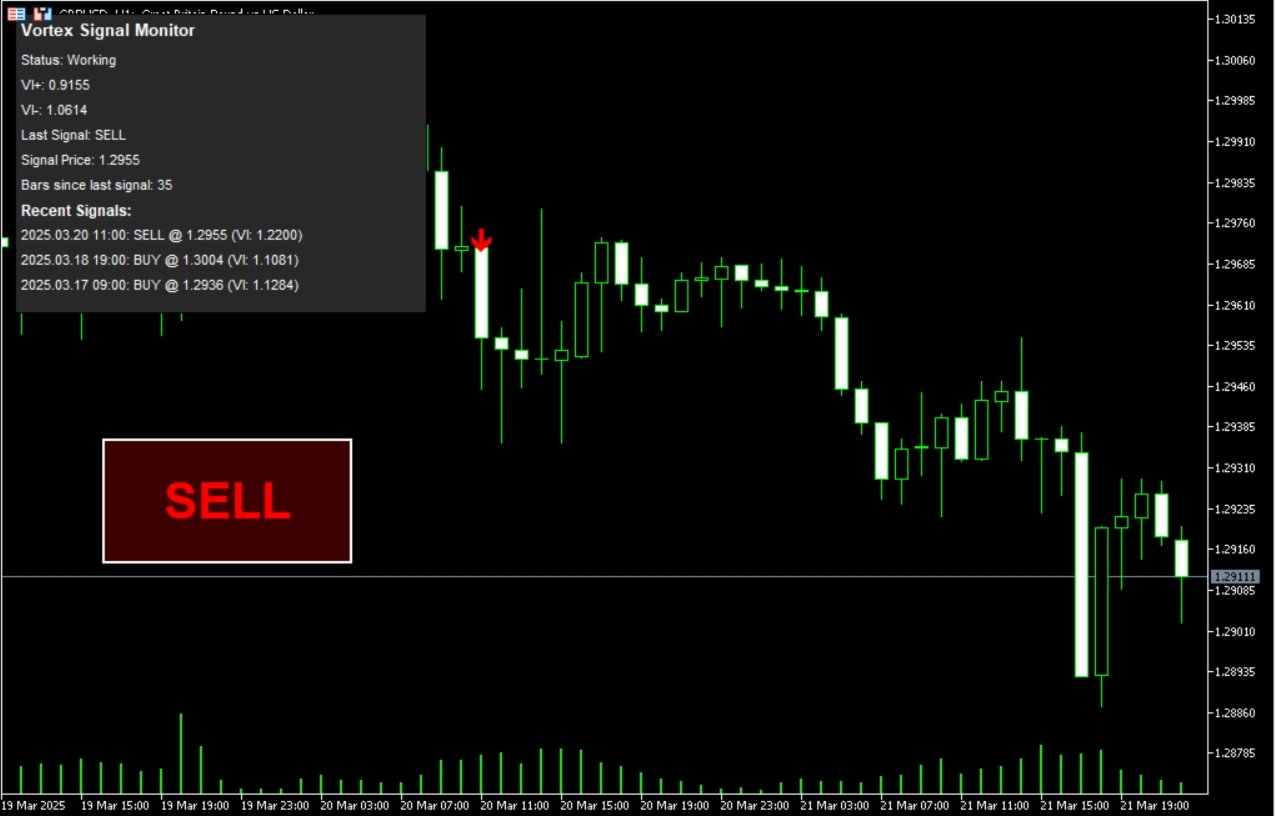
The Visual Vortex Signal Indicator leverages the power of the Vortex Indicator (VI), a robust technical tool inspired by the natural flow of market trends. It identifies the strength and direction of price movements, helping you make data-driven decisions. By analyzing the relationship between positive and negative trend vectors, this indicator paints a clear picture of trend continuations, reversals, and periods of consolidation.
Key Features:
Trend Direction and Strength:
The indicator calculates two dynamic lines: VI+ (Positive Line) and VI- (Negative Line).
Crossovers between these lines reveal potential trend reversals.
Diverging lines indicate trend strength, while converging lines signal possible consolidation or weakening momentum.
Signal Alerts:
Generate precise entry and exit signals by monitoring line intersections.
Customize alerts for trend reversals to align with your trading style.
Versatility:
Works across multiple timeframes—scalpers, swing traders, and long-term investors can all benefit.
Applicable to forex, stocks, indices, and commodities, offering flexibility in diverse markets.
Strategy and Entry Logic
The Visual Vortex Signal Indicator is rooted in the principle of trend dynamics:
Bullish Signal:
When VI+ crosses above VI-, it signals the start of a bullish trend.
Traders may consider entering long positions when the crossover is confirmed with additional confluences (e.g., support zones or moving averages).
Bearish Signal:
When VI- crosses above VI+, it indicates a bearish trend.
Ideal for short entries, particularly when aligned with resistance levels or declining momentum.
Neutral Zones:
Periods when VI+ and VI- move sideways or are tightly intertwined suggest a range-bound market.
Traders may avoid taking positions or employ range-trading strategies during these phases.
Trend Strength Analysis:
Larger gaps between VI+ and VI- confirm strong trends, while smaller gaps warn of potential reversals.
Use this information to hold trades longer during strong trends or exit early when trends weaken.
Customization
The indicator’s parameters are fully adjustable, enabling you to:
Fine-tune sensitivity for your preferred trading style.
Adjust alert settings to highlight significant signals.
Combine it with other tools for a robust trading system.
Important Notes
Not Optimized: This indicator is designed as a flexible tool for you to optimize. Adjust its settings to align with your unique trading preferences.
Compatibility: It integrates seamlessly with MetaTrader 5 (MT5) and adapts to various trading instruments.
Why Choose the Visual Vortex Signal Indicator?
Empower yourself with a deeper understanding of trend dynamics.
Identify high-probability trade setups with clarity and confidence.
Optimize it to match your trading goals and maximize its potential.