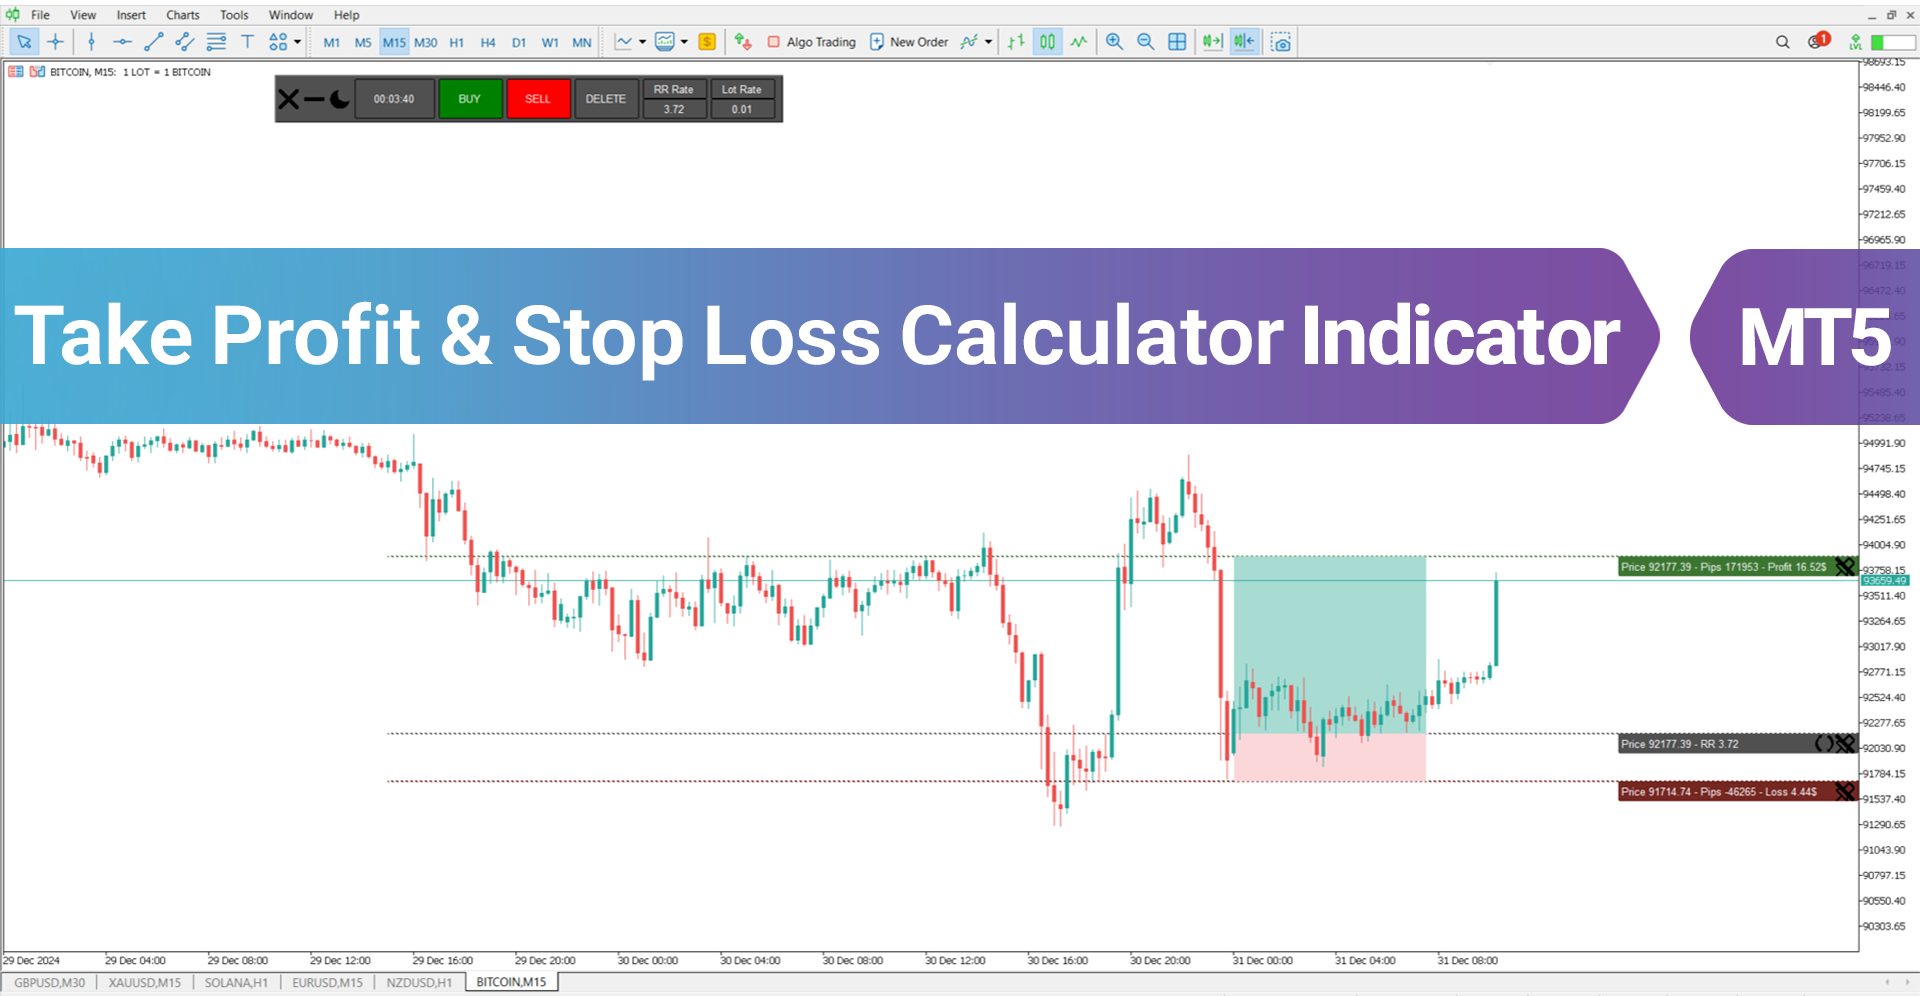
TP and SL Calculator MT5
TP & SL Calculator Indicator for MT5
Take Profit & Stop Loss Calculator Indicator for MT5 Download
The Take Profit & Stop Loss Calculator Indicator serves as a valuable risk and capital management tool for determining and setting take profit (TP) and stop loss (SL) levels. These levels can be easily drawn directly on the chart using the indicator.
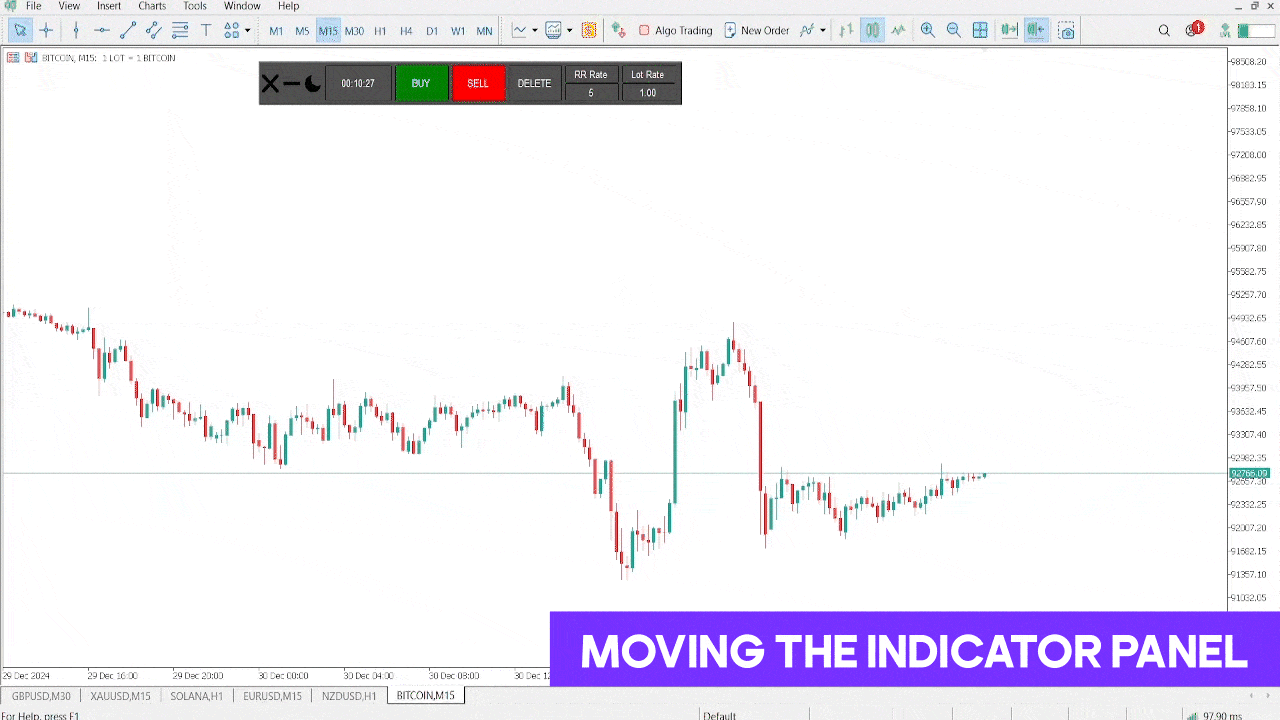
This tool enhances capital management by providing a separate box that includes the following features:
- The ability to create and manage take profit and stop loss levels for both Buy and Sell positions;
- Determination of trade volume in lots;
- Displaying the Risk to Reward (R/R) ratio for informed decision making;
- Showing the remaining time until the next candle (Time to the next bar) to assist with timely trade execution.
Specifications Table for the TP & SL Calculator Indicator
The main specifications of the indicator are as follows:
| Category | Trading Tool - Capital Management - Risk Management |
| Platform | MetaTrader 5 |
| Skill Level | Beginner |
| Indicator Type | Risk and Capital Management |
| Timeframe | Multi-Timeframe |
| Trading Style | Scalping - Intraday – Medium Term – Long Term Trading |
| Market | All Markets |
Overview of the Indicator
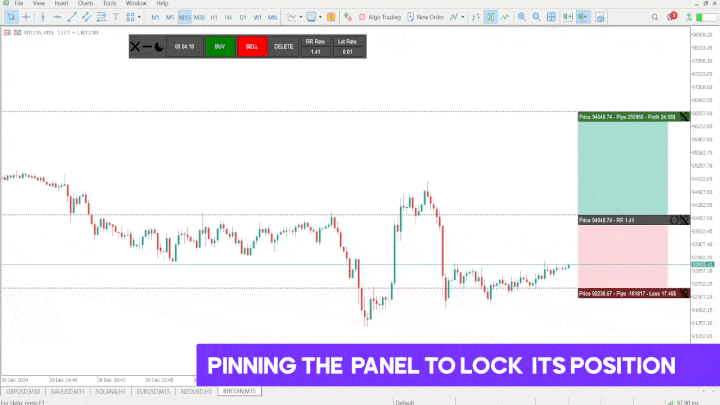
Overall, the levels for Take Profit (TP) and Stop Loss (SL) can be created on the chart using two methods manually adjusting the lines or entering the desired "R/R" ratio. The levels displayed on the chart include the Take Profit line (green), the Stop Loss line (red), and the Open Position line (gray).
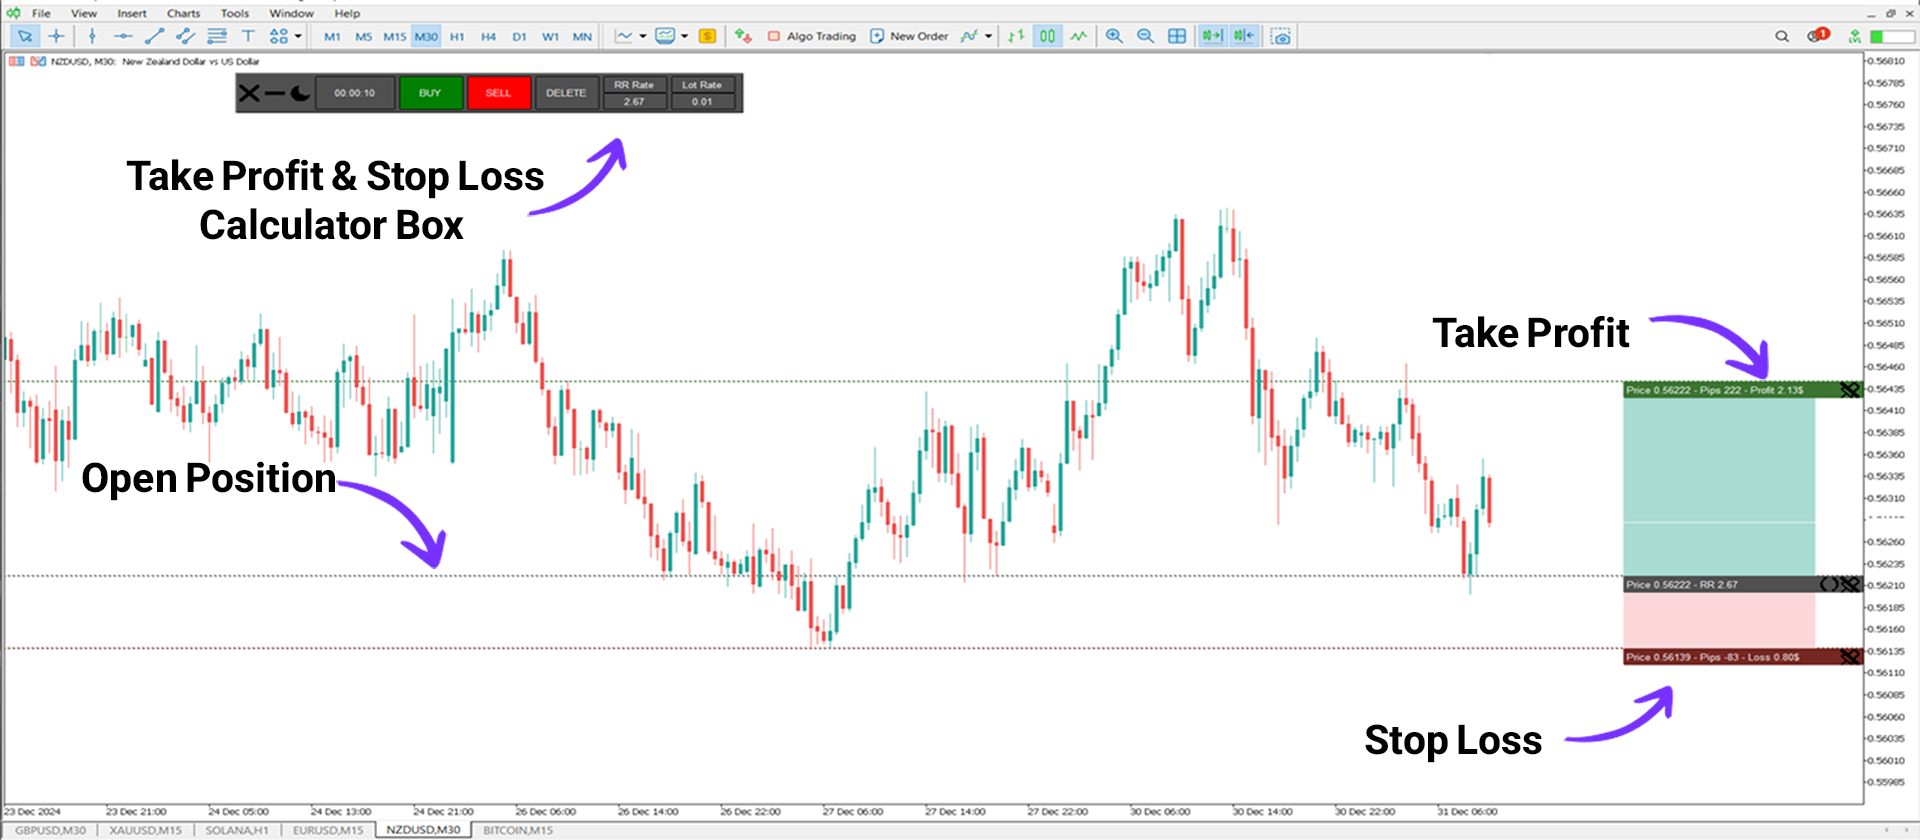
Indicator Performance in an Uptrend
Based on the analysis of the NZD/USD currency pair chart in the 30-minute timeframe, the gray line marks the entry point, while the green line represents the Take Profit level and the red line indicates the Stop Loss level.
The calculator box provides additional details, including the time remaining until the next bar, the Risk to Reward (R/R) ratio, and the trade volume.
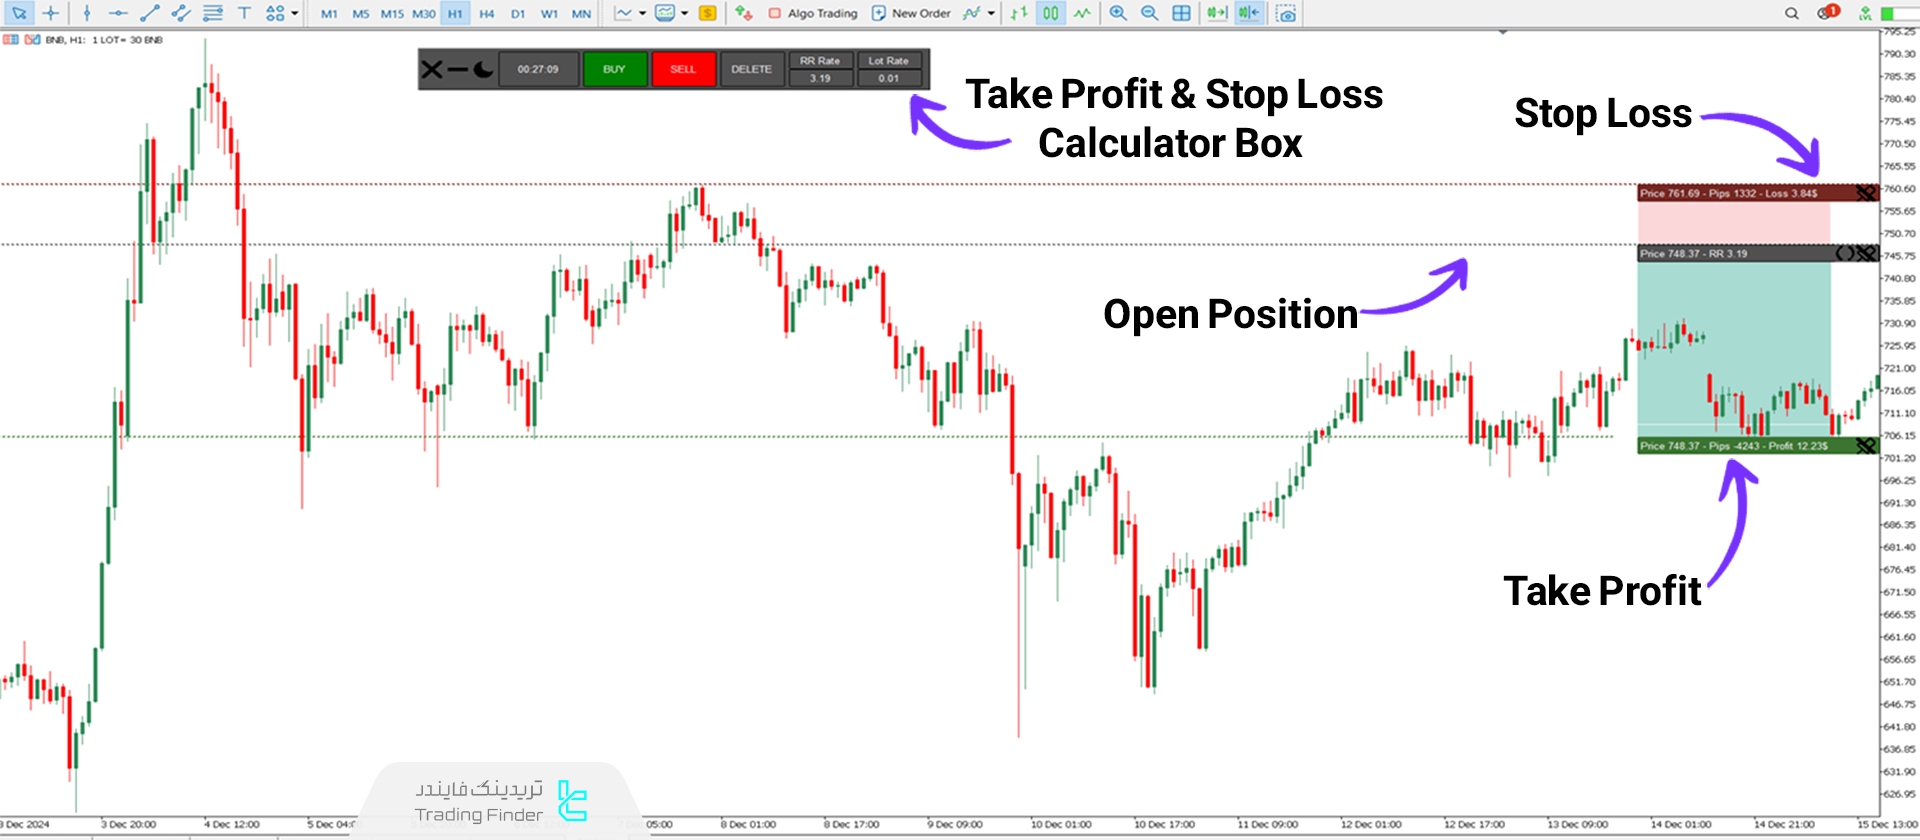
Indicator Performance in a Downtrend
As observed in the BNB/USD chart for the 1-hour timeframe, during a downtrend, the Take Profit (TP) level, represented by the green line, is positioned below the Open Position (gray line), while the Stop Loss (SL) level, represented by the red line, is placed above it.
The calculator box further offers useful information, including the time remaining until the next candle (Time to the next bar), the Risk to Reward (R/R) ratio, and the trade volume, aiding in effective capital management.
Indicator Settings
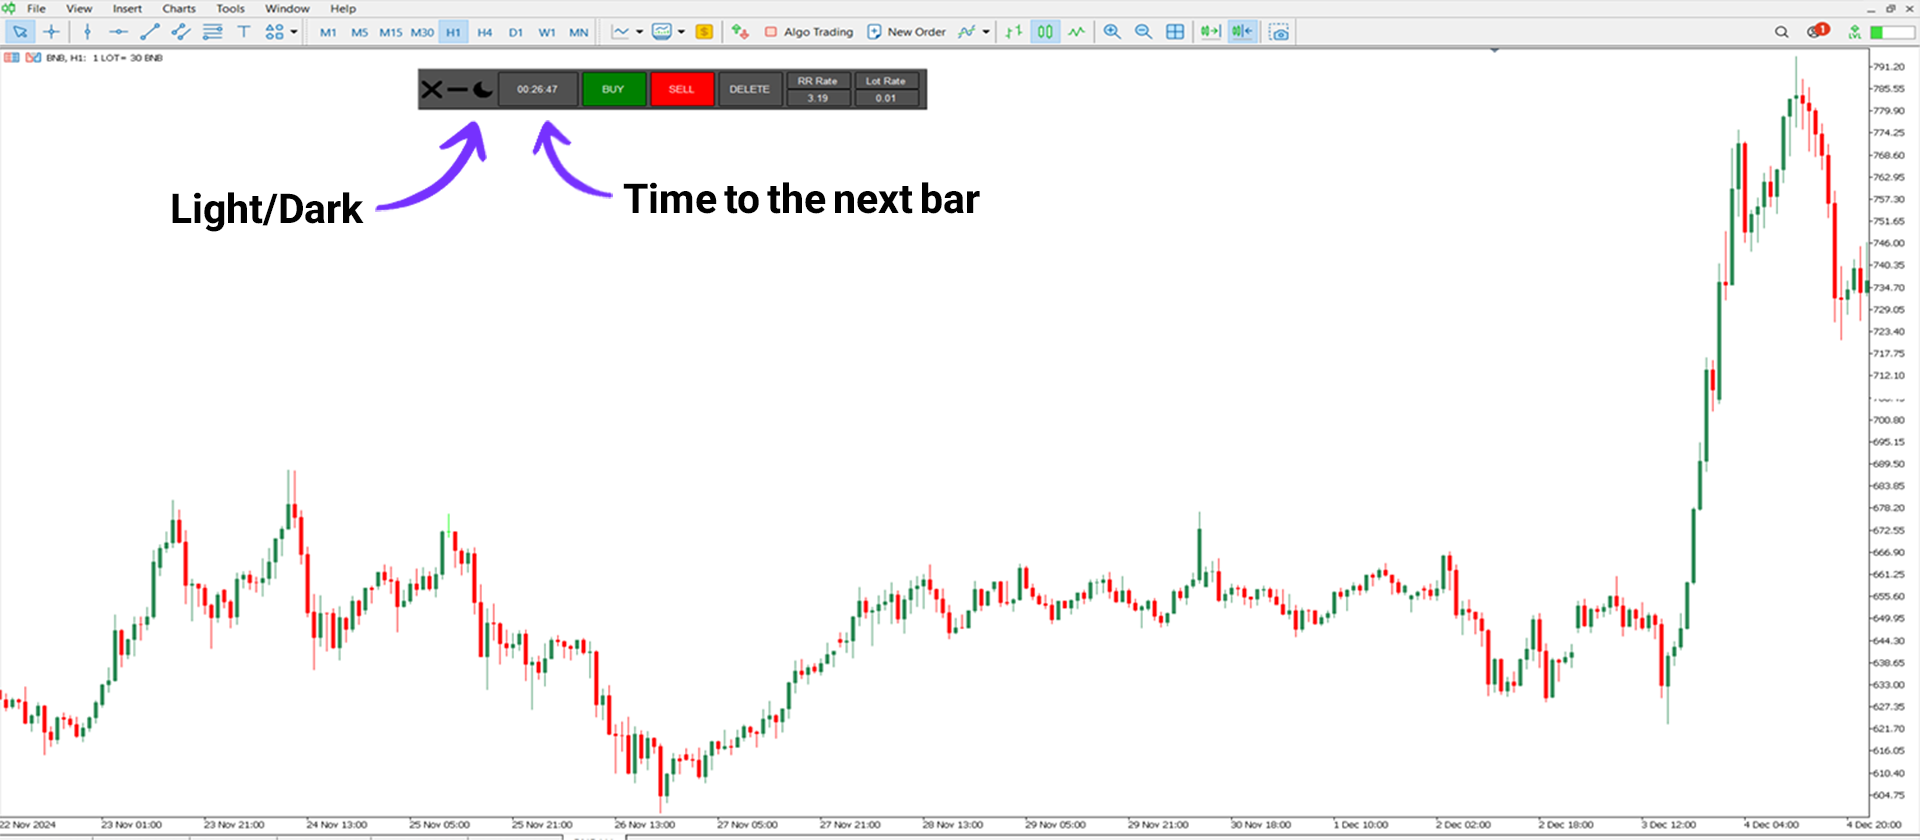
The information and features in the calculator box are as follows:
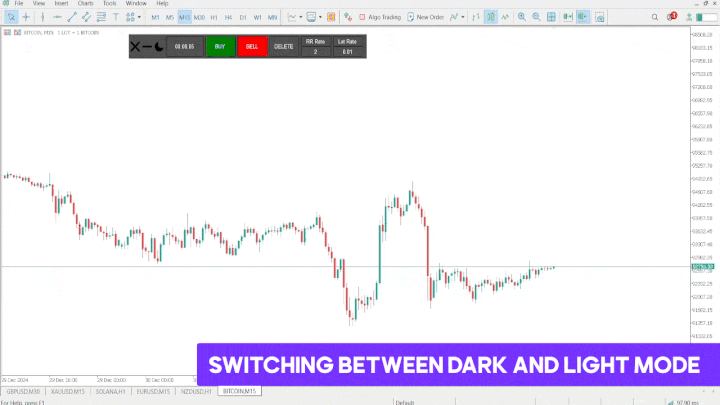
- Light/Dark: Adjusting the theme for the TP and SL elements;
- Time to the next bar: Time remaining until the candle closes;
- Buy: Configuring Buy positions;
- Sell: Configuring Sell positions;
- Delete: Removing TP and SL lines;
- R/R Rate: Indicator of the Risk to Reward ratio;
- Lot Rate: Manually determining the position volume.
Conclusion
The Take Profit & Stop Loss Calculator Indicator streamlines the process of calculating TP and SL levels by providing a clear visual representation on the chart and displaying relevant information in a dedicated box.
These levels can be set manually by adjusting the lines directly on the chart or by inputting the desired "R/R" value in the calculator box.