True Direction Oscillator
- Indikatoren
- Muhammad Elbermawi
- Version: 9.2
- Aktualisiert: 22 Mai 2020
- Aktivierungen: 20
Oder (TDO), ein Index, der die Preisänderungsrate nach dem Prinzip des „ Pure Momentum“ misst.
Wenn ein Wertpapierkurs von 10 auf 15 steigt, beträgt die Preisänderungsrate 150%, aber wenn er von 15 auf 10 zurückgeht, beträgt die Preisänderungsrate nur 33,3%. Aus diesem Grund liefern Indikatoren der technischen Analyse wie "Price Rate of Change" (ROC) oder "Momentum" höhere Werte für aufsteigende Kursbewegungen als solche für absteigende. TDO behebt dieses Problem, um Händlern zu helfen, das Momentum richtig zu lesen.
Wichtige Informationen
TDO-Funktionen
TDO berechnet das reine Momentum in Prozent und wird daher verwendet, um verschiedene Wertpapiere aus verschiedenen Märkten zu vergleichen. (Beispiel: EURUSD mit Gold & Dow Jones Industrial vergleichen).
Die Berechnung des TDO-Panels hängt von fünf verschiedenen Zeiträumen ab, um ein breites Spektrum von Marktzyklen abzudecken und Trends effektiver aufzufangen.
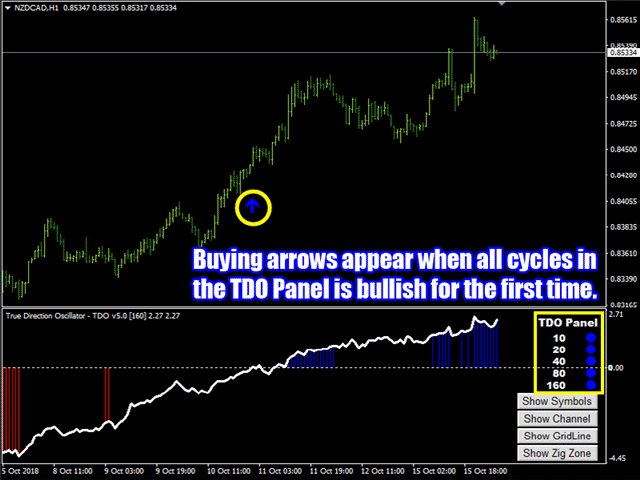
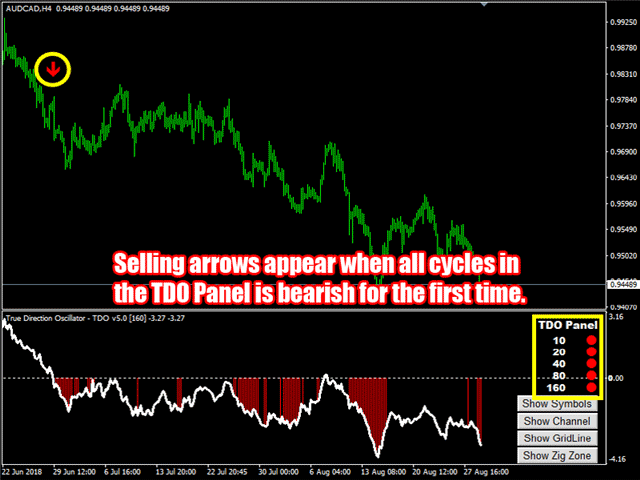
Der TDO-Pfeil erscheint, wenn alle Punkte des TDO-Panels zum ersten Mal in einer Linie sind. Dieses Merkmal reduziert die Anzahl der falschen Nulllinien-Kreuzungssignale auf ihre niedrigste Anzahl.
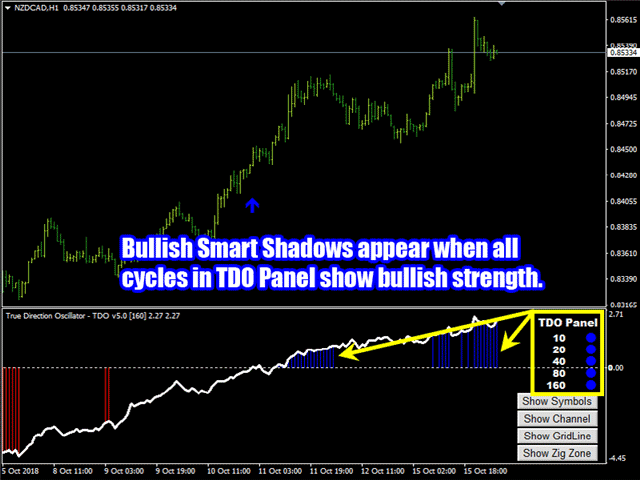
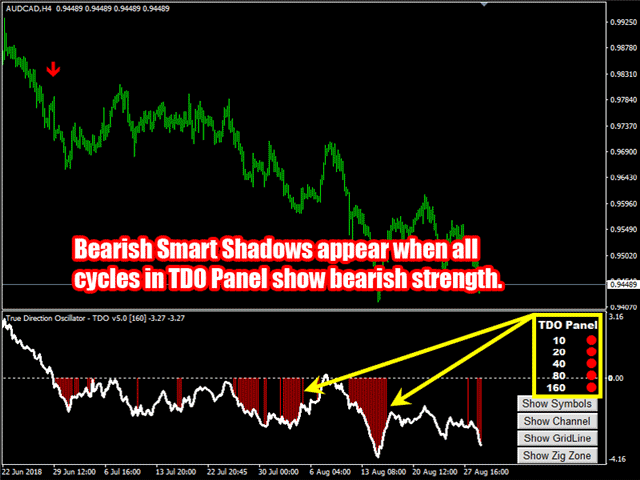
Ton-, E-Mail-Benachrichtigungen, wenn sich der Trend verstärkt und wenn Pfeilsignale zu Beginn eines neuen Trends erscheinen.
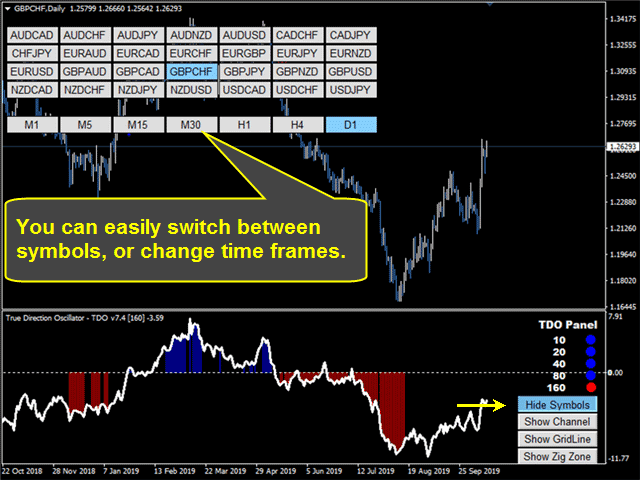
Sie können zwischen FX-Paaren wechseln, indem Sie die Symboltaste drücken. Sie können das Diagramm in einem neuen Fenster öffnen.
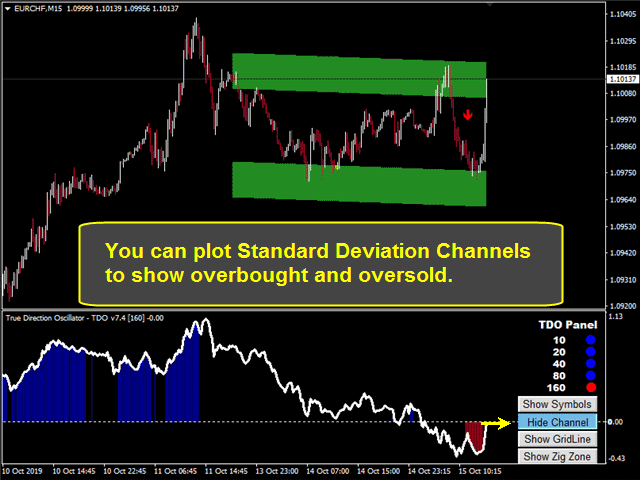
Sie können einen Standardabweichungskanal oder einen linearen Regressionskanal hinzufügen, indem Sie die Kanaltaste drücken.
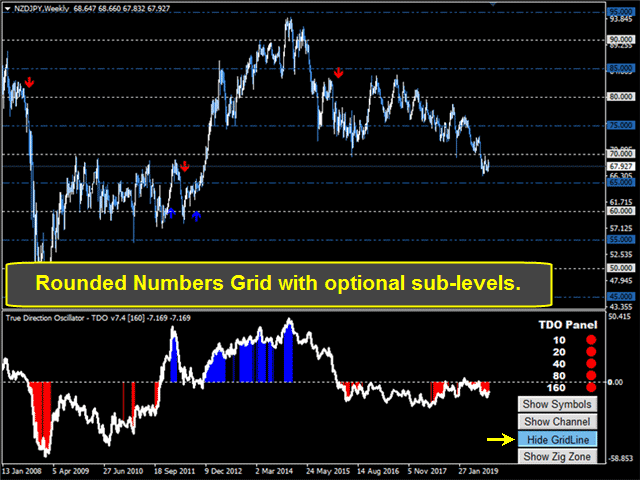
Sie können ein Raster aus verschiedenen Stufen von runden Zahlen hinzufügen.
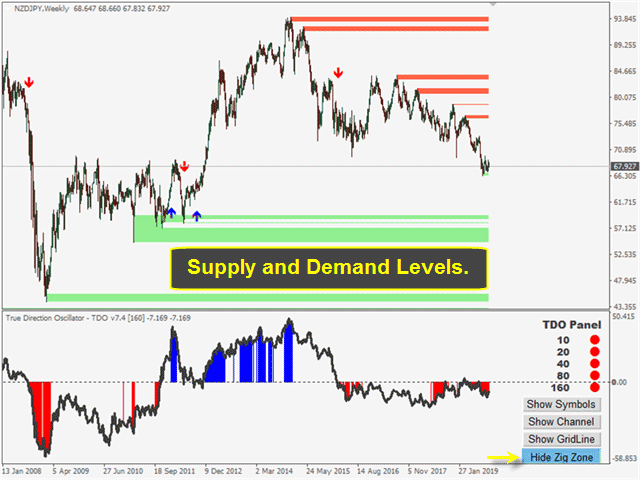
Sie können Unterstützungs- und Widerstandsstufen hinzufügen.
Gut gestaltete Parameter, die dem Benutzer helfen, zwischen ihnen zu navigieren.
Der TDO-Code wurde überarbeitet, um sicherzustellen, dass er nicht den PC-Speicher des Benutzers verbraucht.
TDO-Pfeile werden nicht neu gezeichnet oder ihre Ergebnisse neu berechnet.
Wichtige TDO-Parameter
1) TDO-EINSTELLUNGEN
- Erste TDO-Periode [ Min =1 ]:Dies ist der erste Zyklus im TDO-Panel. Standard ist 10.
2) TDO-FARBENLISTE & TASTEN
- Liste der Diagrammfarben:Sie können zwischen vier verschiedenen Farblisten wählen oder wählen (Nichts tun).
3) TDO-PFEILE & ALARM
4) TDO PANEL-ALARM
5) TDO-SYMBOLE-TASTEN
- Fenster zum Anzeigen von Symbolen:Symbolschaltflächen im Hauptdiagrammfensteroder im TDO-Fenster anzeigen.
- Schaltfläche Klicken Aktion:Diagramm im selben Fensteroder in einem neuen Fensteröffnen .
- Symbolquelle von:Holen Sie sich Symbole aus einer benutzerdefinierten Symbollisteoder von Market Watch.
- Liste der Symbole (getrennt durch ";"):Wenn Sie Symbole aus einer benutzerdefinierten Liste auswählen, trennen Sie die Symbole durch ";".
- Schaltflächen in einer horizontalen Reihe [Min=(1)]:Anzahl der Schaltflächen, die in einer Reihe angezeigt werden sollen.
- Zeitrahmen zum Anzeigen [Min=(1) & Max=(9)]:Standard ist sieben.
6) TDO-KANAL
- Kanaltyp:Wählen Sie zwischen Standardabweichungskanälenoder linearem Regressionskanal.
- Kanalstrahl:Um den Kanal als Strahl anzuzeigen.
- Kanallänge:Anzahl der Kerzen, die bei der Kanalberechnung verwendet werden. Der Standardwert ist 160.
7) TDO-GITTERLINIEN
- Anzahl der Unterrasterebenen:Sie können zwischen den Hauptrasterebenen null bis zehn Unterebenen hinzufügen.
8) TDO ZIG ZONE LEVELS
Wenn Sie Fragen haben, kontaktieren Sie mich bitte über eine private Nachricht oder schreiben Sie diese in den Kommentarbereich.
Muhammad Al Bermaui, CMT


The indicator is logically simple and elegant. I value an innovative idea that improve on existing analysis framework. It provides a potential for an unbiased trend confirmation (via momentum movement). I vouch for this.