• Übersicht
  • Bewertungen (1)
  • Diskussion
  • Neue Funktionen

ON Trade Elliot Wave Manual

5

Dieser Indikator wurde entwickelt, um mit der Elliott-Wellen-Theorie auf zwei Arten zu arbeiten:

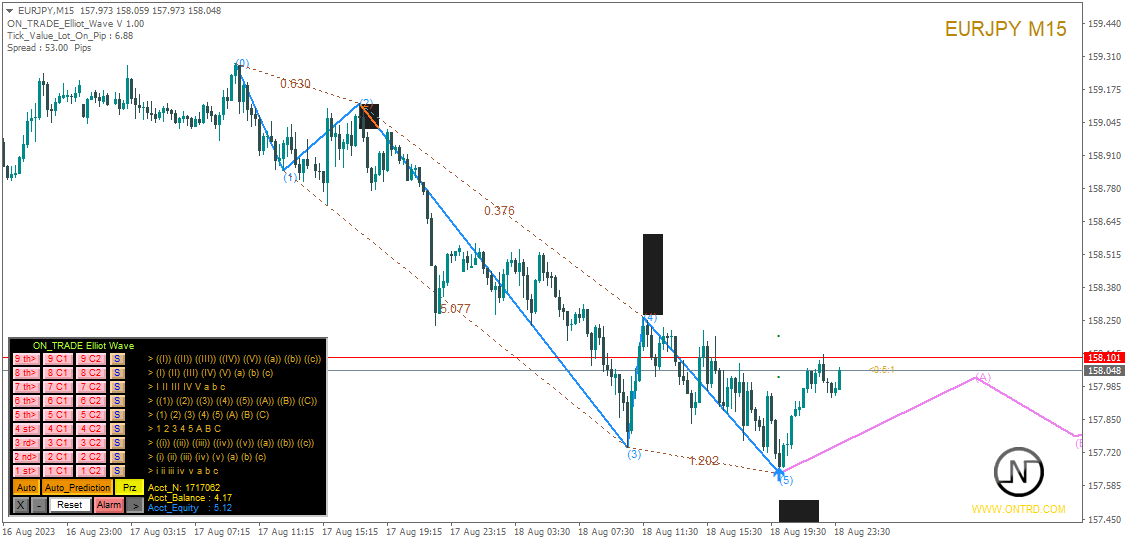
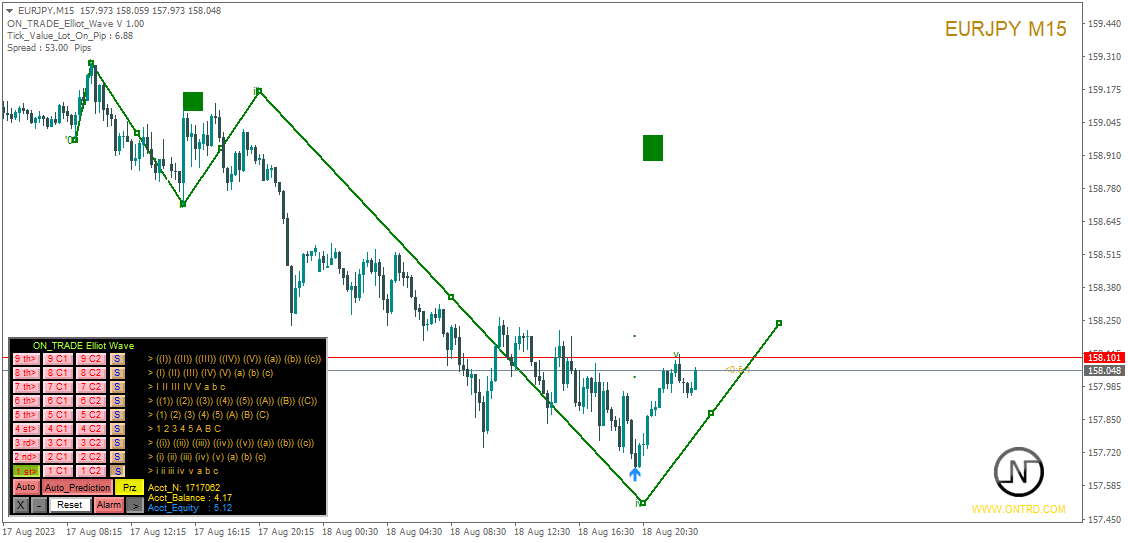
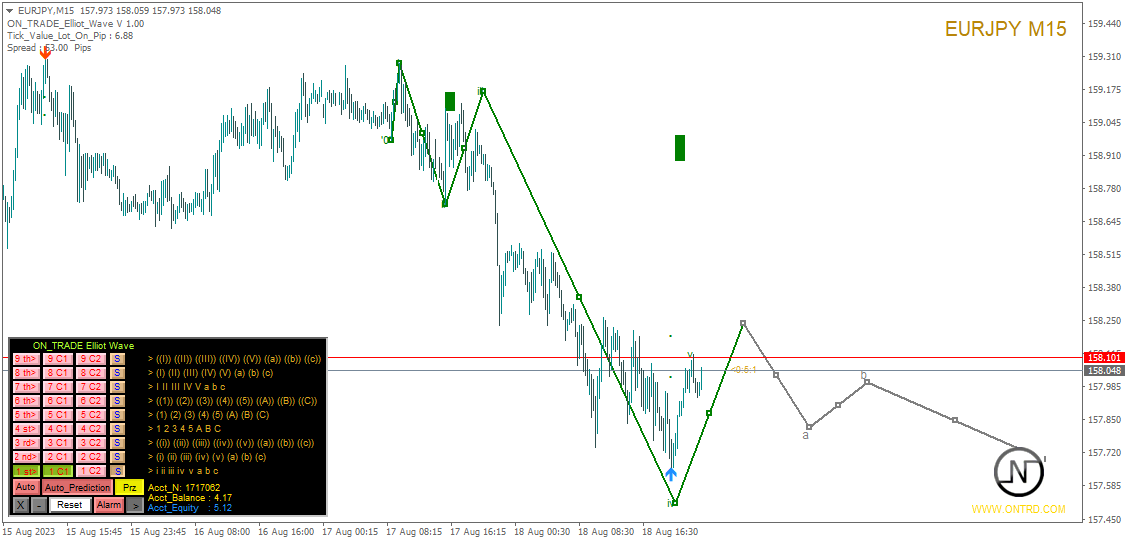
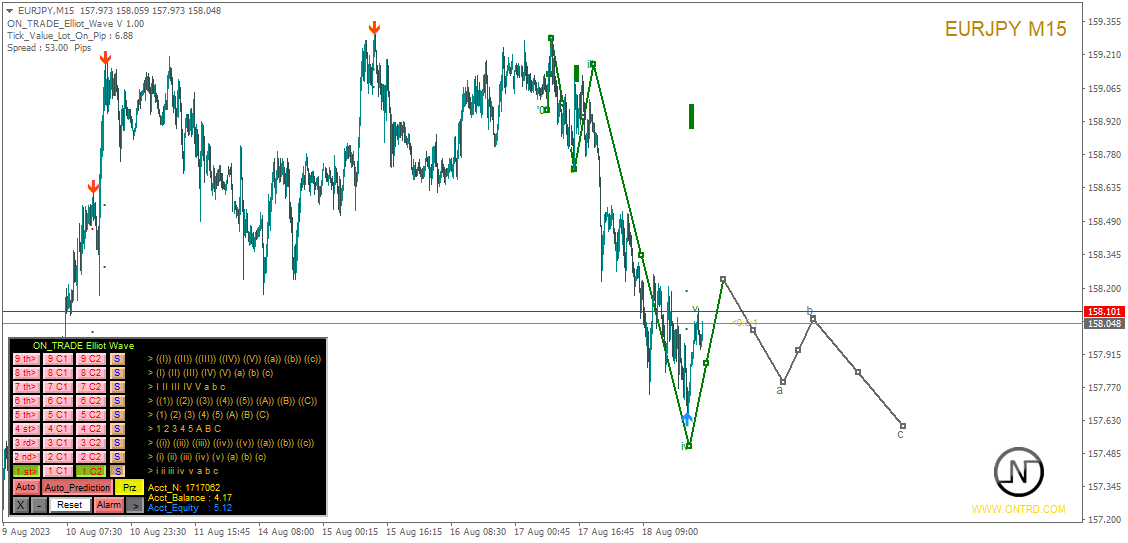
  1. Automatische Arbeitsweise: In diesem Modus erkennt der Indikator automatisch alle fünf Motivwellen im Chart gemäß der Elliott-Wellen-Theorie. Er liefert Prognosen und identifiziert potenzielle Umkehrzonen. Darüber hinaus verfügt er über die Fähigkeit, Warnungen und Push-Nachrichten zu generieren, um Trader über bedeutende Entwicklungen zu informieren. Diese automatisierte Funktionalität vereinfacht den Prozess der Identifikation und Analyse von Elliott-Wellenmustern.

  2. Manuelle Arbeitsweise: Diese Option richtet sich an Trader, die einen manuellen Ansatz in der Elliott-Wellen-Theorie bevorzugen. Sie ermöglicht es Benutzern, Wellen mithilfe von neun verschiedenen Graden zu zeichnen. Jeder Grad kann individuell definiert werden, indem die auf dem Chart angezeigten Linien nach ihrem Erscheinen angepasst werden. Diese Funktion vereinfacht den manuellen Zeichenprozess von Wellen und macht ihn effizienter. Es ist wichtig zu beachten, dass alle Zeichnungsdaten im Datenordner der Plattform für zukünftige Referenzen gespeichert werden.

Parameter:

  • Name: Der Name des Indikators.
  • Use_System_Visuals: Aktivieren oder deaktivieren Sie das Thema des Indikators, um es an das Gesamterscheinungsbild der Handelsplattform anzupassen.
  • Explain_Comment: Aktivieren oder deaktivieren Sie erläuternde Kommentare zur Nummerierung der Wellen, um das Verständnis der identifizierten Wellen zu unterstützen.
  • Show_Last_Candle_Counter: Aktivieren oder deaktivieren Sie den Zähler für die verbleibende Zeit der aktuellen Kerze, um Informationen über die verbleibende Zeit bis zum Abschluss der aktuellen Kerze zu erhalten.
  • Candle_Counter_Color: Die Farbe des Textes des Kerzenzählers.
  • Basic_Wave_Color: Die Hauptfarbe zur Darstellung von Wellen.
  • Bullish_Wave_Color: Die Farbe, die den aufsteigenden 5-Motivwellen zugewiesen wird, wenn sie erkannt werden.
  • Bearish_Wave_Color: Die Farbe, die den absteigenden 5-Motivwellen zugewiesen wird, wenn sie erkannt werden.
  • Ending_Diagonal_Color: Die Farbe, die den abschließenden diagonalen Motivwellen zugewiesen wird, wenn sie erkannt werden.
  • Leading_Diagonal_Color: Die Farbe, die den führenden diagonalen Motivwellen zugewiesen wird, wenn sie erkannt werden.
  • Correction_Color: Die Farbe für korrektive Wellen.
  • Proportion_Color: Die Farbe für Wellenproportionen.
  • PRZs_Color: Die Farbe für potenzielle Umkehrzonen der Wellen.
  • Font_Color: Die Farbe für Textelemente.
  • Font_Size: Die Größe des angezeigten Texts.
  • Show_Targets: Aktivieren oder deaktivieren Sie die Anzeige von Zielen im automatischen Modus.
  • Send_Alert: Aktivieren oder deaktivieren Sie die Alarmfunktion.
  • Send_Notification: Aktivieren oder deaktivieren Sie die Benachrichtigungsfunktion.
  • Send_Email: Aktivieren oder deaktivieren Sie die E-Mail-Funktion.
  • History_Bars: Legen Sie die maximale Anzahl historischer Balken fest, die mit der automatischen Funktion analysiert werden.

Durch die Kombination der automatischen und manuellen Modi bietet dieser Indikator den Tradern ein vielseitiges Werkzeug für die Elliott-Wellen-Analyse, das unterschiedlichen Präferenzen und Handelsansätzen gerecht wird. Er vereinfacht den Prozess der Identifikation von Wellenmustern und unterstützt die Trader bei fundierten Handelsentscheidungen. Wie bei jedem Werkzeug ist es wichtig, verantwortungsbewusstes Risikomanagement zu praktizieren und in Betracht zu ziehen, die Erkenntnisse des Indikators mit anderen Formen der Analyse zu kombinieren, um umfassende Handelsstrategien zu entwickeln.


Bewertungen 1
Mohd Noor Quddussi Izuywan Bin Mohd Sani
493
 

this indicator is good for elliot wave user like me. and the most important we cannot put other indicator with the same chart, also the support is very good.

Empfohlene Produkte
Auto Fibo mq
DMITRII GRIDASOV
"Auto FIBO" indicator    - is great auxiliary tool in trading! Indicator automatically calculate and place on chart Fibo levels and local trend lines (red color) Fibonacci levels indicate key areas where price can reverse Most important levels are 23.6%, 38.2%, 50% and 61.8% You can use it   for reversal scalping  or for zone grid trading There are plenty of opportunities to  improve your current system using Auto FIBO indicator as well // More great Expert Advisors and Indicators are availab
mql5 version:  https://www.mql5.com/en/market/product/44815 Simple indicator to calculate profit on fibonacci retracement levels with fixed lot size, or calculate lot size on fibonacci levels with fixed profit. Add to chart and move trend line to set the fibonacci retracement levels. Works similar as default fibonacci retracement line study in Metatrader. Inputs Fixed - select what value will be fix, lot or profit Fixed value - value that will be fix on all levels Levels - levels for which to ca
Fibonaccitools
Aymn Sʿyd Ahmd Hsn Alkwmy
Fibonacci-Retracements sind beliebte Tools, mit denen Trader Unterstützungslinien ziehen, Widerstandsniveaus identifizieren, Stop-Loss-Orders platzieren und Zielpreise festlegen können. Ein Fibonacci-Retracement wird erstellt, indem zwei Extrempunkte auf einem Aktienchart genommen und die vertikale Distanz durch die wichtigsten Fibonacci-Verhältnisse von 23,6%, 38,2%, 50%, 61,8% und 100% geteilt werden. Der Fibonacci-Tools-Indikator zeichnet Fibonacci-Tools z.B. Retracement, Arc, Fan, Expansion
Description The base of this indicator is an ZigZag algorithm based on ATR and Fibo retracement. The ZigZag can be drawn like a classic ZigZag or like Arrows or needn't be drawn at all. This indicator is not redrawing in sense that the ZigZag's last shoulder is formed right after the appropriate conditions occur on the market. The shoulder doesn't change its direction afterwards (can only continue). There are some other possibilities to show advanced information in this indicator: Auto Fibo on
Deep River AM
Andriy Matviyevs'kyy
The presented indicator is the author's implementation of the idea embodied in the Alligator indicator, which has already become a classic. The proposed product allows you to visually demonstrate the direction of price movement, temporary price rollbacks and zones of multidirectional price movement. Namely: The indicator lines go up and diverge from each other - a strong bullish trend; The indicator lines go down and diverge from each other - a strong bearish trend; The indicator lines go up but
FREE
Simply drop the indicator to the chart and Fibonacci levels will be shown automatically! The indicator is developed for automatic drawing of Fibonacci levels on the chart. It provides the abilities to: Select the standard Fibo levels to be shown Add custom levels Draw the indicator on the timeframes other than the current one. For example, the indicator is calculated on the weekly period (W1) and is displayed on the monthly period (MN1) Select the timeframes the indicator will be available on Ca
TLM Map AM
Andriy Matviyevs'kyy
TLM Map AM (Trend Line Momentum Map) is an indicator developed based on a set of digital technical analysis indicators described in the article by Vladimir Kravchuk: " Digital indicators in the technical analysis of financial markets ". The indicator displays in a separate window a complex of digital technical analysis indicators such as FTLM and STLM. Recommended for use in conjunction with the RTL Map AM (Reference Trend Line Map) indicator. The indicator has no customizable parameters.
FREE
Fibonacci SR Indicator This indicator creates support and resistance lines. This indicator is based on Fibonacci Retracement and Extension levels. It will consider many combinations of the Fibonacci levels and draw support/resistance lines based on these. This indicator uses tops and bottoms drawn by the ZigZag indicator in its calculations. The ZigZag can also be drawn on the chart, if necessary. The indicator considers many combinations of past reversal points and Fibonacci ratio levels, and
FREE
Индикатор высчитывается по сложному авторскому алгоритму. Он строится с учетом тенденции по зонам перекупленности перепроданности объёмов . Это позволяет выявлять дивергенцию объёмов , выявить так называемые приседающие бары. Также он определяет уровни входа в рынок и цели. Средняя линия канала является предполагаемым уровнем отката. RPeriod- период расчета индикатора Indicator_Level - уровень зон перекупленности перепроданности Draw Fibo Levels - отображаем целевые уровни Fibo Level Col
AutoPivot
Hafis Mohamed Yacine
This indicator will draw monthly, weekly, and daily pivot. Pivot line will be calculated automatically again when the period ends. Auto Pivot Metatrader 4 Indicator The Auto Pivot indicator for Metatrader 4 automatically updates the pivot point (PP), support (S1,S2,S3) and resistance levels (r1,r2,r3) every day. Price above the pivot point means positive while price below the pivot point means negative. S3 indicates extremely oversold while price above resistance r3 means extremely overbought.
This Indicator was used on  EA  Advanced Fibo levels . Indicator is designed to trade for most popular Fibonacci strategy that's completely automated. It automatically identifies and show Entry levels included Support/ Resistance Zones , according to the time zone candle by Fibonacci levels. As well as the traditional Fibonacci tool also included. However, it is very user friendly rather than default available one. On the other hand one more tool included. It automatically identifies real Suppo
FREE
This indicator is based on the classic Pivot Points concept combined with additional optimizations and advanced features.  The levels of support and resistance are calculated by taking into account the average historical volatility.  The added multi-symbol scanner allows you to detect the best conditions and trade setups.  You can see in real time the current situation for all of your favorite symbols and you can switch the chart to any symbol with one click. The build in alert system allows you
BSA Indicator
Ahmet Metin Yilmaz
BSA indicator is a ZigZag based indicator. This indicator is used to find the reversal level of the price. You can use the existing risk ratio and calculation timeframe in the entries by optimizing them according to your usage preference.  In lower time frames, the indicator can repaint. For healthier results, you can detect the least repainting by observing for a while according to the graphic you will apply.
DMS Fibo
Diogo Mitsunaga Dos Santos
Fibonacci retracements are trend lines drawn between two significant points, usually between absolute lows and absolute highs, plotted on a chart. Intersecting horizontal lines are placed at the Fibonacci levels. Fibonacci retracements are useful tools that help traders identify support and resistance levels. With the information gathered, they can place orders, identify stop-loss levels, and set price targets. Although useful, traders often use other indicators to make more accurate assessments
This Momentum Seeker indicator is super simple! It is based in a few indicators to give you a quick entry to the Market. Once candle is closed and if parameters are all in place, an arrow is drawn in the chart, so there is no repainting! It works with any instrument!  Risk management and trading skills are still needed! Inputs: Sensitivity: It is based in Periods, so the lower the number, more signals will come to screen but accuracy will decrease also. Recommended is 9 and above Audible_Alerts:
MultiFiboDynamicMT4
Andrey Spiridonov
3.5 (2)
MultiFiboDynamicMT4 is a powerful, professional indicator for estimating the most important support and resistance levels. The main advantage is that it plots the Fibonacci levels at all timeframes simultaneously, which allows the trader to see the full picture of the possible price movement of the trading instrument! Advantages of the indicator The indicator is perfect for scalping and trading binary options. Suitable for beginners and experienced traders. Works on all timeframes. Works on an
FREE
The indicator is designed for determining Fibonacci levels. Does not repaint/redraw The blue level shows the zero Fibonacci value (it is also the Pivot level) Red levels show calculated Fibonacci levels (used as a rollback or reversal point) Automatic period detection (periods can be entered manually) Adjustable display calculation method. Settings BarsHistory - the number of bars to be used to display the indicator. Method - method of calculation. AutoPeriod - automated period calculation (true
PowerBall Signals ist ein KAUF-/VERKAUF-Signalindikator, der auf der Idee der Nutzung von Unterstützungs-/Widerstandszonen basiert. Der Indikator erkennt spezielle Umkehrmuster basierend auf Unterstützungs-/Widerstandszonen und stellt diese Signale auf Ihrem Chart bereit. Die Hauptidee des Indikators besteht darin, die MTF-Analyse (Multi Time Frame) zu verwenden und Signale basierend auf den Niveaus Ihres aktuellen und nächsthöheren Zeitrahmens bereitzustellen. Mit dieser Methode können mögliche
Launch promotion For a limited time only:  30$ instead of 157$ Summary Shows multiple Fibonacci retracements, projections and expansions ratios at a glance Description A Fibonacci confluence level is a price zone where Fibonacci retracements, projections and expansions meet closely when measuring a swing This technique is used by  intermediate and advanced traders to detect possible reversal zones Tired of manually drawing the same Fibonacci ratios for the same X, A, B, C points to eventually f
Koala Fibo Base Time
Ashkan Hazegh Nikrou
3 (1)
Willkommen zur Koala Fibo Base Time     Willkommen in der Koala Fibo Zeitzone     Willkommen bei Koala Fibo Time Extention     Willkommen bei Missed Tool For Meta Trade! Einfache Einführung: Fibonacci-Zeitzonen sind vertikale Linien, die auf der Fibonacci-Sequenz basieren. Diese Linien erstrecken sich entlang der X-Achse (Datumsachse) als Mechanismus zur Vorhersage von Umkehrungen basierend auf der verstrichenen Zeit. Als Ausgangspunkt wird häufig ein großes Tief oder Hoch gewählt.
FREE
This indicator Super Channel Pro indicator.Indicator displays trend movement. Indicator calculates automatically line. Features FiltPer - displays indicator channel period. deviation - displays indicator channel deviation. deviation2 - displays indicator channel deviation. How to understand the status: If the arrow is green, trend is up. If the arrow is red, trend is down. //////////////////////////////////////////////////////////////////////////////////////////////////////////////////////////
Provide ideas for trend trading. Automatic calculation and generation of trend channels. The channel line, also known as the pipeline line, is to draw a straight line parallel to the trend line in the opposite direction of the trend line, and the straight line crosses the highest or lowest price of the recent period. These two lines run the price in the middle and have obvious pipe or channel shapes. Necessary for traders: tools and indicators Waves automatically calculate indicators, chann
There are 8 types of this indicator. Consisted of 1. Bullish and Bearish Engulfing 2. Morning and Evening Star 3. Three Green Soldiers and Three Red Crows 4. Three Inside Up and Down 5. Three Outside Up and Down 6. Bullish and Bearish Harami 7. Tweezers Top and Bottom 8. Piercing and Dark cloud cover Signal Filter :: 1. The appearance of the candle stick 2. SMA 3. 2EMA :: EMA Fast and EMA Slow 4. RSI N otification :: 1. Via screen 2. Email 2. Phone For trading 1. Scaling 2. Binary options
SRP (Strong Retracement/Reversal Points) is a powerful and unique support and resistance indicator. It displays the closest important levels which we expect the price retracement/reversal! If all level are broken from one side, it recalculates and draws new support and resistance levels, so the levels might be valid for several days depending on the market! Key Features You can use it in all time-frames smaller than daily! Displays closest significant support and resistance levels Update the l
Auto Levels
Yaroslav Varankin
Auto Level this tool is able to determine the levels of support and resistance. search and display when the price has broken through the level and when it pushed off from it. the indicator can be useful if you use resistance support levels in your trading. or the highs and lows of the price, then it will greatly simplify your work and help you more quickly and more accurately determine the rebound or breakdown of the current trend or tendencies level. blue line bottom uptrend red line on top dow
Fibonacci Wave Bands Indicator The Fibonacci Wave Bands indicator utilizes Fibonacci ratios to create dynamic bands around a central moving average. These bands are derived from key Fibonacci ratios (typically 38.2%, 50%, 61.8%) and adapt to market volatility, offering insights into potential support and resistance zones. Key Features: Fibonacci Levels: The indicator plots multiple bands above and below a central moving average based on Fibonacci ratios. Dynamic Support and Resistance: Bands ser
Holy Renko PRO
Bianca Seara
3.5 (2)
About  Holy Renko is a trend identifier capable of identify small and long market movements. This indicator should be use in Renko Charts. VIDEO (information and tips) [HERE] How to install Renko Charts [HERE] Features Developed for Renko Charts Easy to analyze Fast signals Not repaint (when candle close)  Statistics panel Filters false signals Alerts, emails and push notifications  Advantages of Renko Chart Easy to install Easy to analyze Filter out the noise of wicks  Easy ident
Fibonacci retracement is an object or function that is often used by traders to determine values of fibonacci levels. When to open position, where is the breakout or limit point, stop loss position and take profit position can be determined based on fibonacci levels. But commonly, this object only can be used manually in Metatrader 4 (MT4).  Therefore we need an indicator of fibonacci retracement. The use of indicator will make decision making easier, faster, and more consistence. We recommend t
FiboRec
Alfred Kamal
This indicator depends on Fibonacci lines but there is a secret lines i used them, by using FiboRec indicator you will be able to know a lot of important information in the market such as: Features You can avoid entry during market turbulence. You can enter orders in general trend only. You will know if the trend is strong or weak. Signal Types and Frame used You can use this indicator just on H1 frame. Enter buy order in case Candle break out the square area and closed over it, at least 20
"The Squeeze indicator attempts to identify periods of consolidation in a market. In general the market is either in a period of quiet consolidation or vertical price discovery. By identifying these calm periods, we have a better opportunity of getting into trades with the potential for larger moves. Once a market enters into a "squeeze," we watch the overall market momentum to help forecast the market direction and await a release of market energy." The StdATR Squeeze Channel combines standard
Käufer dieses Produkts erwarben auch
Scalper Inside PRO
Alexey Minkov
4.75 (60)
An exclusive indicator that utilizes an innovative algorithm to swiftly and accurately determine the market trend. The indicator automatically calculates opening, closing, and profit levels, providing detailed trading statistics. With these features, you can choose the most appropriate trading instrument for the current market conditions. Additionally, you can easily integrate your own arrow indicators into Scalper Inside Pro to quickly evaluate their statistics and profitability. Scalper Inside
Atomic Analyst
Issam Kassas
5 (3)
Zunächst einmal ist es erwähnenswert, dass dieser Handelsindikator nicht neu malt, nicht neu zeichnet und keine Verzögerung aufweist, was ihn sowohl für manuellen als auch für Roboterhandel ideal macht. Benutzerhandbuch: Einstellungen, Eingaben und Strategie. Der Atom-Analyst ist ein PA-Preisaktionsindikator, der die Stärke und das Momentum des Preises nutzt, um einen besseren Vorteil auf dem Markt zu finden. Ausgestattet mit fortschrittlichen Filtern, die helfen, Rauschen und falsche Signale z
Derzeit 20% Rabatt! Die beste Lösung für jeden Neueinsteiger oder Expert Händler! Dieses Dashboard arbeitet mit 28 Währungspaaren. Es basiert auf 2 unserer Hauptindikatoren (Advanced Currency Strength 28 und Advanced Currency Impulse). Es bietet einen hervorragenden Überblick über den gesamten Forex-Markt. Es zeigt die Werte der Advanced Currency Strength, die Veränderungsrate der Währungen und die Signale für 28 Devisenpaare in allen (9) Zeitrahmen. Stellen Sie sich vor, wie sich Ihr Hande
Enigmera
Ivan Stefanov
5 (4)
ENIGMERA: Der Kern des Marktes https://www.enigmera.com Einführung Dieser Indikator und dieses Handelssystem sind ein bemerkenswerter Ansatz für die Finanzmärkte. ENIGMERA nutzt die fraktalen Zyklen zur genauen Berechnung von Unterstützungs- und Widerstandsniveaus. Er zeigt die echte Akkumulationsphase an und gibt Richtung und Ziele vor.  Ein System, das funktioniert, egal ob wir uns in einem Trend oder in einer Korrektur befinden.  Wie funktioniert es? ENIGMERA besteht aus drei Linien: der
Gold Channel is a volatility-based indicator, developed with a specific timing algorithm for the XAUUSD pair, which consists of finding possible corrections in the market. This indicator shows two outer lines, an inner line (retracement line) and an arrow sign, where the theory of the channel is to help identify overbought and oversold conditions in the market. The market price will generally fall between the boundaries of the channel. If prices touch or move outside the channel it is a tra
BITTE LESEN SIE DIE INFORMATIONEN UNTEN, BEVOR SIE DAS PRODUKT KAUFEN! Apollo Pips PLUS SP ist ein einzigartiges Produkt! ES IST FÜR ALLE, DIE MEINEN NEUEN „APOLLO PIPS“-INDIKATOR PLUS „SUPER PACK“-BONUS MIT ZUGRIFF AUF ALLE MEINE HANDELSINDIKATOREN ERHALTEN MÖCHTEN! Mit dem Kauf des Produkts Apollo Pips PLUS SP erwerben Sie tatsächlich eine völlig neue Version meines Apollo Pips-Indikators. Diese Version des Indikators verfügt über einen verbesserten Algorithmus und einen benutzerfreundlichen P
PZ Day Trading
PZ TRADING SLU
3.67 (3)
Dieser Indikator erkennt Preisumkehrungen im Zick-Zack, wobei nur Preisaktionsanalysen und ein Donchian-Kanal verwendet werden. Es wurde speziell für den kurzfristigen Handel entwickelt, ohne dass ein Nachlackieren oder ein Backpainting erforderlich ist. Es ist ein fantastisches Werkzeug für clevere Trader, die darauf abzielen, das Timing ihrer Operationen zu verbessern. [ Installationsanleitung | Update-Anleitung | Fehlerbehebung | FAQ | Alle Produkte ] Erstaunlich einfach zu handeln Es bi
TPSpro RFI Levels
Roman Podpora
4.83 (24)
Reversal First Impulse levels (RFI)    INSTRUCTIONS        RUS       -       ENG              R ecommended to use with an indicator   -   TPSpro  TREND PRO -  Version MT5 A key element in trading is zones or levels from which decisions to buy or sell a trading instrument are made. Despite attempts by major players to conceal their presence in the market, they inevitably leave traces. Our task was to learn how to identify these traces and interpret them correctly. Main functions: Displaying activ
PZ Mean Reversion MT4
PZ TRADING SLU
2.33 (3)
Einzigartiger Indikator, der einen professionellen und quantitativen Ansatz für Mean-Reversion-Trading umsetzt. Es nutzt die Tatsache, dass der Preis auf vorhersehbare und messbare Weise umlenkt und zum Mittelwert zurückkehrt, was klare Ein- und Ausstiegsregeln ermöglicht, die nicht-quantitative Handelsstrategien bei weitem übertreffen. [ Installation Guide | Update Guide | Troubleshooting | FAQ | All Products ] Klare Handelssignale Erstaunlich einfach zu handeln Anpassbare Farben und Größen I
GOLD Impulse with Alert
Bernhard Schweigert
4.56 (9)
Dieser Indikator ist eine hervorragende Kombination aus unseren 2 Produkten Advanced Currency IMPULSE with ALERT  +   Currency Strength Exotics . Es funktioniert für alle Zeitrahmen und zeigt grafisch Impulse der Stärke oder Schwäche für die 8 wichtigsten Währungen plus ein Symbol! Dieser Indikator ist darauf spezialisiert, die Beschleunigung der Währungsstärke für beliebige Symbole wie Gold, Exotische Paare, Rohstoffe, Indizes oder Futures anzuzeigen. Als erster seiner Art kann jedes Sym
This product is based on the methodologies of Gann, his follower Don E. Hall. The Indicator builds a working view grid, which is used to analyze graphics. The Pyrapoint tool, developed by Don Hall, is a grid based on the Pythagorean cube. In his calculations he uses the Gann Square 9 methodology and the relationship between Price and Time. This tool is used to predict changes in trend and overall market actions. More information about the method   HERE
Best Currency Strength Indicator
Tumelo Patrick Rakotsoane
4.6 (48)
Advanced Currency Strength Indicator The Advanced Divergence Currency Strength Indicator. Not only it breaks down all 28 forex currency pairs and calculates the strength of individual currencies across all timeframes , but, You'll be analyzing the WHOLE forex market in 1 window (In just 1 minute) . This indicator is very powerful because it reveals the true movements of the market.  It is highly recommended to  analyze charts knowing the performance of individual currencies or the countries ec
TPSproTREND PrO
Roman Podpora
4.78 (18)
TPSpro TRENDPRO  - is a trend indicator that automatically analyzes the market and provides information about the trend and each of its changes, as well as giving signals for entering trades without redrawing! The indicator uses each candle, analyzing them separately. referring to different impulses - up or down impulse. Exact entry points into transactions for currencies, crypto, metals, stocks, indices!  Version MT5             DETAILED DESCRIPTION              R ecommended to use with an indi
XQ Indicator MetaTrader 4
Marzena Maria Szmit
3.67 (3)
Step into the realm of Forex trading with confidence and precision using XQ, a cutting-edge Forex indicator designed to elevate your trading game to unprecedented heights. Whether you're a seasoned trader or just stepping into the world of currency exchange,   XQ Forex Indicator   empowers you with the insights and signals needed to make informed trading decisions. The signal conditions are a combination of three indicators, and XQ Forex Indicator only display  medium and long-term trends . The
Entry Points Pro
Yury Orlov
4.7 (226)
Dies ist ein Indikator für MT4, der genaue Signale für den Einstieg in einen Handel ohne Repainting (Neuzeichnen) liefert. Er kann auf alle Finanzwerte angewendet werden: Forex, Kryptowährungen, Metalle, Aktien, Indizes. Er liefert ziemlich genaue Schätzungen und sagt Ihnen, wann es am besten ist, eine Position zu eröffnen und zu schließen. Sehen Sie sich das Video (6:22) mit einem Beispiel für die Verarbeitung nur eines Signals an, das sich für den Indikator gelohnt hat! Die meisten Händler ver
Max Paynex
Abdulkarim Karazon
Max Payne ist ein Umkehr-/Trendsignalindikator, der Signale in Form eines Pfeils ausgibt. Dieser Indikator gibt sein Signal beim Schließen desselben Balkens aus. Dieser Indikator kann mehrmals mit unterschiedlichen Perioden auf dem Chart fallen, um eine doppelte/dreifache Bestätigung der Signale zu erhalten Der Indikator ist hochgradig anpassbar, um sich an jeden Handelsstil anzupassen, während er niemals neu lackiert oder rücklackiert wird. Sie erhalten nach dem Kauf das gesamte System, das in
RelicusRoad Pro
Relicus LLC
4.73 (141)
Jetzt 147 US -Dollar (nach ein paar Aktualisierungen auf 499 US -Dollar) - Unbegrenzte Konten (PCs oder MACs) RelicusRoad Benutzerhandbuch + Schulungsvideos + Zugang zur privaten Discord-Gruppe + VIP-Status EINE NEUE ART, DEN MARKT ZU BETRACHTEN RelicusRoad ist der weltweit leistungsstärkste Handelsindikator für Forex, Futures, Kryptowährungen, Aktien und Indizes und gibt Händlern alle Informationen und Tools, die sie benötigen, um profitabel zu bleiben. Wir bieten technische Analysen un
Quantum Currency Array Indicator
QUANTUM TRADING SOFTWARE LIMITED
This indicator has been developed to identify and display these trends quickly and easily, allowing you to see instantly, those currency pairs which are trending, and those which are not – and in all timeframes, with just one click. The 28 currency pairs are displayed as a fan as they sweep from strong to weak and back again, and this is why we call it the ‘currency array’. All 28 pairs are arrayed before you, giving an instant visual description of those pairs that are trending strongly, those
JULY OFFER 80% OFF next price for unlimited version will be 17000$. This is the only time you can get this institutional and professional indicator at this price for unlimited version. Don't dare to miss this. The tool I am about to introduce to you you can't compare it with other tools due to its strategy and accuracy level in predicting the next price directional movement . This tool is designed for serious traders who have decided to make a difference through trading. Be the next person to wi
Wir stellen vor       Quantum Trend Sniper Indicator   , der bahnbrechende MQL5-Indikator, der die Art und Weise, wie Sie Trendumkehrungen erkennen und handeln, verändert! Entwickelt von einem Team erfahrener Händler mit über 13 Jahren Handelserfahrung,       Quantum Trend Sniper-Indikator       wurde entwickelt, um Ihre Trading-Reise mit seiner innovativen Methode zur Identifizierung von Trendumkehrungen mit extrem hoher Genauigkeit auf ein neues Niveau zu heben. ***Kaufe Quantum Trend Snipe
FX Volume
Daniel Stein
4.61 (36)
Erhalten Sie Ihr tägliches Marktupdate mit Details und Screenshots über unser Morning Briefing hier auf mql5 und auf Telegram ! FX Volume ist der ERSTE und EINZIGE Volumenindikator, der einen ECHTEN Einblick in die Marktstimmung aus Sicht eines Brokers bietet. Es bietet fantastische Einblicke in die Positionierung von institutionellen Marktteilnehmern, wie z.B. Brokern, auf dem Forex-Markt, viel schneller als COT-Berichte. Diese Informationen direkt auf Ihrem Chart zu sehen, ist der wahre Game
Cycle Sniper
Elmira Memish
4.44 (39)
NEW YEAR SALE PRICE FOR LIMITED TIME!!! Please contact us after your purchase and we will send you the complimentary indicators to complete the system Cycle Sniper is not a holy grail but when you use it in a system which is explained in the videos, you will feel the difference. If you are not willing to focus on the charts designed with Cycle Sniper and other free tools we provide, we recommend not buying this indicator. We recommend watching the videos about the indiactor and system before pu
Quantum Breakout Indicator PRO
Bogdan Ion Puscasu
4.96 (26)
Wir stellen vor       Quantum Breakout PRO   , der bahnbrechende MQL5-Indikator, der die Art und Weise, wie Sie mit Breakout-Zonen handeln, verändert!   Quantum Breakout PRO   wurde von einem Team erfahrener Händler mit über 13 Jahren Handelserfahrung entwickelt und soll Ihre Handelsreise mit seiner innovativen und dynamischen Breakout-Zonen-Strategie auf ein neues Niveau bringen. Der Quantum Breakout Indicator zeigt Ihnen Signalpfeile auf Breakout-Zonen mit 5 Gewinnzielzonen und Stop-Loss
"The Squeeze indicator attempts to identify periods of consolidation in a market. In general the market is either in a period of quiet consolidation or vertical price discovery. By identifying these calm periods, we have a better opportunity of getting into trades with the potential for larger moves. Once a market enters into a "squeeze," we watch the overall market momentum to help forecast the market direction and await a release of market energy." Modified TTM Squeeze Indicator is a modifica
Der "MultiSymbol & TF Chart Integrated"-Indikator ist darauf ausgelegt, schnell einen umfassenden Marktüberblick zu bieten, sodass Sie bis zu 60 Währungspaare in Ihren bevorzugten Zeitrahmen auf einem einzigen Chart überwachen können (Mehrfachmodus) oder das Paar, das Sie handeln, in allen TFs anzeigen können (Einfachmodus). Hauptvorteile: Umfassende Überwachung: Ermöglicht die Echtzeitüberwachung aller gewünschten Paare auf einem einzigen Chart auf einen Blick. Zeitersparnis: Vermeidet das Ums
AT Forex Indicator MT4
Marzena Maria Szmit
5 (3)
The AT Forex Indicator MT4 is a sophisticated trading tool designed to provide traders with a comprehensive analysis of multiple currency pairs. This   powerful indicator   simplifies the complex nature of the forex market, making it accessible for both novice and experienced traders. AT Forex Indicator uses   advanced algorithms   to detect trends, patterns and is an essential tool for traders aiming to enhance their forex trading performance. With its robust features, ease of use, and reliabl
Dear Traders this is my another tool called " Swing Master Indicator ". As the name above the indicator is designed to help you in swing trading by capturing the low and highs of the price. You may us this tool with any trading strategy and style from scalping to position trading. It is made for level of traders including newbies and advanced traders even prop-firms, hedge funds and banks to help them make sold market analysis. I create tools for serious traders who want to make a difference in
Ultimate Sniper Dashboard
Hispraise Chinedum Abraham
4.85 (27)
Ermäßigt auf $299! Die Preise können in Zukunft steigen! Lesen Sie die Beschreibung unten! Bestes Einstiegssystem für Ultimate Sniper Dashboard: ULTIMATIVE DYNAMISCHE EBENEN. (Bitte überprüfen Sie meine Produkte) Das Ultimate Sniper Dashboard funktioniert NUR auf Live-Märkten aufgrund der MT4 Multicurrency Testlimits. Wir stellen Ihnen das Ultimate-Sniper Dashboard vor! Unser bestes, das sowohl HA-Sniper, MA-Sniper und viele spezielle Modi enthält. Das Ultimate Sniper Dashboard ist ein
NAM Order Blocks
NAM TECH GROUP, CORP.
5 (1)
MT4-Erkennungsanzeige für Auftragsblöcke mit mehreren Zeitrahmen. Eigenschaften - Vollständig anpassbar auf dem Diagrammbedienfeld, bietet vollständige Interaktion. - Verstecken und zeigen Sie das Bedienfeld, wo immer Sie möchten. - Erkennen Sie OBs in mehreren Zeiträumen. - Wählen Sie die anzuzeigende OB-Menge aus. - Verschiedene OBs Benutzeroberfläche. - Verschiedene Filter an OBs. - OB-Näherungsalarm. - ADR High- und Low-Leitungen. - Benachrichtigungsdienst (Bildschirmwar
Indicator : RealValueIndicator Description : RealValueIndicator is a powerful tool designed specifically for trading on the EURUSD pair. This indicator analyzes all EUR and USD pairs, calculates their real currency strength values, and displays them as a single realistic value to give you a head start on price. This indicator will tell you moves before they happen if you use it right. RealValueIndicator allows you to get a quick and accurate overview of the EURUSD currency pair tops and bottoms,
Weitere Produkte dieses Autors
Natürlich, hier ist die Übersetzung in Deutsch: Vorstellung des Astronomie-Indikators für MT4: Dein ultimativer himmlischer Trading-Begleiter Bist du bereit, deine Trading-Erfahrung auf himmlische Höhen zu heben? Suche nicht weiter als unseren revolutionären Astronomie-Indikator für MT4. Dieses innovative Tool übertrifft herkömmliche Trading-Indikatoren und nutzt komplexe Algorithmen, um dir unvergleichliche astronomische Einblicke und präzise Berechnungen zu bieten. Ein Universum an Information
Der Gann Square Indikator ist ein leistungsstolles Marktanalyse-Tool, das auf dem Artikel "Mathematische Formel für Marktvorhersagen" von W.D. Gann basiert. Dieses Tool verwendet mathematische Konzepte und Gann-Theorien für eine präzise Marktanalyse. Es beinhaltet Quadratwerte von 144, 90, 52 und auch das Quadrat von 9. Darüber hinaus integriert es die Methode von  zur Quadratwurzel von 9 und deren Beziehung zu Kanälen und dem Sternmuster. Benutzerhandbuch und Anwendung: Vor der Verwendung diese
Wir stellen Ihnen ON Trade Waves Patterns Harmonic Elliot Wolfe vor, einen fortschrittlichen Indikator, der entwickelt wurde, um verschiedene Markt-Muster mithilfe sowohl manueller als auch automatischer Methoden zu erkennen. Hier ist, wie er funktioniert: Harmonische Muster: Dieser Indikator kann harmonische Muster erkennen, die auf Ihrem Chart erscheinen. Diese Muster sind für Trader, die die Theorie des harmonischen Handels praktizieren, wie sie in Scott Carney's Buch "Harmonic Trading vol 1
Shepherd Harmonic Pattern
Abdullah Alrai
4.68 (59)
Dieser Indikator erkennt harmonische Muster, die manuell oder automatisch auf dem Chart gezeichnet wurden. Sie können das Benutzerhandbuch unter diesem Link einsehen: Fügen Sie Ihre Bewertung hinzu und kontaktieren Sie uns, um es zu erhalten. Es gibt eine kostenlose Version, um dieses Produkt auf MT4 auszuprobieren. Sie können es verwenden, um Gartley- und Nenstar-Muster zu erkennen: https://www.mql5.com/en/market/product/30181 Sie können die vollständige MT4-Version von kaufen: https://www.mql5
ON Trade Pivoteer
Abdullah Alrai
4 (1)
Introducing the Pivot Point Selector Indicator: Your Ultimate Tool for Custom Pivot Levels Are you ready to take your trading to the next level? Say hello to the Pivot Point Selector Indicator, a game-changing tool that puts you in control of your pivot levels. This innovative indicator empowers you to choose three specific points that will determine the pivot level calculations, giving you unparalleled customization and precision in your trading strategy. Key Features and Benefits: Custom Pivo
FREE
This indicator will detect harmonic patterns that are drawn on the chart by manual and automatic methods. You can see user manual from this link: https://www.mql5.com/en/blogs/post/719257 There is a free version (it detect only Gartley and Nenstar Patterns) to try this product. You can buy the full MT4 version from: https://www.mql5.com/en/market/product/104689 Notes When you use this indicator and change the settings, add indicators like Moving Average or Bollinger Bands, this indicator will
FREE
Shepherd Gann Squares Free
Abdullah Alrai
4.86 (37)
Bei diesem Indikator handelt es sich um eine Marktanalysemethode, die auf dem Artikel "Mathematische Formel für Marktprognosen" von W.D. Gann basiert, der auf Quadrat-von-Neun- und Quadrat-von-44-Methoden basiert. Benutzerhandbuch: Add Your review And contact us to get it Sie können die vollständige MT5-Version kaufen von: https://www.mql5.com/en/market/product/28669 Sie können auf MT4 kostenlos testen: https://www.mql5.com/en/market/product/15316 Dieses Produkt kann für Sie
FREE
Der Hikkake japanische Kerzenmuster-Indikator ist ein spezialisiertes Werkzeug, das entwickelt wurde, um alle auf dem Chart gebildeten Hikkake-Preisaktionsmuster zu identifizieren und zu erkennen. Diese Muster basieren auf dem Konzept eines falschen Durchbruchs aus einer Inside-Bar. Der Indikator analysiert die letzten fünf Kerzen auf dem Chart und bestimmt, ob sie die Merkmale des Hikkake-Musters aufweisen. Wenn dieses Muster bestätigt wird, zeichnet der Indikator ein Rechteck um die relevanten
This indicator offers a comprehensive and efficient solution for traders seeking optimal entries in scalping strategies. Leveraging moving averages and stochastic indicators, it employs a systematic approach to identify favorable trade opportunities. The indicator goes beyond mere analysis, actively drawing clear and actionable entry points on your chart, denoted by arrows. Moreover, it provides the convenience of alerts to ensure you never miss these potential setups. Key Features and Benefits:
FREE
ON Trade Marubozu-Kerzenmuster-Indikator Das Marubozu-Kerzenmuster ist ein kraftvolles und unkompliziertes Kerzenmuster, das wertvolle Einblicke in die Marktstimmung und mögliche Trendumkehrungen liefern kann. Es zeichnet sich durch eine Kerze mit sehr kleinem oder nicht vorhandenem Schatten (Lunte) an einem Ende und einem langen Körper aus, der sich in Richtung des vorherrschenden Trends erstreckt. Dieses Muster repräsentiert ein starkes Ungleichgewicht zwischen Käufern und Verkäufern und deute
FREE
ON Trade Pivots is A technical indicator that Draws all Pivot levels depending on time frame that defined in settings. Notes It will be good tool for all traders who use pivot levels in their trades. Let me inform you that this indicator draw this level as buffers not as objects then you can connect it easily to EA. This indicator allow you to find pivots levels for any time frame not only daily you are free to choose time frame from settings. Parameters Use_System_Visuals - Enable /Disable
FREE
Vorstellung des Goldgramm Preisrechner-Indikators Interessieren Sie sich dafür, den Goldpreis in Ihrer lokalen Währung stets im Blick zu behalten? Suchen Sie nicht weiter, denn der Goldgramm Preisrechner-Indikator bietet Ihnen ein innovatives Tool, mit dem Sie den Echtzeitpreis pro Gramm Gold in Ihrer bevorzugten lokalen Währung berechnen können. Mit diesem Indikator können Sie finanzielle Erkenntnisse nutzen, um informierte Entscheidungen zu treffen. Hauptmerkmale: Lokalisierter Goldpreis: Der
FREE
Dieser Indikator dient dazu, den Donchian-Kanal visuell auf Ihrem Handelschart darzustellen. Der Donchian-Kanal ist ein einfaches technisches Werkzeug, das den Bereich zwischen dem höchsten Hoch und dem niedrigsten Tief über einen bestimmten Zeitraum darstellt. Dieser Indikator verbessert die visuelle Analyse von Preisbewegungen und bietet Einblicke in potenzielle Ausbruchspunkte und die Fortsetzung von Trends. Der Donchian-Kanal kann sowohl auf den aktuellen Zeitrahmen als auch auf einen höhere
FREE
"Dieser Indikator ist ein einfaches Werkzeug zur Trenderkennung. Du kannst ihn zusammen mit deiner Strategie verwenden, um gute Einstiege zu erzielen, beispielsweise im Scalping-Modus. Er wird einen Kanal um den Preis herum zeichnen, der sich ausdehnt, wenn die Zeit zunimmt. In benutzerdefinierten Zeiträumen wird er zum Ausgangspunkt der Expansion zurückkehren, basierend auf einem Algorithmus, der Zeit und Preis gemeinsam berücksichtigt. Du kannst am unteren Rand des Kanals kaufen, nachdem Anzei
Rsi Channel
Abdullah Alrai
5 (1)
This indicator displays the channel of Relative Strength Index. When you see that the price touches the red line and retreats from it many times, then you will know that the general trend is down. When it retreats from the blue line many times, that means that the general trend is up. This lines express the RSI values attributed to the price values on the main chart. You can add this indicator to your strategy, it will help you. This indicator will work best on 5 minutes and higher time frames.
Regression Channel Tools" basiert. Durch die Nutzung dieses Tools können Trader eine außergewöhnliche Kontrolle über ihren Chart-Regression-Kanal erlangen und fundiertere Handelsentscheidungen treffen. Das Regression Channel Tool ist ein leistungsstarkes Instrument im Werkzeugkasten eines Traders. Es soll wertvolle Einblicke in Preisentwicklungen und potenzielle Unterstützungs- und Widerstandsniveaus bieten. Das Tool eignet sich besonders gut zur Visualisierung von Korrekturwellen innerhalb eine
"Wir präsentieren unseren leistungsstarken Forex-Indikator, der entwickelt wurde, um deine Handelsstrategie zu verbessern und präzise Einblicke in die Markttrends zu liefern. Dieses innovative Tool verwendet einen anspruchsvollen benutzerdefinierten Algorithmus, der sorgfältig die Messungen der Kerzen analysiert und Anpassungen vornimmt, um eine optimale Genauigkeit zu erzielen. Das Ergebnis? Ein Set von präzise platzierten Pfeilen auf deinem Chart, die strategische Einstiegspunkte anzeigen. Die
"Dieser Indikator erkennt Einträge basierend auf der Bystra-Muster-Theorie und liefert Einstiegswerte zur Platzierung von Limit-Orders mit Ziel- und Stopp-Levels. Dies ermöglicht es Ihnen, Ihr Risikoprozentsatz zu berechnen. Anmerkungen: Dieser Indikator verfügt über Puffer, die seine Verwendung in Expert Advisors (EAs) ermöglichen. Es ist wichtig, beim Arbeiten mit diesem Produkt eine gute Geldverwaltung zu praktizieren. Wenn Sie Ihren Zeitrahmen ändern, wird der Indikator die in Ihrer letzten
Der "Fibo Star" Indikator wurde entwickelt, um Fibonacci-Fächer in Form von Sternen auf Ihrem Handelschart darzustellen. Diese Fibonacci-Fächer sind ein leistungsstarkes Werkzeug zur Analyse von Preisbewegungen und können Einblicke in potenzielle Unterstützungs- und Widerstandsniveaus bieten. Dieser Indikator verfügt über ein benutzerfreundliches Steuerungspanel, das darauf abzielt, den Zeichnungs- und Konfigurationsprozess der Fächer zu vereinfachen und somit Zeit und Aufwand zu sparen. Anleitu
Der "Währungsstärke-Indikator" ist ein leistungsstarkes Werkzeug, das entwickelt wurde, um den Händlern Informationen über die relative Stärke verschiedener Währungen auf dem Devisenmarkt zu liefern. Durch Berechnung und Darstellung der Stärke jeder Währung basierend auf ihrem jeweiligen Zeitrahmen bietet dieser Indikator den Händlern die Möglichkeit, potenzielle Handelsmöglichkeiten zu identifizieren, insbesondere wenn signifikante Divergenzen oder Kreuzungen beobachtet werden. Hauptmerkmale de
Technischer Indikator zur Erkennung starker Preisaktionsmuster: Pin Bar, Inside Bar und Outside Bar Einführung: Im Bereich der technischen Analyse dienen Preisaktionsmuster als wichtige Indikatoren für potenzielle Markt­bewegungen. Wir haben einen anspruchsvollen technischen Indikator entwickelt, der die Identifizierung robuster Preisaktionsmuster auf Charts vereinfacht. Unser Indikator spezialisiert sich auf die Erkennung von drei wesentlichen Mustern: Pin Bar, Inside Bar und Outside Bar. Schlü
Unlock Hidden Insights with the Numerokh Indicator: Your Numerology-Based Support and Resistance Tool Introducing the Numerokh indicator, a revolutionary tool that brings the mystical world of numerology into the realm of trading. Imagine having the power to identify key support and resistance levels on your charts using the age-old wisdom of numerology. This indicator takes trading to a new dimension, offering you a unique way to analyze price movements and make informed trading decisions. Key
Erforschen Sie einen revolutionären Ansatz für den Handel mit dem Shepherd Numerology Levels Indikator. Dieses innovative Tool kombiniert das alte Wissen der Numerologie mit modernen Handelstechniken, um Ihnen bei der Identifizierung wichtiger Unterstützungs- und Widerstandsniveaus auf Ihren Charts zu helfen. Durch die Verwendung der Methode des Quadrats von Neun bietet dieser Indikator eine einzigartige Perspektive auf die Marktmechanismen und ermöglicht Ihnen informiertere Handelsentscheidunge
Vorstellung des ON Trade Numerology Mirror Indikators: Enthüllung versteckter Umkehrmuster durch Numerologie Erkunden Sie eine neue Dimension in der technischen Analyse mit dem ON Trade Numerology Mirror Indikator. Dieses innovative Tool nutzt das alte Wissen der Numerologie, um Schlüsselumkehrniveaus in Ihren Charts zu identifizieren. Durch die Umkehrung von Zahlen in gespiegelte Positionen enthüllt dieser Indikator versteckte Muster, die das Potenzial haben, wichtige Preisumkehrungen anzuzeige
Vorstellung des Maravilla Square Indikators: Dein Werkzeug für vorausschauendes Trading Entdecke den Maravilla Square Indikator, deinen Schlüssel für vorausschauendes Trading. Dieses einzigartige Tool bietet Einblicke in Preisumkehrungen und präsentiert eine Trendlinie, die zwischen Hoch- und Tiefpunkten angepasst werden kann. Dynamik der Trendlinie: Der Maravilla Square Indikator führt die Trendlinie ein, die du an Hoch- und Tiefpunkte im Chart anpassen kannst. Diese dynamische Funktion schafft
Introducing the ON Trade Melad Pattern Indicator: Enhance Your Trading Strategy with Breakout Patterns Discover the power of the ON Trade Melad Pattern Indicator—an intuitive tool designed to elevate your trading decisions by detecting and highlighting breakout patterns on your charts. This indicator is your key to identifying crucial breakout points and potential trend shifts with simplicity and precision. Key Features: Breakout Pattern Detection: The ON Trade Melad Pattern Indicator foc
This indicator will give you entries as result of scalping strategy that will be applied on 14 symbols in same time and you are able to be notified with this entries  Note :   This indicator for scalping on 5 minutes timeframe only . How to use it : 1-Open chart and adjust settings (edit symbols names as your platform names , activate the alert system if you need it . 2-Wait for any signal you have it from this scanner you will have it as alert and as notification and you will see it on bo
This indicator gives you the signal of real cross on stochastic indicator. This indicator is easy to attach to an ea. This indicator will work best on All time frames. Arrow appears depending on many algorithms that study the cross parameters. Indicator properties Use_System_Visuals: enable/disable visual styles. Stochastic_K_Period. Stochastic_D_Period. Stochastic_Slowing. Use_Notifications: enable/disable Push Notifications. Use_Alert: enable/disable Alerts. Use_E_Mail: enable/disable Email
Vorstellung des ON Trade Volaty: Ihre profitabelste Lösung für Volatilitätsausbrüche Entdecken Sie Handelsmöglichkeiten mit dem ON Trade Volaty Indikator. Mithilfe fortschrittlicher Volatilitätsanalyse identifiziert er Ausbruchszonen und führt Ihre Trades mit Präzision. Erfassen Sie Preisbewegungen mit strategischen Einstiegs- und Zielmarken, die alle auf Ihren Handelsstil zugeschnitten sind. Hauptmerkmale: Fortschrittliche Volatilitätsanalyse Strategische Einstiegspunkte Dynamische Zielsetzung
Vorstellung von "ON Trade VSA" - Ihr ultimatives Werkzeug für Volumen- und Verbreitungsanalyse! Entdecken Sie die Kraft der Volumen-Verbreitungs-Analyse (VSA) mit unserem fortschrittlichen Indikator - "ON Trade VSA". VSA ist eine leistungsstarke Methodik, die von Tradern verwendet wird, um Marktkraft zu bewerten, Trends zu identifizieren und fundierte Entscheidungen zu treffen. Lassen Sie uns die wichtigsten Funktionen erkunden, die "ON Trade VSA" zu einem unverzichtbaren Werkzeug in Ihrem Tradi
Auswahl:
Mohd Noor Quddussi Izuywan Bin Mohd Sani
493
 

this indicator is good for elliot wave user like me. and the most important we cannot put other indicator with the same chart, also the support is very good.

Abdullah Alrai
42089
Antwort vom Entwickler Abdullah Alrai 2024.05.16 15:27
Thank you mr mohd
Antwort auf eine Rezension
Version 1.1 2024.05.16
-Bug Fix