• Übersicht
  • Bewertungen
  • Diskussion

Volume Delta Candle

Volume Delta Candles: A Comprehensive Tool for In-Depth Trading Analysis

Unlock a seamless way to interpret trading experience within each candle. With Volume Delta Candles, there's no need for additional volume indicators—everything you need is built in. This advanced tool utilizes lower timeframes or live market data to present the percentage of buying versus selling volume within each candle as an intuitive color-coded bar. Before diving in, ensure you’re familiar with Volume and Volume Delta concepts. 

Key Highlights

  1. Intrabar Volume Insights
    Gain an accurate understanding of trading activity inside each candle without depending on external indicators. This feature simplifies market trends and decision-making by offering a precise view of volume distribution.

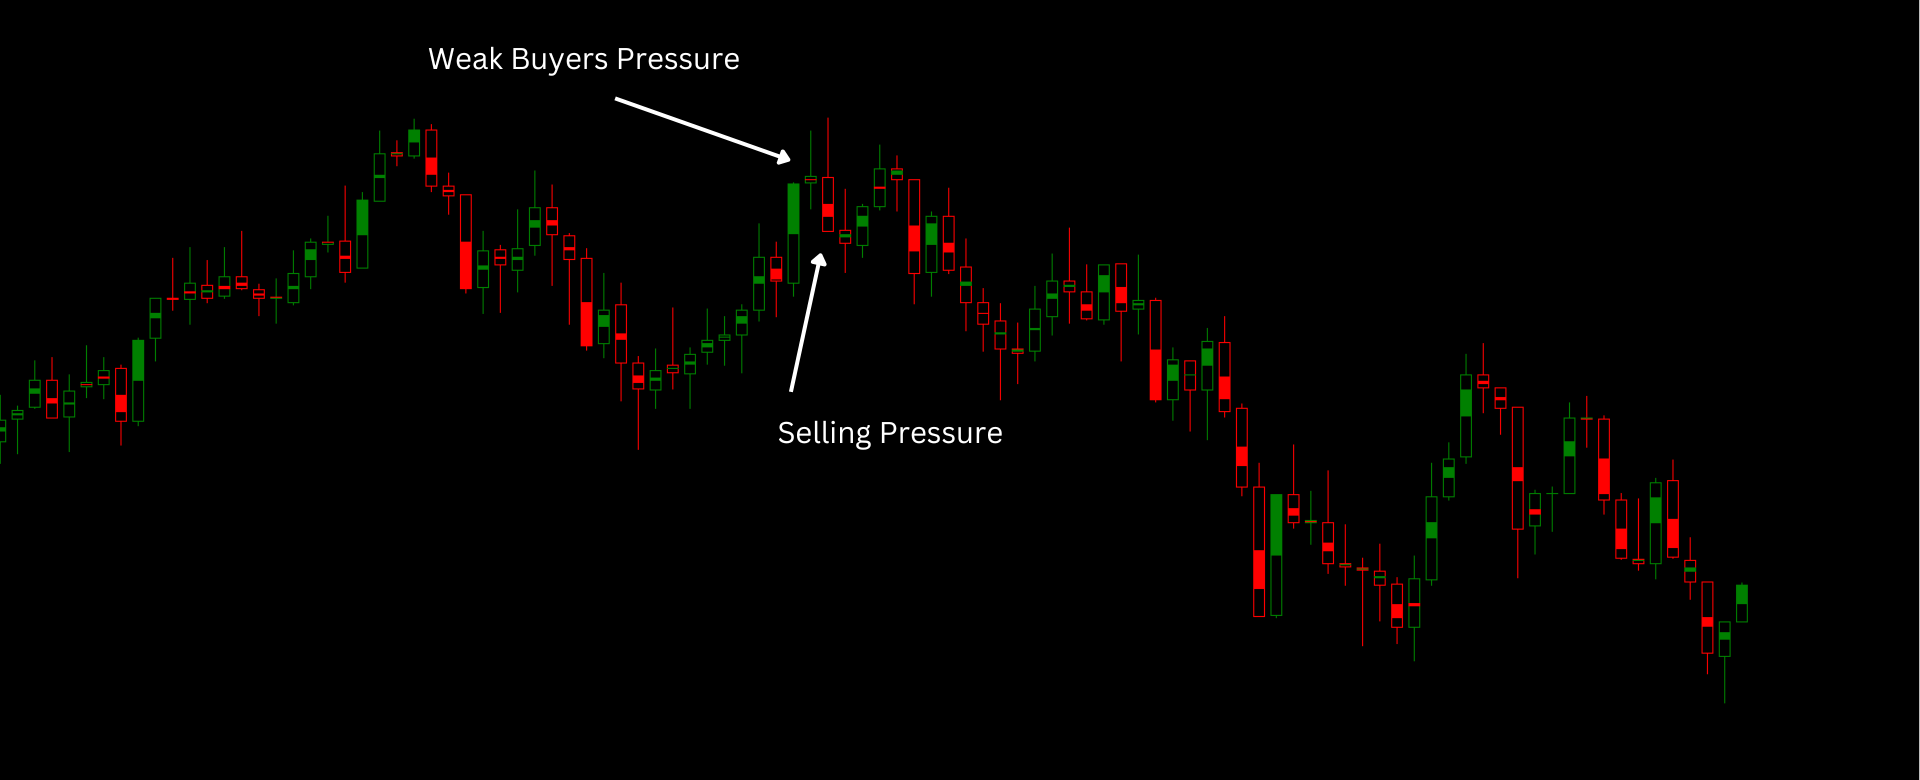
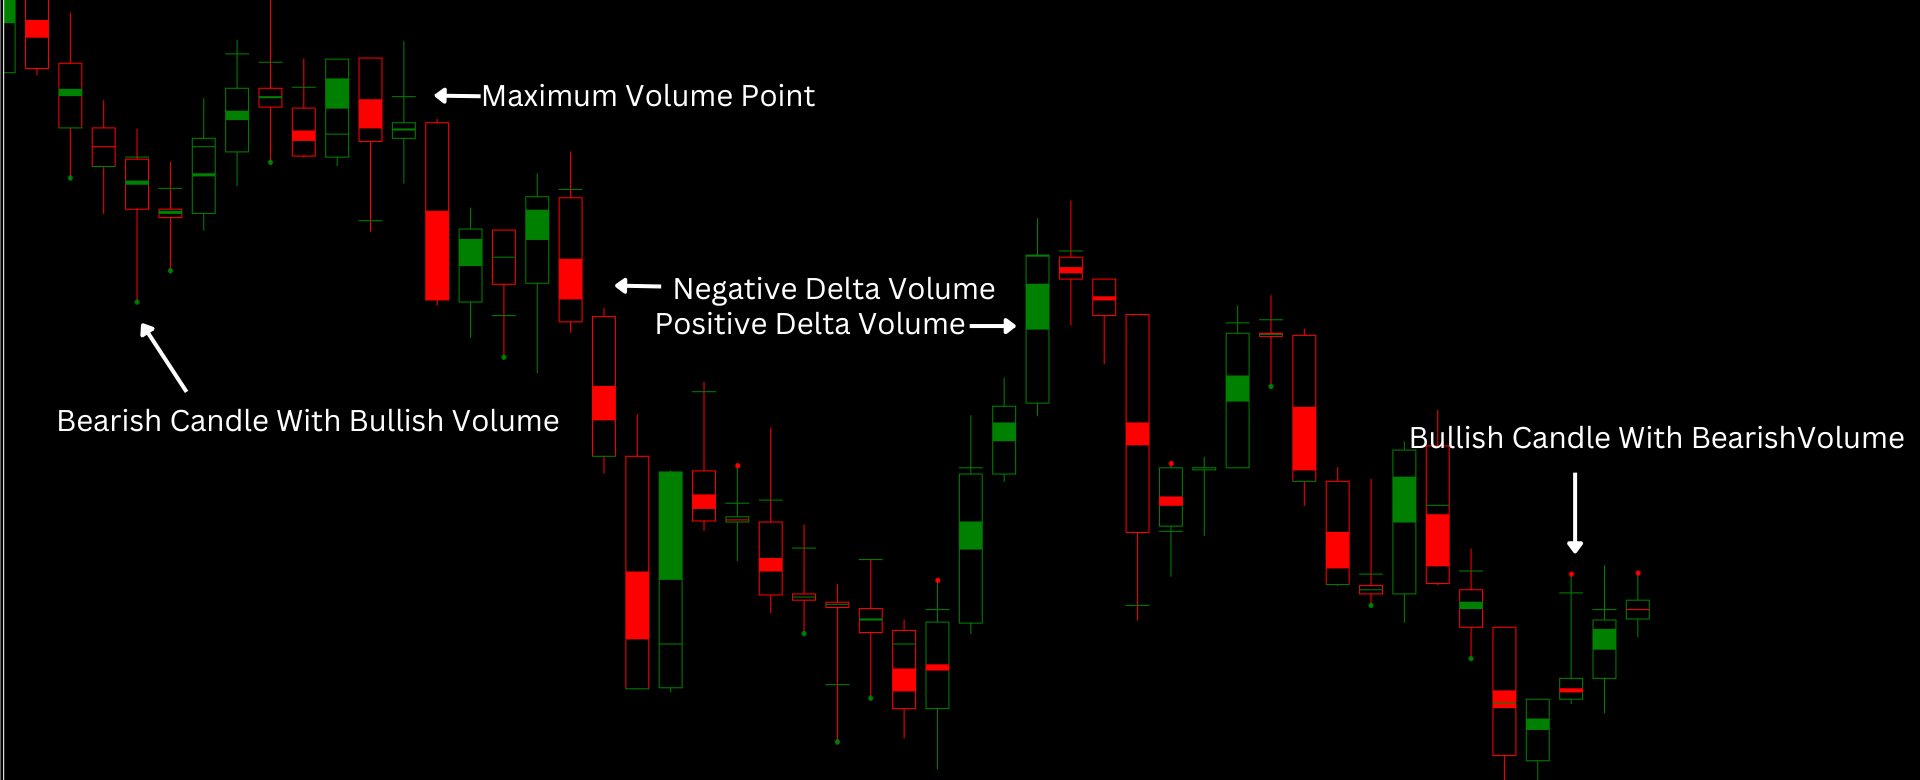
  2. Volume Delta Visualization
    The Volume Delta feature captures the balance between buying and selling volumes. Buying activity (positive delta) is linked to bullish movement and displayed as green, while selling activity (negative delta) appears as red, tied to bearish movement.

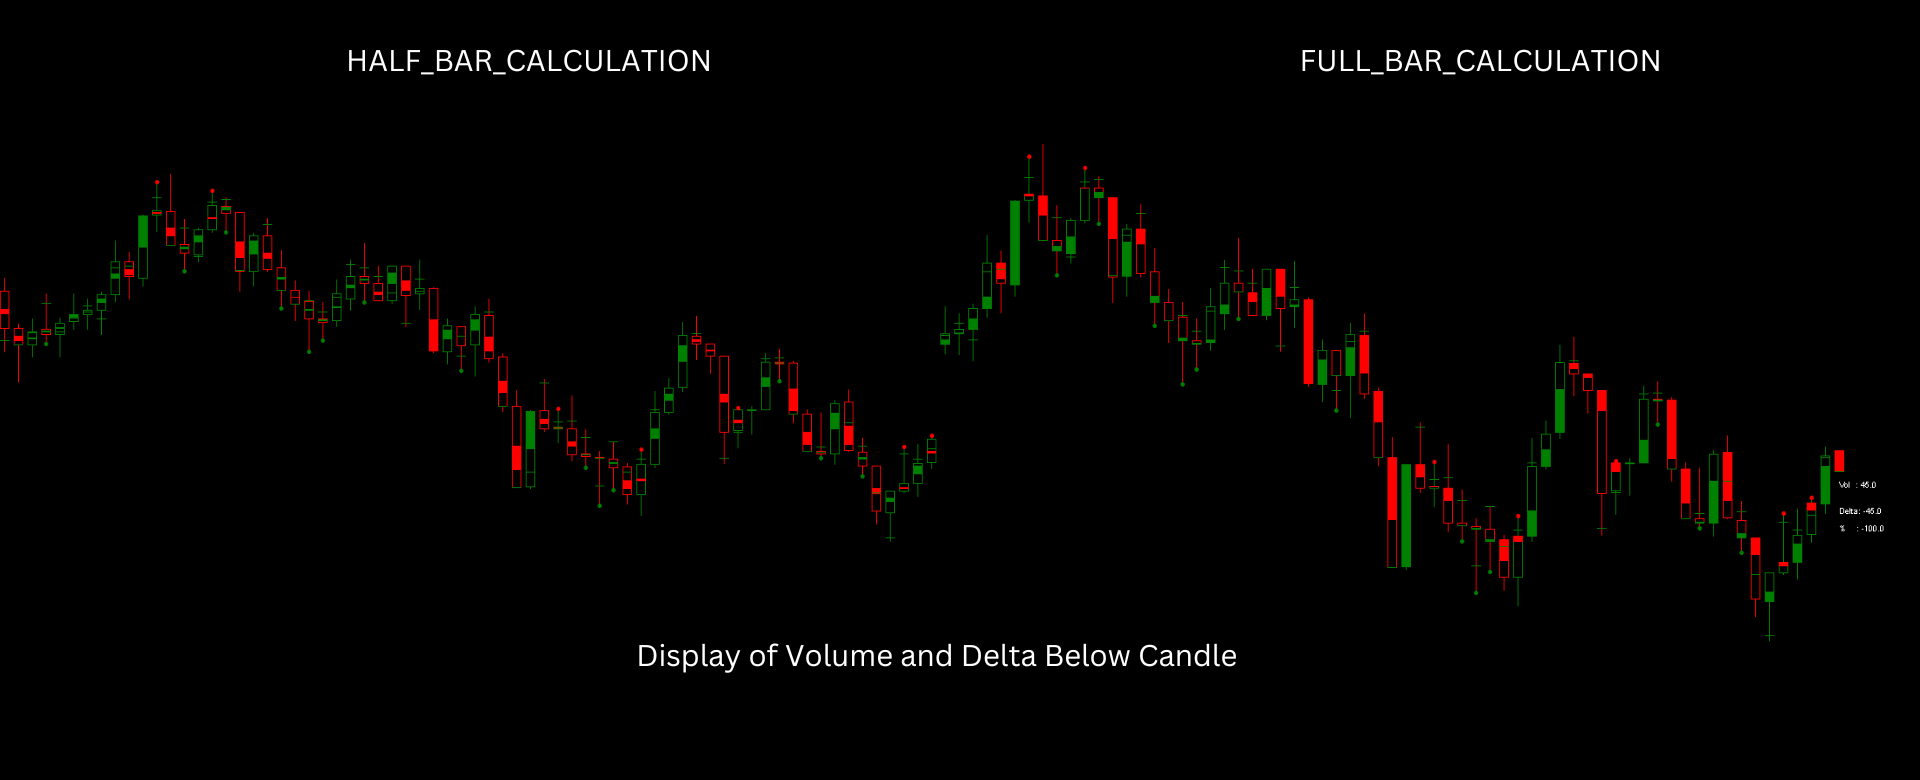
  3. Dynamic Candle Coloring
    Tailor the way candles are displayed with flexible coloring options:

    • Full Bar Mode: Completely fills the candle based on the net volume delta.
    • Half Bar Mode: Colors half of the candle, emphasizing directional volume changes.
      For instance, candles with dominant selling pressure (negative delta) will color from the top or center downward, while buying-dominated candles (positive delta) will color upward.
  4. Volume Peaks Highlighted
    Easily identify the price level with the highest volume within each candle, marked with a precise line. Activate the "Previous Max Volume Price" feature to highlight the peak volume level from the previous candle using a visible dot.

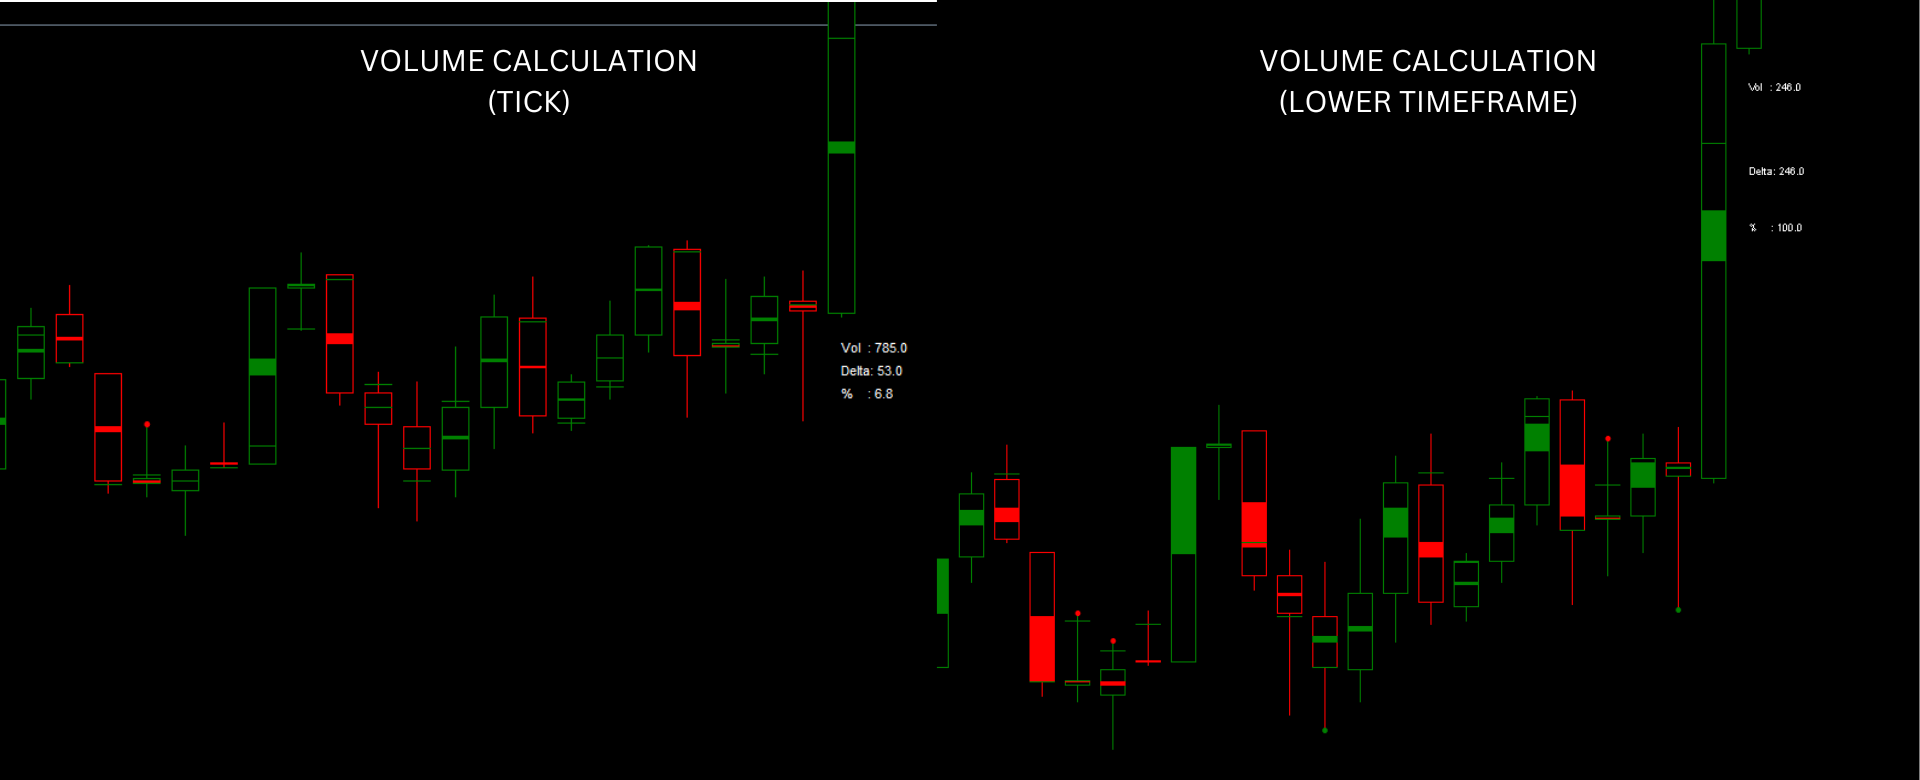
  5. Real-Time Data Integration
    Leverage either live tick data or lower timeframe data to ensure the most accurate and timely analysis for your trading strategy.

Customizable Options for Every Trader

  • Data Selection: Choose between lower timeframe data or real-time tick data to suit your analysis needs.
  • Adjustable Resolution: Modify timeframe settings for enhanced clarity.
  • Volume Display Customization: Select from full-bar or half-bar visualization, paired with personalized color schemes.
  • Max Volume Price Tracking: Enable or disable the previous candle's peak volume level display to streamline your chart view.


Empfohlene Produkte
Owl Smart Levels MT5
Sergey Ermolov
4 (29)
MT4-Version  |  FAQ Der Owl Smart Levels Indikator ist ein komplettes Handelssystem innerhalb eines Indikators, der so beliebte Marktanalysetools wie die fortschrittlichen Fraktale von Bill Williams , Valable ZigZag, das die richtige Wellenstruktur des Marktes aufbaut, und Fibonacci-Levels , die die genauen Einstiegslevels markieren, enthält in den Markt und Orte, um Gewinne mitzunehmen. Detaillierte Strategiebeschreibung Anleitung zur Verwendung des Indikators Berater-Assistent im Handel Owl H
Der SMC Venom Model BPR Indikator ist ein professionelles Tool für Trader, die mit dem Smart Money (SMC)-Konzept arbeiten. Er identifiziert automatisch zwei wichtige Muster im Kurschart: FVG   (Fair Value Gap) ist eine Kombination aus drei Kerzen, wobei zwischen der ersten und dritten Kerze eine Lücke besteht. Diese bildet eine Zone zwischen den Niveaus, in der es keine Volumenunterstützung gibt, was häufig zu einer Kurskorrektur führt. BPR   (Balanced Price Range) ist eine Kombination aus zwe
Statistical Arbitrage Spread Generator for Cointegration [MT5] What is Pair Trading? Pair trading is a market-neutral strategy that looks to exploit the relative price movement between two correlated assets — instead of betting on the direction of the market. The idea? When two assets that usually move together diverge beyond a statistically significant threshold, one is likely mispriced. You sell the expensive one, buy the cheap one , and profit when they converge again. It’s a statistica
FREE
The Penta-O is a 6-point retracement harmonacci pattern which usually precedes big market movements. Penta-O patterns can expand and repaint quite a bit. To make things easier this indicator implements a twist: it waits for a donchian breakout in the right direction before signaling the trade. The end result is an otherwise repainting indicator with a very reliable trading signal. The donchian breakout period is entered as an input. [ Installation Guide | Update Guide | Troubleshooting | FAQ | A
Was: $249  Now: $149   Market Profile defines a number of day types that can help the trader to determine market behaviour. A key feature is the Value Area, representing the range of price action where 70% of trading took place. Understanding the Value Area can give traders valuable insight into market direction and establish the higher odds trade. It is an excellent addition to any system you may be using. Inspired by Jim Dalton’s book “Mind Over Markets”, this indicator is designed to suit the
Wapv Price and volume
Eduardo Da Costa Custodio Santos
Der WAPV Price and Volume Indicator for MT5 ist Teil des Toolsets (Wyckoff Academy Wave Market) und (Wyckoff Academy Price and Volume). Der WAPV-Preis- und Volumenindikator für MT5 wurde entwickelt, um die Volumenbewegung auf dem Chart auf intuitive Weise einfach zu visualisieren. Damit können Sie die Momente des Spitzenvolumens und Momente beobachten, in denen der Markt kein professionelles Interesse hat Identifizieren Sie Momente, in denen sich der Markt durch Trägheit bewegt und nicht durch d
Premium-Level ist ein einzigartiger Indikator mit mehr als 80% Genauigkeit der richtigen Vorhersagen! Dieser Indikator wurde von den besten Trading-Spezialisten seit mehr als zwei Monaten getestet! Den Indikator des Autors finden Sie nirgendwo anders! Anhand der Screenshots können Sie sich von der Genauigkeit dieses Tools überzeugen! 1 ist ideal für den Handel mit binären Optionen mit einer Ablaufzeit von 1 Kerze. 2 funktioniert bei allen Währungspaaren, Aktien, Rohstoffen, Kryptowährungen
Noize Absorption Index - is the manual trading system that measures the difference of pressure between bears forces and bulls forces. Green line - is a noize free index that showing curent situation. Zero value of index shows totally choppy/flat market.Values above zero level shows how powerfull bullish wave is and values below zero measures bearish forces.Up arrow appears on bearish market when it's ready to reverse, dn arrow appears on weak bullish market, as a result of reverse expectation.
Sind Sie es leid, Unterstützungs- und Widerstandslinien zu zeichnen? Der Unterstützungswiderstand ist ein Multi-Zeitrahmen-Indikator, der Unterstützungs- und Widerstandslinien mit einer sehr interessanten Wendung automatisch erkennt und zeichnet: Wenn das Preisniveau im Laufe der Zeit getestet wird und seine Bedeutung zunimmt, werden die Linien dicker und dunkler. [ Installationsanleitung | Update-Anleitung | Fehlerbehebung | FAQ | Alle Produkte ] Steigern Sie Ihre technische Analyse über Nacht
An indicator of pattern #31 ("Long Island") from Encyclopedia of Chart Patterns by Thomas N. Bulkowski. The second gap is in the opposite direction. Parameters: Alerts - show alert when an arrow appears   Push - send a push notification when an arrow appears (requires configuration in the terminal) GapSize - minimum gap size in points ArrowType - a symbol from 1 to 17 ArrowVShift - vertical shift of arrows in points   ShowLevels - show levels ColUp - color of an upward line ColDn - color of a d
Order Book, known also as Market Book, market depth, Level 2, - is a dynamically updated table with current volumes of orders to buy and to sell specific financial instument at price levels near Bid and Ask. MetaTrader 5 provides the means for receiving market book from your broker, but in real time only, without access to its history. The indicator OrderBook Cumulative Indicator accumulates market book data online and visualizes them on the chart. In addition, the indicator can show the market
No Demand No Supply MT5
Trade The Volume Waves Single Member P.C.
No Demand No Supply   This indicator identifies   No Demand –No Supply candles to your chart and plots volume bars colored according to the signal. It can be applied to all timeframes or to a specific one only. It can also be used as regular volume indicator  with exceptional future of WEIGHTED VOLUME. Furthermore is has an alert notification, sound and email when a signals occurs. The indicator does not repaint but the alert will come on two candles back due to the definition of No Demand No Su
Cumulative delta indicator As most traders believe, the price moves under the pressure of market buying or selling. When someone redeems an offer standing in the cup, the deal is a "buy". If someone pours into the bid standing in the cup - the deal goes with the direction of "sale". The delta is the difference between purchases and sales. A cumulative delta - the difference between the cumulative sum of purchases and sales for a certain period of time. It allows you to see who is currently contr
Der Indikator erstellt aktuelle Notierungen, die mit historischen verglichen werden können, und auf dieser Grundlage eine Preisbewegungsprognose erstellen. Der Indikator verfügt über ein Textfeld zur schnellen Navigation zum gewünschten Datum. Optionen: Symbol - Auswahl des Symbols, das der Indikator anzeigen soll; SymbolPeriod - Auswahl des Zeitraums, aus dem der Indikator Daten aufnimmt; IndicatorColor - Indikatorfarbe; HorisontalShift - Verschiebung der vom Indikator gezeichneten Kurse u
Crash 1000 Scalping Indicator for the Crash 1000 Deriv Synthetic Index. Introduction The Crash 1000 Scalping Indicator is a specialized tool designed for the Crash 1000 index on the Deriv Synthetic market. This indicator is particularly useful for scalping on the M1 timeframe, helping traders to identify precise entry and exit points for buy positions. It is designed to be non-repainting, providing clear signals with audible alerts and push notifications, and is compatible with mobile devices th
BoxChart MT5
Evgeny Shevtsov
5 (7)
The market is unfair if only because 10% of participants manage 90% of funds. An ordinary trader has slim changes to stand against these "vultures". This problem can be solved. You just need to be among these 10%, learn to predict their intentions and move with them. Volume is the only preemptive factor that faultlessly works on any timeframe and symbol. First, the volume appears and is accumulated, and only then the price moves. The price moves from one volume to another. Areas of volume accumu
Double HMA MTF for MT5
Pavel Zamoshnikov
4 (4)
This is an advanced multi-timeframe version of the popular Hull Moving Average (HMA) Features Two lines of the Hull indicator of different timeframes on the same chart. The HMA line of the higher timeframe defines the trend, and the HMA line of the current timeframe defines the short-term price movements. A graphical panel with HMA indicator data from all timeframes at the same time . If the HMA switched its direction on any timeframe, the panel displays a question or exclamation mark with a tex
Dies ist wahrscheinlich der vollständigste Indikator für die automatische Erkennung der harmonischen Preisbildung, den Sie für die MetaTrader-Plattform finden können. Es erkennt 19 verschiedene Muster, nimmt Fibonacci-Projektionen genauso ernst wie Sie, zeigt die potenzielle Umkehrzone (PRZ) an und findet geeignete Stop-Loss- und Take-Profit-Werte. [ Installationsanleitung | Update-Anleitung | Fehlerbehebung | FAQ | Alle Produkte ] Es erkennt 19 verschiedene harmonische Preisbildungen Darges
This indicator obeys the popular maxim that: "THE TREND IS YOUR FRIEND" It paints a Blue line for BUY and also paints a RED line for SELL. (you can change the colors). It gives alarms and alerts of all kinds. can be used for all currency pairs and timeframes. Yes, as easy and simple as that. Even a newbie can use it to make great and reliable trades. MetaTrader 4 Version    
Renko Gold
Ignacio Agustin Mene Franco
Renko Gold! clearly indicates the floors and ceilings where it goes from 4 lines, the line below that marks the floor in green confirming with the thinnest line clarifies the purchase entry, the same is for sale, the top line marks the ceiling and the thinnest red line marks the sale, This indicator works for all temporalities! For Forex and Synthetic Indices markets! It also works for crypto markets! Good profit! World Investor.
Your Trend Friend
Luigi Nunes Labigalini
5 (1)
The trend is your friend! Look at the color of the indicator and trade on that direction. It does not  repaint. After each candle is closed, that's the color of the trend. You can focus on shorter faster trends or major trends, just test what's most suitable for the symbol and timeframe you trade. Simply change the "Length" parameter and the indicator will automatically adapt. You can also change the color, thickness and style of the lines. Download and give it a try! There are big movements w
This indicator presents an alternative approach to identify Market Structure. The logic used is derived from learning material created by   DaveTeaches (on X) Upgrade v1.10: + add option to put protected high/low value to buffer (figure 11, 12) + add  Retracements  value to buffer when Show Retracements When quantifying Market Structure, it is common to use fractal highs and lows to identify "significant" swing pivots. When price closes through these pivots, we may identify a Market Structure S
Diese innovative Währung Stärke Messindikator von INFINITY ist ein unverzichtbarer Helfer für Scalper und Händler, die in langen Handel. Das System der Analyse der Stärke / Schwäche der Währungen ist seit langem bekannt und wird auf dem Markt von den führenden Händlern der Welt verwendet. Jeder Arbitrage-Handel kommt nicht ohne diese Analyse aus. Unser Indikator bestimmt leicht die Stärke der zugrunde liegenden Währungen in Bezug aufeinander. Es zeigt Liniendiagramme für alle oder das aktuelle
This indicator uses the metaquotes ZigZag indicator as base to plot fibonacci extension and fibonacci retracement based in the Elliot waves. A fibonacci retracement will be plotted on every wave draw by the ZigZag. A fibonacci extension will be plotted only after the 2nd wave. Both fibonacci will be updated over the same wave tendency. Supporting until 9 consecutive elliot waves. Parameters: Depth: How much the algorithm will iterate to find the lowest and highest candles Deviation: Amount of
Volume Profile V6
Andrey Kolesnik
4.5 (2)
The volume profile indicator of the market + a S mart oscillator . It works on almost all instruments - currency pairs , stocks , futures , cryptocurrency , on real volumes and on tick ones . You can set both the automatic definition of the profile range , for example , for a week or a month , etc . , and set the range manually by moving the boundaries ( two vertical lines red and blue ) . It is shown as a histogram . The width of the histogram at this level means , conditionally , the number of
Dies ist ein MTF-Indikator für Unterstützungs- und Widerstandsniveaus basierend auf den   Extremwerten des Advanced ZigZag Dynamic   und/oder   Extended Fractal   Indikators mit Preisetiketten (kann deaktiviert werden). Für den MTF-Modus können höhere TFs ausgewählt werden. Standardmäßig werden die Ebenen basierend auf ZigZag-Indikatorpunkten generiert. Fraktale Indikatorpunkte können auch zusammen mit ZigZag oder stattdessen verwendet werden. Um die Verwendung zu vereinfachen und CPU-Zeit zu sp
Der DYJ-BoS-Indikator identifiziert und markiert automatisch die wesentlichen Elemente von Marktstrukturverschiebungen, darunter: Ausbruch aus der Struktur (BoS): Wird erkannt, wenn der Preis eine signifikante Bewegung macht und einen vorherigen Strukturpunkt durchbricht. Es markiert mögliche Aufwärtstrendlinien und Abwärtstrendlinien (UP & DN, d. h. kontinuierliche neue Hochs und neue Tiefs), und sobald der Preis diese Linien durchbricht, markiert es rote (BEAR) und grüne (BULL) Pfeile Ein
Zunächst einmal ist es wichtig zu betonen, dass dieses Handelstool ein Nicht-Repaint-, Nicht-Redraw- und Nicht-Verzögerungsindikator ist, was es ideal für professionelles Trading macht. Online-Kurs, Benutzerhandbuch und Demo. Der Smart Price Action Concepts Indikator ist ein sehr leistungsstarkes Werkzeug sowohl für neue als auch erfahrene Händler. Er vereint mehr als 20 nützliche Indikatoren in einem und kombiniert fortgeschrittene Handelsideen wie die Analyse des Inner Circle Traders und Str
Volumes Direction MT5
William Oswaldo Mayorga Urduy
LAUTSTÄRKE RICHTUNG MT5 Normalerweise ändert sich die Farbe der Lautstärkeanzeige, wenn die aktuelle Lautstärke höher als die vorherige ist. Dies ist wichtig, aber nicht sehr nützlich. Aus diesem Grund wurde dieser Indikator erstellt, der zusätzlich zum normalen Volumen, wenn die Kerze bullisch oder bärisch ist, sie in einer anderen Farbe anmalt, standardmäßig blau für bullisch und rot für bärisch, aber diese Farben können angepasst werden Geschmack des Händlers. Vergessen Sie nicht, sich
Mine Farm
Maryna Kauzova
Mine Farm is one of the most classic and time-tested scalping strategies based on the breakdown of strong price levels. Mine Farm is the author's modification of the system for determining entry and exit points into the market... Mine Farm - is the combination of great potential with reliability and safety. Why Mine Farm?! - each order has a short dynamic Stop Loss - the advisor does not use any risky methods (averaging, martingale, grid, locking, etc.) - the advisor tries to get the most
Käufer dieses Produkts erwarben auch
Trend Screener Pro MT5
STE S.S.COMPANY
4.85 (79)
Nutzen Sie die Macht des Trendhandels mit Trend Screener Indicator: Ihrer ultimativen Trendhandelslösung, die auf Fuzzy-Logik und einem System mit mehreren Währungen basiert! Steigern Sie Ihren Trendhandel mit Trend Screener, dem revolutionären Trendindikator mit Fuzzy-Logik. Es handelt sich um einen leistungsstarken Trendfolgeindikator, der über 13 Premium-Tools und -Funktionen sowie 3 Handelsstrategien kombiniert und ihn zu einer vielseitigen Wahl macht, um Ihren Metatrader in einen Trendanaly
MONEYTRON – ТВОЙ ЛИЧНЫЙ СИГНАЛ НА УСПЕХ! XAUUSD | AUDUSD | USDJPY | BTCUSD Поддержка таймфреймов: M5, M15, M30, H1 Почему трейдеры выбирают Moneytron? 82% успешных сделок — это не просто цифры, это результат продуманной логики, точного алгоритма и настоящей силы анализа. Автоматические сигналы на вход — не нужно гадать: когда покупать, когда продавать. 3 уровня Take Profit — ты сам выбираешь свой уровень прибыли: безопасный, уверенный или максимум. Четкий Stop Loss — контролируешь риск
Algo Pumping
Ihor Otkydach
5 (7)
PUMPING STATION – Ihre persönliche „All-inclusive“-Strategie Wir präsentieren Ihnen PUMPING STATION – einen revolutionären Forex-Indikator, der Ihr Trading in eine spannende und effektive Erfahrung verwandeln wird. Es handelt sich nicht nur um ein Hilfsmittel, sondern um ein vollwertiges Handelssystem mit leistungsstarken Algorithmen, die Ihnen helfen, stabiler zu traden. Beim Kauf dieses Produkts erhalten Sie KOSTENLOS: Exklusive Set-Dateien: Für automatische Einrichtung und maximale Leistung.
Golden Trend Indicator MT5
Noha Mohamed Fathy Younes Badr
4.89 (18)
Golden Trend indicator  is The best indicator for predicting trend movement this indicator never lags and never repaints and never back paints    and give  arrow buy and sell    before the candle appear  and it will help you and  will make your trading decisions clearer its work on all currencies and  gold and crypto and all time frame This unique  indicator uses very secret algorithms to catch the  trends, so you can trade using this indicator and see the trend clear on charts  manual guide and
FX Volume MT5
Daniel Stein
4.82 (17)
FX Volume: Erleben Sie den echten Marktüberblick aus der Sicht eines Brokers Kurzüberblick Möchten Sie Ihre Handelsstrategie auf das nächste Level bringen? FX Volume liefert Ihnen Echtzeit-Einblicke in die Positionierung von Retail-Tradern und Brokern — lange bevor verzögerte Berichte wie der COT verfügbar sind. Ob Sie nach beständigen Gewinnen streben oder einfach einen tieferen Vorteil am Markt suchen, FX Volume hilft Ihnen, große Ungleichgewichte zu erkennen, Breakouts zu bestätigen und Ihr
Support And Resistance Screener ist ein Level-Indikator für MetaTrader, der mehrere Tools innerhalb eines Indikators bietet. Die verfügbaren Werkzeuge sind: 1. Marktstruktur-Screener. 2. Bullische Pullback-Zone. 3. Bärische Pullback-Zone. 4. Tägliche Pivot-Punkte 5. wöchentliche Pivots-Punkte 6. monatliche Pivots-Punkte 7. Starke Unterstützung und Widerstand basierend auf harmonischem Muster und Volumen. 8. Zonen auf Bankebene. ZEITLICH BEGRENZTES ANGEBOT: HV Support and Resistance Indicator ist
FX Power MT5 NG
Daniel Stein
5 (14)
FX Power: Analysieren Sie die Stärke von Währungen für intelligentere Handelsentscheidungen Übersicht FX Power ist Ihr unverzichtbares Werkzeug, um die tatsächliche Stärke von Währungen und Gold unter allen Marktbedingungen zu verstehen. Indem Sie starke Währungen kaufen und schwache verkaufen, vereinfacht FX Power Ihre Handelsentscheidungen und deckt Chancen mit hoher Wahrscheinlichkeit auf. Ob Sie Trends folgen oder extreme Delta-Werte nutzen, um Umkehrungen zu prognostizieren, dieses Tool p
Grabber System MT5
Ihor Otkydach
5 (5)
Ich präsentiere Ihnen den hervorragenden technischen Indikator Grabber, der als eine vollständig einsatzbereite „All-Inclusive“-Handelsstrategie funktioniert. In einem einzigen Code sind leistungsstarke Werkzeuge zur technischen Marktanalyse, Handelssignale (Pfeile), Alarmfunktionen und Push-Benachrichtigungen integriert. Jeder Käufer dieses Indikators erhält zusätzlich kostenlos: Grabber Utility: ein Tool zur automatischen Verwaltung offener Orders Schritt-für-Schritt-Videoanleitung: wie man de
Quantum TrendPulse
Bogdan Ion Puscasu
5 (13)
Wir stellen   Quantum TrendPulse   vor, das ultimative Handelstool, das die Leistung von   SuperTrend   ,   RSI   und   Stochastic   in einem umfassenden Indikator vereint, um Ihr Handelspotenzial zu maximieren. Dieser Indikator wurde für Händler entwickelt, die Präzision und Effizienz suchen, und hilft Ihnen dabei, Markttrends, Momentumverschiebungen und optimale Ein- und Ausstiegspunkte sicher zu erkennen. Hauptmerkmale: SuperTrend-Integration:   Folgen Sie problemlos dem vorherrschenden Markt
TPSproTREND PrO MT5
Roman Podpora
4.72 (18)
VERSION MT4        —        ИНСТРУКЦИЯ RUS           —        INSTRUCTIONS  ENG Hauptfunktionen: Präzise Eingangssignale OHNE RENDERING! Wenn ein Signal erscheint, bleibt es relevant! Dies ist ein wichtiger Unterschied zu Redraw-Indikatoren, die ein Signal liefern und es dann ändern können, was zu einem Verlust des eingezahlten Geldes führen kann. Jetzt können Sie mit größerer Wahrscheinlichkeit und Genauigkeit in den Markt eintreten. Es gibt auch eine Funktion zum Einfärben der Kerzen nach dem
Gold Stuff mt5
Vasiliy Strukov
4.93 (178)
Gold Stuff mt5-Ein Trendindikator, der speziell für Gold entwickelt wurde, kann auch auf allen Finanzinstrumenten verwendet werden. Der Indikator wird nicht neu gezeichnet und verzögert sich nicht. Empfohlener Zeitrahmen H1. WICHTIG! Kontaktieren Sie mich sofort nach dem Kauf, um Anweisungen und Bonus zu erhalten!     Sie können eine kostenlose Kopie unseres Strong Support- und Trendscanner-Indikators erhalten, bitte senden Sie uns eine persönliche Nachricht. Mich! DATEN Draw Arrow - inkl.a
FX Levels MT5
Daniel Stein
5 (4)
FX Levels: Außerordentlich präzise Unterstützungs- und Widerstandszonen für alle Märkte Kurzüberblick Suchen Sie eine verlässliche Methode, um Support- und Resistance-Level in jedem Markt zu identifizieren—egal ob Währungspaare, Indizes, Aktien oder Rohstoffe? FX Levels vereint die traditionelle „Lighthouse“-Methode mit einem modernen dynamischen Ansatz und bietet nahezu universelle Genauigkeit. Durch unsere Erfahrung mit echten Brokern sowie automatischen täglichen und Echtzeit-Updates hilft
Matrix Arrow Indicator MT5
Juvenille Emperor Limited
5 (13)
Matrix Arrow Indicator MT5   ist ein einzigartiger 10-in-1-Trend, der zu   100 % nicht neu gezeichnet   werden kann. Multi-Timeframe-Indikator, der für alle Symbole/Instrumente verwendet werden kann:   Forex ,   Rohstoffe ,   Kryptowährungen ,   Indizes ,   Aktien .  Der  Matrix Arrow Indicator MT5  wird den aktuellen Trend in seinen frühen Stadien bestimmen und Informationen und Daten von bis zu 10 Standardindikatoren sammeln, die sind: Durchschnittlicher Richtungsbewegungsindex (ADX) Rohstoff
IX Power MT5
Daniel Stein
4.86 (7)
IX Power: Markteinblicke für Indizes, Rohstoffe, Kryptowährungen und Forex Überblick IX Power ist ein vielseitiges Tool zur Analyse der Stärke von Indizes, Rohstoffen, Kryptowährungen und Forex-Symbolen. Während FX Power die höchste Präzision für Währungspaare bietet, indem es alle verfügbaren Paardaten einbezieht, konzentriert sich IX Power ausschließlich auf die Marktdaten des zugrunde liegenden Symbols. Dies macht IX Power zu einer hervorragenden Wahl für Nicht-Forex-Märkte und zu einem zuv
TPSpro RFI Levels MT5
Roman Podpora
4.55 (20)
Umkehrzonen / Spitzenvolumina / Aktive Zonen eines Hauptakteurs = TS TPSPROSYSTEM ANLEITUNG RUS    /    ANWEISUNGEN     ENG          /          Version MT4      Jeder Käufer dieses Indikators erhält zusätzlich KOSTENLOS: 6 Monate Zugriff auf Handelssignale vom Dienst RFI SIGNALS – vorgefertigte Einstiegspunkte gemäß dem TPSproSYSTEM-Algorithmus. Schulungsmaterialien mit regelmäßigen Updates – tauchen Sie in die Strategie ein und steigern Sie Ihr berufliches Niveau. 24/5-Support an Wochentagen u
MTF Supply Demand Zones MT5
Georgios Kalomoiropoulos
5 (1)
Automatisierte Angebots- und Nachfragezonen der nächsten Generation. Neuer und innovativer Algorithmus, der bei jedem Diagramm funktioniert. Alle Zonen werden dynamisch entsprechend der Preisbewegung des Marktes erstellt. ZWEI ARTEN VON WARNUNGEN --> 1) WENN DER PREIS EINE ZONE ERREICHT 2) WENN EINE NEUE ZONE BILDET WIRD Sie erhalten keinen weiteren nutzlosen Indikator. Sie erhalten eine vollständige Handelsstrategie mit nachgewiesenen Ergebnissen.     Neue Eigenschaften:     Warnungen, w
Der Precision Index Oscillator (Pi-Osc) von Roger Medcalf von Precision Trading Systems Version 2 wurde sorgfältig neu codiert, um extrem schnell auf Ihrem Chart geladen zu werden, und es wurden einige andere technische Verbesserungen eingearbeitet, um die Erfahrung zu verbessern. Pi-Osc wurde entwickelt, um genaue Handelstimingsignale bereitzustellen, die darauf abzielen, extreme Erschöpfungspunkte zu finden, an die die Märkte gezwungen werden, um einfach die Stops aller herauszunehmen. Die
The   Time_Price_SQ9_Degree   indicator is based on the 9 Gann square. Using this indicator, you can identify strong time and price zones. The indicator displays the levels as a degree value. The degrees can be set in the settings. After launching, the MENU button appears. If it is highlighted, it can be moved to any point on the graph, and after double-clicking on it, it stops being highlighted and menu buttons appear. To hide the menu, just double-click on the button, it will become highlight
FX Dynamic: Volatilität und Trends mit anpassbarer ATR-Analyse im Blick Übersicht FX Dynamic ist ein leistungsstarkes Tool, das die Berechnungen des Average True Range (ATR) nutzt, um Tradern unübertroffene Einblicke in die tägliche und intraday-Volatilität zu geben. Durch das Festlegen klarer Volatilitätsschwellen — beispielsweise 80%, 100% und 130% — kannst du schnell potenzielle Gewinnchancen erkennen oder Warnungen erhalten, wenn der Markt seine üblichen Spannen überschreitet. FX Dynamic p
Einzigartiger Indikator, der einen professionellen und quantitativen Ansatz für Mean-Reversion-Trading umsetzt. Es nutzt die Tatsache, dass der Preis auf vorhersehbare und messbare Weise umlenkt und zum Mittelwert zurückkehrt, was klare Ein- und Ausstiegsregeln ermöglicht, die nicht-quantitative Handelsstrategien bei weitem übertreffen. [ Installation Guide | Update Guide | Troubleshooting | FAQ | All Products ] Klare Handelssignale Erstaunlich einfach zu handeln Anpassbare Farben und Größen Im
Legend mt5
Vladyslava Shaviernieva
This is an indicator that includes the best basic forex indicators , without redrawing. Based on this data, a sell or buy signal is generated. It does not disappear anywhere after the signal, which gives us the opportunity to see the results on the history. It can be used on any currency pair, crypto, metals, stocks It is best used on an hourly chart, but other periods are also acceptable. The best results for the period H1,H4,daily If customers have any questions, I will answer them and af
BESCHREIBUNG ICSM (Impulse-Correction SCOB Mapper) ist ein Indikator, der die Preisbewegung analysiert und gültige Impulse, Korrekturen und SCOBs (Single Candle Order Block) identifiziert. Es ist ein leistungsstarkes Werkzeug, das mit jeder Art von technischer Analyse verwendet werden kann, da es flexibel, informativ und einfach zu bedienen ist und das Bewusstsein des Händlers für die liquidesten Interessenzonen erheblich verbessert. EINSTELLUNGEN Allgemein | Visuals Farbthema — definiert d
Auto Order Block with break of structure based on ICT and Smart Money Concepts (SMC) Futures Break of Structure ( BoS )             Order block ( OB )            Higher time frame Order block / Point of Interest ( POI )    shown on current chart           Fair value Gap ( FVG ) / Imbalance   -  MTF      ( Multi Time Frame )    HH/LL/HL/LH  -  MTF      ( Multi Time Frame )  Choch  MTF      ( Multi Time Frame )  Volume Imbalance     ,  MTF          vIMB Gap’s Power of 3 Equal High / Low’s  
ICT, SMC, SMART MONEY CONCEPTS, SMART MONEY, Smart Money Concept, Support and Resistance, Trend Analysis, Price Action, Market Structure, Order Blocks, BOS/CHoCH,   Breaker Blocks ,  Momentum Shift,   Supply&Demand Zone/Order Blocks , Strong Imbalance,   HH/LL/HL/LH,    Fair Value Gap, FVG,  Premium  &   Discount   Zones, Fibonacci Retracement, OTE, Buy Side Liquidity, Sell Side Liquidity, BSL/SSL Taken, Equal Highs & Lows, MTF Dashboard, Multiple Time Frame, BigBar, HTF OB, HTF Market Structure
Easy Buy Sell is a market indicator for opening and closing positions. It becomes easy to track market entries with alerts. It indicates trend reversal points when a price reaches extreme values ​​and the most favorable time to enter the market. it is as effective as a Fibonacci to find a level but it uses different tools such as an algorithm based on ATR indicators and Stochastic Oscillator. You can modify these two parameters as you wish to adapt the settings to the desired period. It cannot
ATrend
Zaha Feiz
4.77 (13)
ATREND: How It Works and How to Use It How It Works The " ATREND " indicator for the MT5 platform is designed to provide traders with robust buy and sell signals by utilizing a combination of technical analysis methodologies. This indicator primarily leverages the Average True Range (ATR) for volatility measurement, alongside trend detection algorithms to identify potential market movements. Leave a massage after purchase and receive a special bonus gift. Key Features: ⦁ Dynamic Trend Detect
Advanced Supply Demand MT5
Bernhard Schweigert
4.5 (14)
Derzeit 33% Rabatt! Die beste Lösung für jeden Anfänger oder erfahrenen Händler! Dieser Indikator ist ein einzigartiges, qualitativ hochwertiges und erschwingliches Trading-Tool, da wir eine Reihe von proprietären Funktionen und eine neue Formel integriert haben. Mit diesem Update werden Sie in der Lage sein, doppelte Zeitrahmenzonen anzuzeigen. Sie können nicht nur einen höheren TF (Zeitrahmen) anzeigen, sondern sowohl den Chart-TF als auch den höheren TF: SHOWING NESTED ZONES. Alle Supply Dema
Dieses Dashboard zeigt die   neuesten verfügbaren harmonischen   Muster für die ausgewählten Symbole, so dass Sie Zeit sparen und effizienter sein werden /   MT4-Version . Kostenloser Indikator:   Basic Harmonic Pattern Spalten des Indikators Symbol:   die ausgewählten Symbole werden angezeigt Trend:   bullish oder bearish Pattern :   Art des Musters (Gartley, Schmetterling, Fledermaus, Krabbe, Hai, Cypher oder ABCD) Entry :   Einstiegskurs SL:   Stop-Loss-Kurs TP1:   1. Take-Profit-Kurs TP2
KT Candlestick Patterns MT5
KEENBASE SOFTWARE SOLUTIONS
KT Candlestick Patterns erkennt und markiert in Echtzeit die 24 zuverlässigsten japanischen Kerzenmuster. Bereits im 18. Jahrhundert nutzten japanische Händler diese Muster zur Vorhersage der Kursrichtung. Natürlich ist nicht jedes Kerzenmuster gleich zuverlässig. In Kombination mit anderen technischen Methoden wie Unterstützung und Widerstand liefern sie jedoch ein klares Bild der Marktlage. Dieser Indikator enthält viele Muster, die ausführlich im Buch „Japanese Candlestick Charting Techniqu
FxaccurateLS
Shiv Raj Kumawat
WHY IS OUR FXACCCURATE LS MT5 THE PROFITABLE ? PROTECT YOUR CAPITAL WITH RISK MANAGEMENT Gives entry, stop and target levels from time to time. It finds Trading opportunities by analyzing what the price is doing during established trends. POWERFUL INDICATOR FOR A RELIABLE STRATEGIES We have made these indicators with a lot of years of hard work. It is made at a very advanced level. Established trends provide dozens of trading opportunities, but most trend indicators completely ignore them! The
Auswahl:
Keine Bewertungen
Antwort auf eine Rezension