Gen snr
- Indikatoren
- Gede Egi Narditya
- Version: 1.1
- Aktualisiert: 17 Dezember 2024
- Aktivierungen: 5
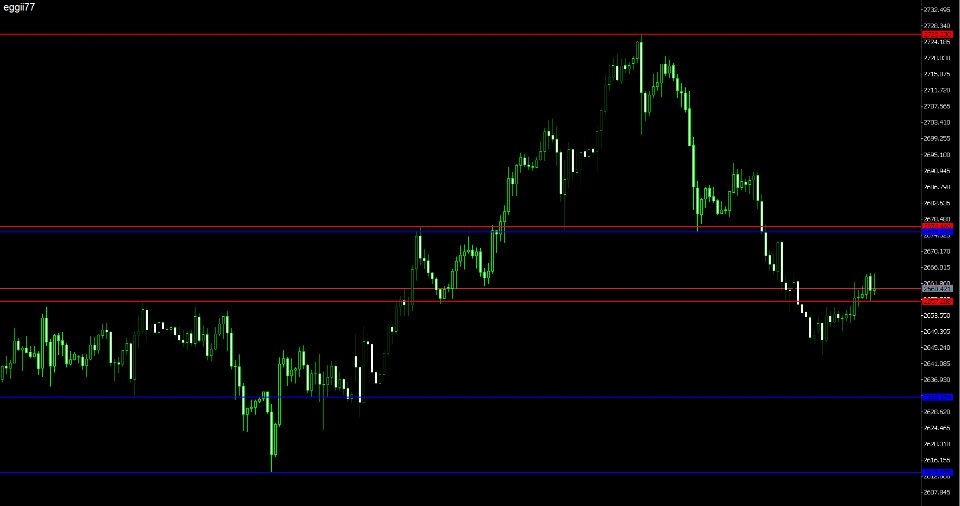
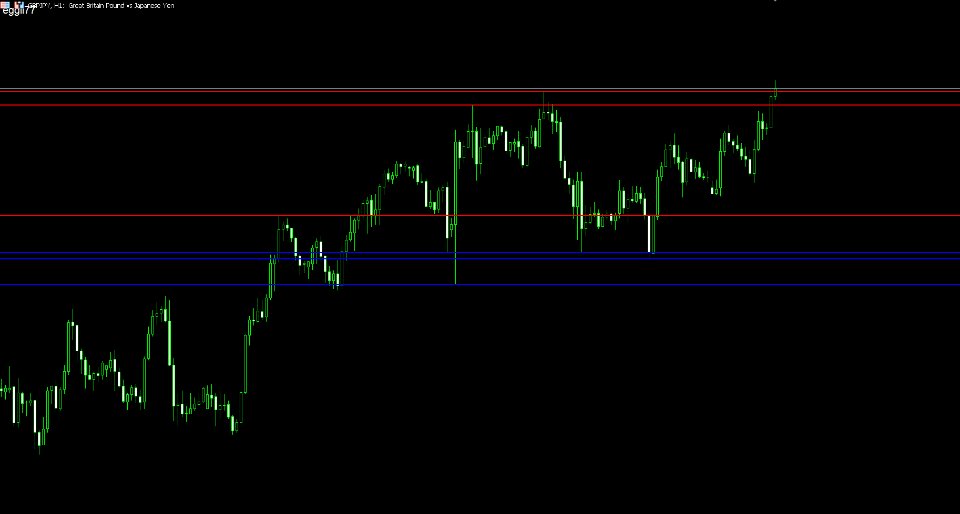
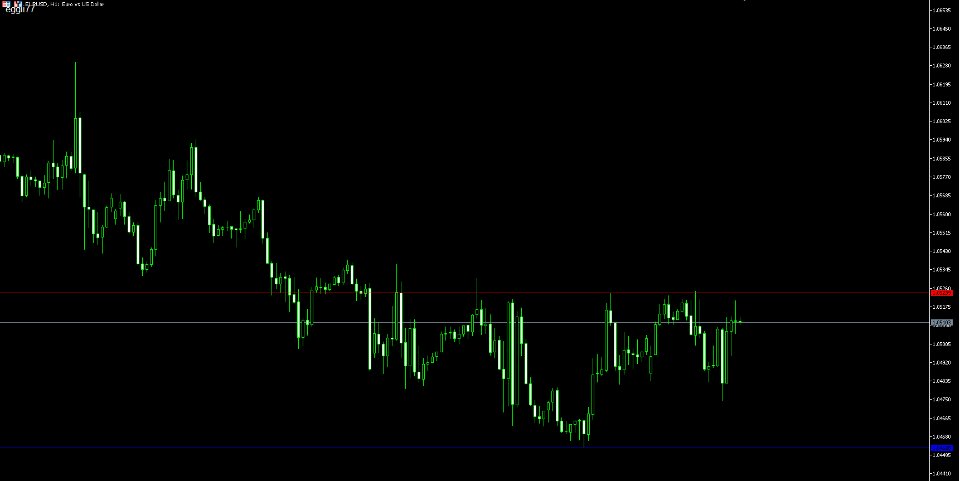
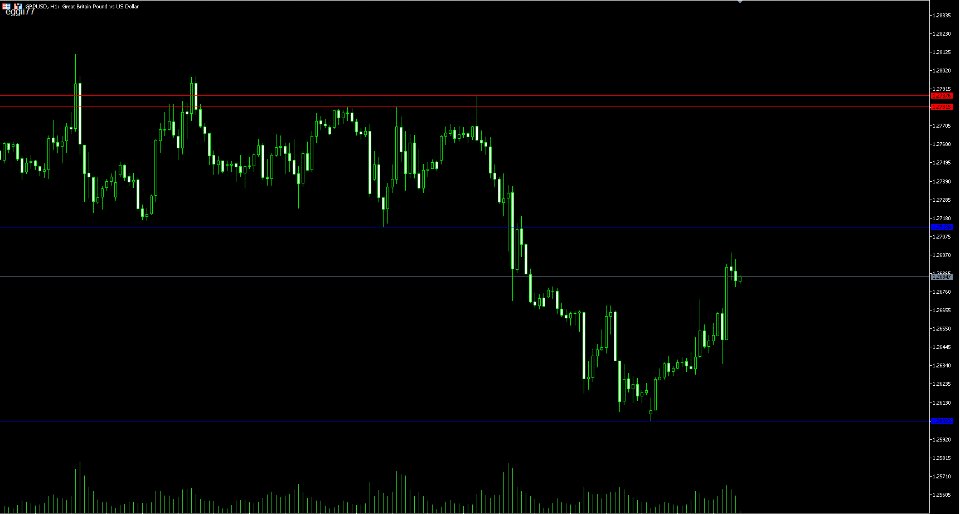
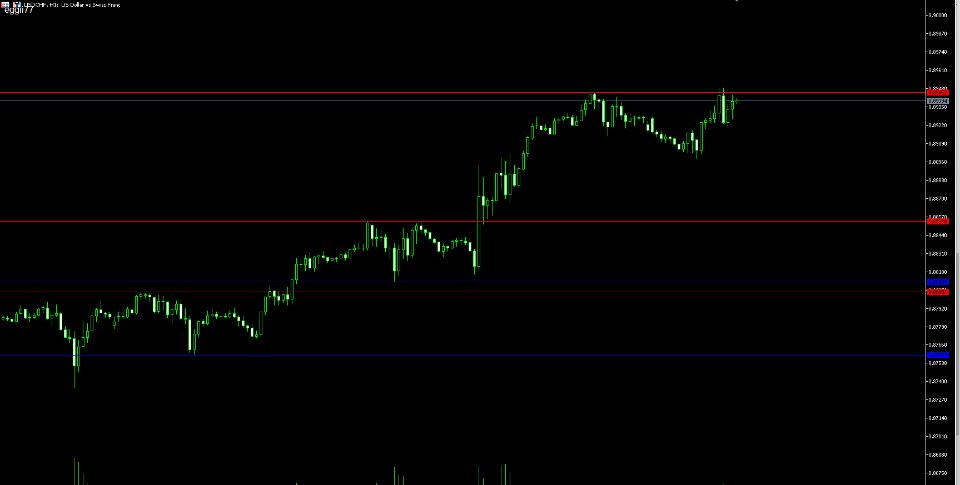
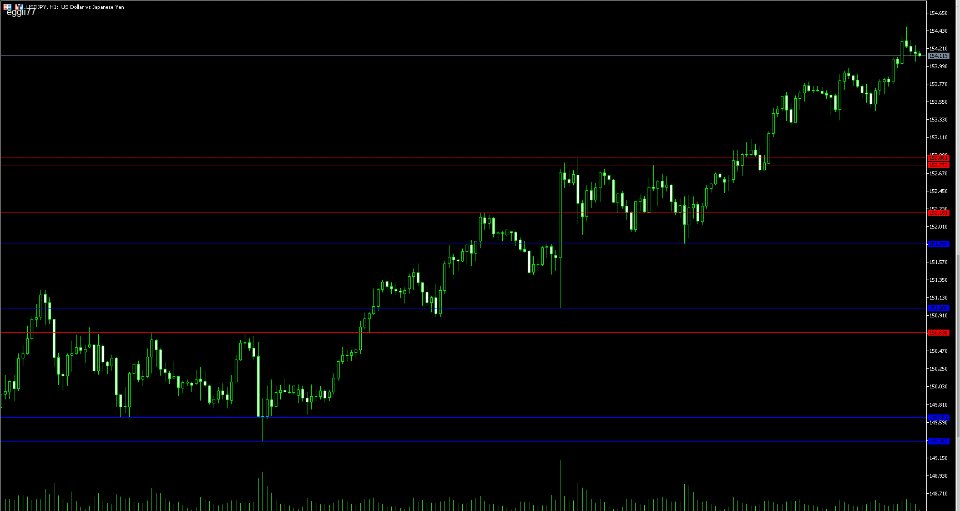
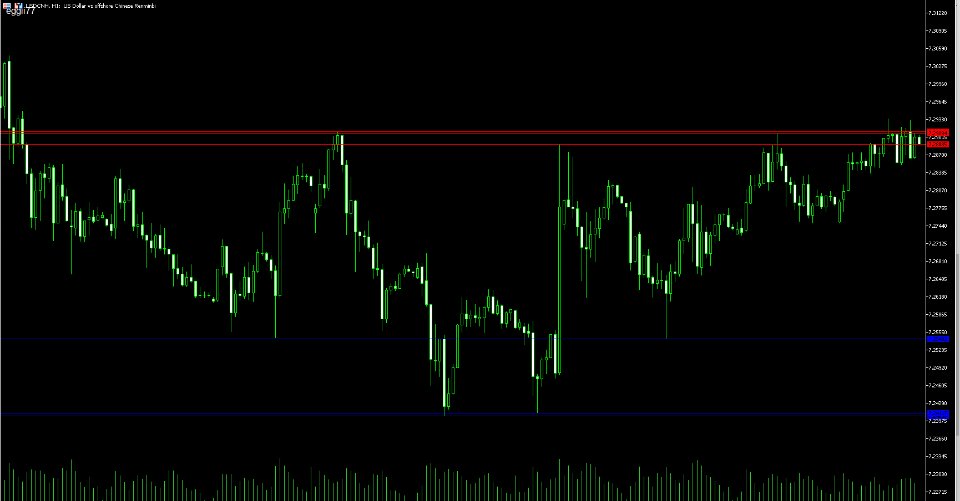
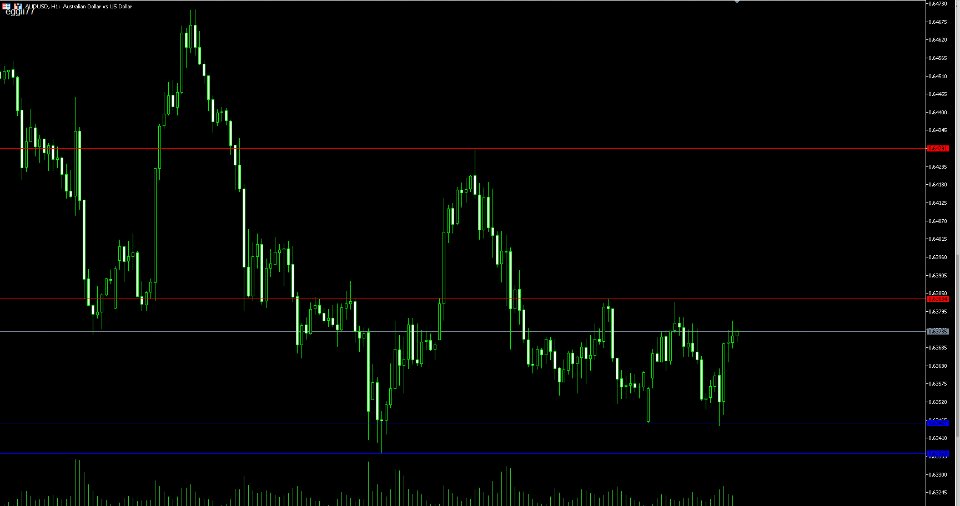
This indicator is designed to detect and display Support and Resistance levels on a chart based on pivot point calculations. The levels are drawn as horizontal lines on the chart, indicating significant price points where price may reverse or consolidate. The indicator is created by identifying pivot highs and pivot lows over a specified number of bars (candlesticks), and drawing lines for each detected level.
Key Features
-
Support and Resistance Levels:
- Resistance lines are drawn based on detected pivot highs.
- Support lines are drawn based on detected pivot lows.
-
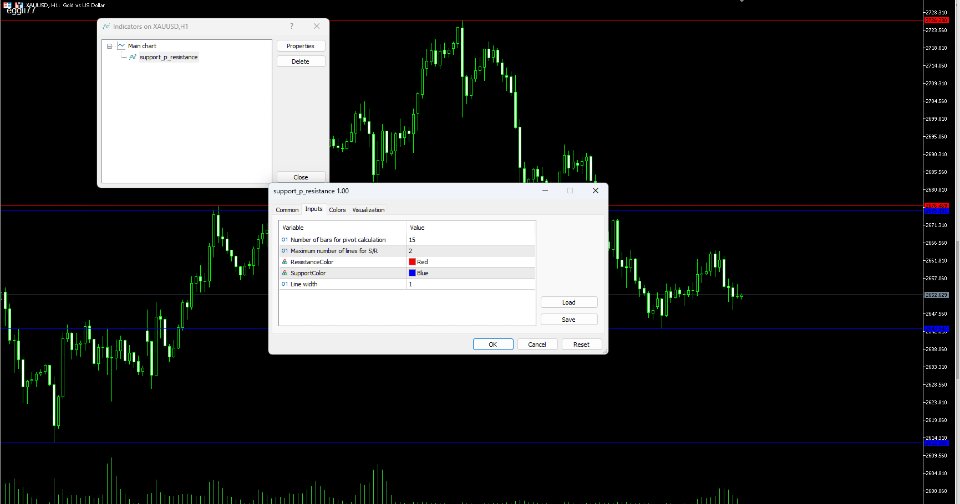
Input Parameters:
- PivotBars: Number of bars considered on either side of a pivot point for detecting significant highs and lows.
- MaxLines: Maximum number of support and resistance lines displayed.
- ResistanceColor and SupportColor: Set the colors for the resistance (red) and support (blue) lines.
- LineWidth: Defines the width of the support/resistance lines.
-
Info Table (Label):
- A label with the text "eggii77" is added to the chart for the indicator's identification.
-
Efficiency:
- The oldest lines are removed when the number of lines exceeds the specified MaxLines value.
- The indicator automatically deletes all objects (lines and table) when removed from the chart.
-
Visualization Support:
- The colors and thickness of the lines can be customized through the input parameters.
