• Übersicht
  • Bewertungen
  • Diskussion

Scalping Fast2

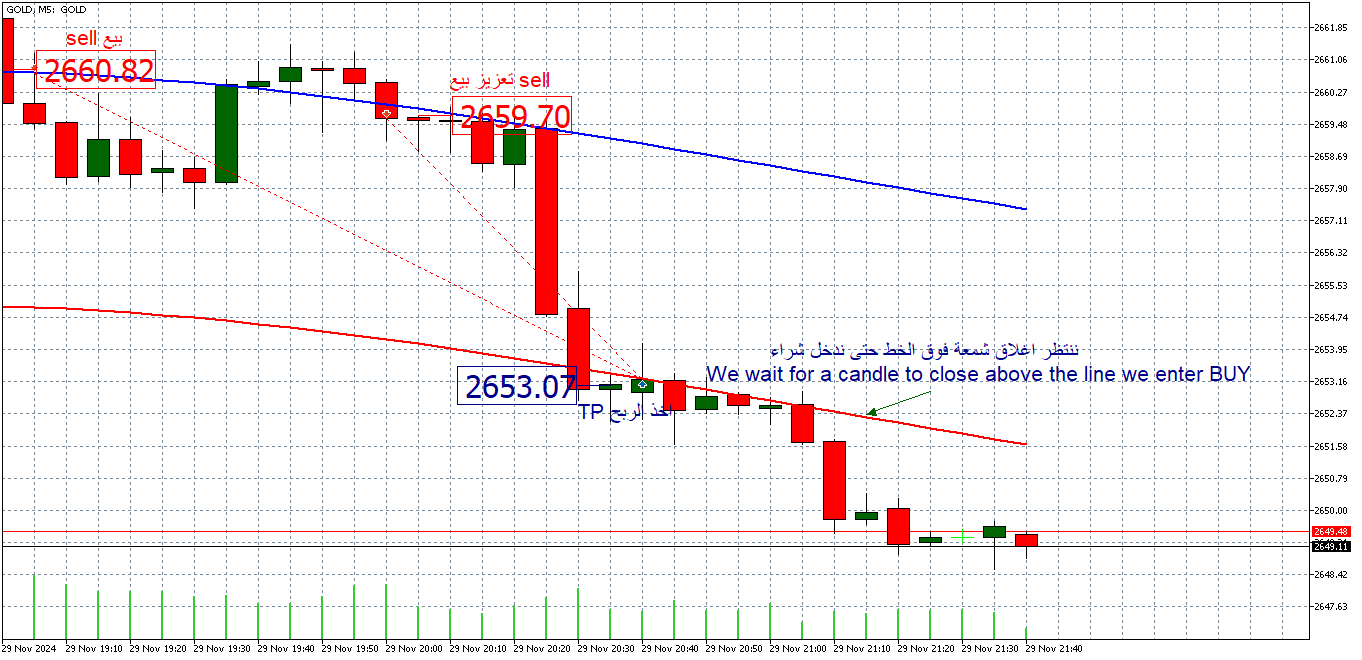
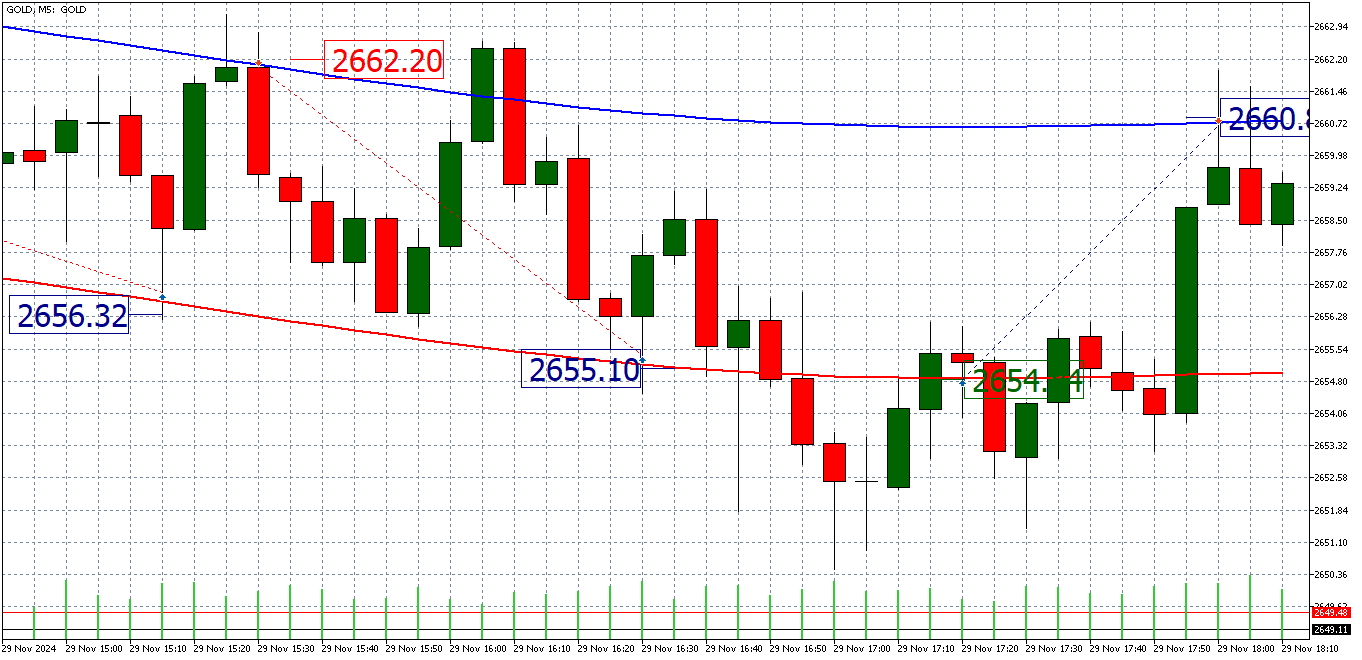
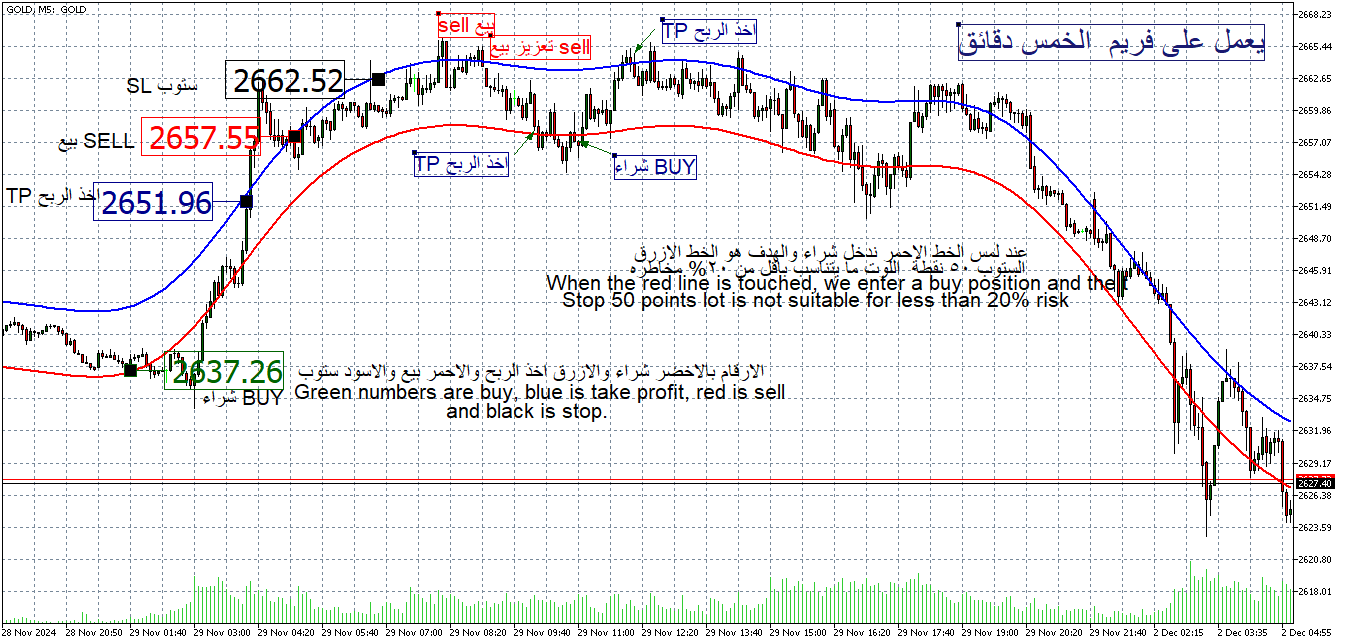
Dieser Koeffizient wird im 5-Minuten-5M-Frame gehandelt
Bitte beachten Sie die Erläuterungen in den beigefügten Bildern

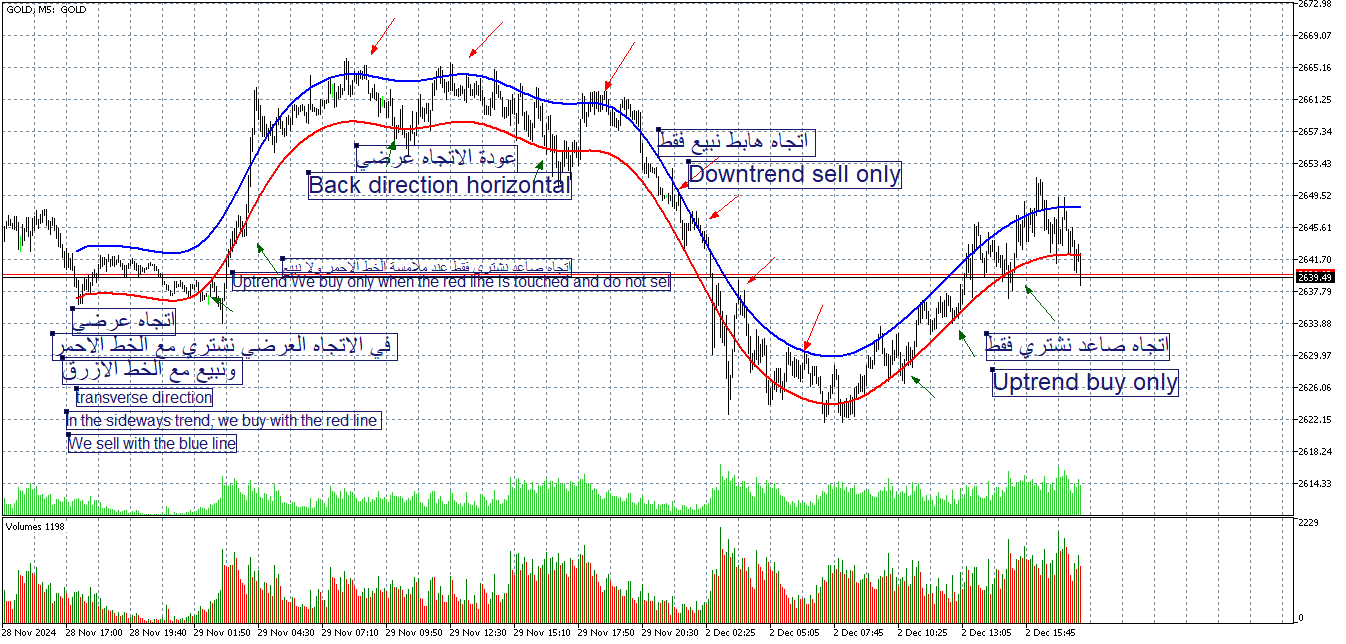
Der Handel erfolgt nach dem Trend. Wenn der Trend steigt, kaufen wir nur, wenn er die rote Linie berührt
Wenn der Trend rückläufig ist, verkaufen wir nur, wenn er die blaue Linie berührt
Im Falle eines Seitwärtstrends können wir verkaufen, wenn er die blaue Linie berührt, und kaufen, wenn er die rote Linie berührt


Wenn der Preis die rote Kauflinie oder die Verkaufslinie von oben erreicht, schließen wir einen Deal ab und stoppen den Verlust bei 50 Punkten

Sie können 20 Punkte oder nur 2 $ auf dem niedrigsten Lot erreichen, oder wenn Sie die andere Linie anrufen, oder etwas davor, etwa 10 Punkte oder 1 $ auf dem niedrigsten Lot, abhängig von der Spanne des Unternehmens, das das Angebot anbietet Du.

Sie können den TP manuell um 5 bis 10 Verkaufspunkte leicht über der Linie platzieren, falls er 1 USD auf der niedrigsten Zahl entspricht, und dasselbe im Falle eines Kaufs.

Wird das Ziel erreicht, endet der Deal

Warten Sie erneut, bis der Preis wieder die gleiche Linie erreicht, wobei eine Kerze je nach Kauf oder Verkauf unter oder über der Linie schließt. Sie darf nicht bei einer Größe schließen, die größer als die Hälfte des Abstands zwischen den beiden Linien ist, da ein Eintritt in diese Linie nicht möglich ist da der Gewinn in diesem Fall gering sein wird bzw. kein Verkauf erfolgt.

Sie sollten Ihr Kapital gut verwalten und nicht immer mehr als 10 bis 20 % riskieren.
Empfohlene Produkte
Gecko EA MT5
Profalgo Limited
5 (1)
NEW PROMO: Only a few copies copies available at 349$ Next price: 449$ Make sure to check out our " Ultimate EA combo package " in our   promo blog ! Gecko runs a simple, yet very effective, proven strategy.  It looks for important recent support and resistance levels and will trade the breakouts.  This is a "real" trading system, which means it will use a SL to protect the account.  It also means it will not use any dangerous techniques like martingale, grid or averaging down. The EA shows its
Advance Entry Levels
Kundan Kumar Srivastava
Introducing Your Ultimate Trading Edge: Dynamic Support & Resistance, Advance Entry Levels Indicator for MT5 platform Unlock the power of precision trading with our cutting-edge Dynamic Support & Resistance Indicator. Designed to give traders unparalleled clarity, this indicator is your roadmap to identifying exactly where to buy and sell, maximizing your potential for consistent, sustainable profits. Why Choose Our Indicator? Crystal Clear Entry and Exit Points : No more guesswork. Our indicat
My Pivot
Ashok Kumar Singha
My Pivot is an Indicator based on Pivot Lines and Support-Resistance zones. This Indicator will Plot 11 SR zones including Pivot Line which will definitely help you to understand the exact SR zones of the Market. Steps to Setup the Indicator: Install the Custom Indicator; Set all the Lines Color, Width and Styles; Set visualization to All Timeframe; and DONE It can be used for: All Pairs: Forex, Cryptocurrencies, Metals, Stocks, Indices.  All Timeframe All Brokers All type of Trading S
Super Zone indicator
Dmitriy Sotnikov
5 (1)
Super Zone   For several years of observing the principles of the market, Super Zone worked, both then and now, because the indicator  allows you to see the trading range of the  week and even the month that major market participants use. It’s very easy to use, we work on H4 in the weekly range (  in the tester it doesn’t work in the demo mode  ) - we sell from the upper zones, we buy from the lower ones. It marks the zones from the beginning of the week (month) that are  not redrawn  , works on
The "Trend Tandem" indicator is a trend analysis tool in financial markets that helps traders determine the direction of price movement. Options: RISK: Determines the level of risk taken into account in the trend analysis. The higher the value, the more aggressively volatility is taken into account. SSP (SSP Period): Defines the period of the moving average used to identify a trend. The higher the value, the smoother the trend signal will be. CountBars: Determines the number of bars on which
STRICTLY FOR BOOM INDEX ONLY!!!!! Here I bring the Maximum Trend Arrows OT1.0 MT5 indicator. This indicator is made up of a combination of different trend indicators for entries and exits, for entries an orange arrow will paint on the chart below the current market and a red flag for closing of trades and it produces buy arrows only. When the orange arrow appears, it will appear along with it's sound to notify you. The 1H timeframe is recommended, don't use it anywhere else than on the 1H timefr
Mine Farm
Maryna Kauzova
Mine Farm is one of the most classic and time-tested scalping strategies based on the breakdown of strong price levels. Mine Farm is the author's modification of the system for determining entry and exit points into the market... Mine Farm - is the combination of great potential with reliability and safety. Why Mine Farm?! - each order has a short dynamic Stop Loss - the advisor does not use any risky methods (averaging, martingale, grid, locking, etc.) - the advisor tries to get the most
Manyal trading system, CovEchoTrend Robot, focuses on reliability and flexibility. By employing statistical analysis methods to study the relationships between the base indicator and market patterns, the system enables a deeper understanding of market processes. Intelligent pattern analysis: The application of statistical data processing helps identify key trend reversal points more accurately, signaling significant market shifts. Informed decision-making is based on the intersection of indicato
The combined Levels Ib DTZ indicator helps to determine the trend direction when trading. Displaying signals on the chart about a possible upcoming trend change. The indicator is a combination of Fibonacci levels with overbought and oversold zones and a trend indicator based on ZigZag and ATR indicators. The Levels Ib DTZ indicator helps traders predict future price movements and adjust their strategy accordingly. It works on all timeframes.
Piranha version 2
Maria Strudov
5 (1)
"Piranha" - an autonomous trading system that determines overbought and oversold levels on the chart. Red and blue zones represent overbought and oversold levels respectively. Entry points are marked with arrows: a downward arrow in the red zone for "sell" and an upward arrow in the blue zone for "buy". The Take profit level is indicated by the green moving average. Key features: Adjusting the Take profit level as the green moving average changes position. Averaging ability when a new market e
KT Horizontal Lines MT5
KEENBASE SOFTWARE SOLUTIONS
In MetaTrader kann das Zeichnen mehrerer   horizontaler Linien   und das anschließende Verfolgen ihrer jeweiligen Kursniveaus mühsam sein. Dieser Indikator zeichnet automatisch mehrere horizontale Linien in gleichen Abständen, um Preisalarme zu setzen, Unterstützungs- und Widerstandszonen zu markieren oder andere manuelle Zwecke zu erfüllen. Dieser Indikator eignet sich besonders für Einsteiger im Forex-Handel, die nach schnellen Gewinnmöglichkeiten durch Kauf und Verkauf suchen. Horizontale Lin
Einzigartiger Indikator, der einen professionellen und quantitativen Ansatz für Mean-Reversion-Trading umsetzt. Es nutzt die Tatsache, dass der Preis auf vorhersehbare und messbare Weise umlenkt und zum Mittelwert zurückkehrt, was klare Ein- und Ausstiegsregeln ermöglicht, die nicht-quantitative Handelsstrategien bei weitem übertreffen. [ Installation Guide | Update Guide | Troubleshooting | FAQ | All Products ] Klare Handelssignale Erstaunlich einfach zu handeln Anpassbare Farben und Größen Im
Beauty Trend
Nikolay Kositsin
Простой индикатор тренда в NRTR виде с отрисовкой линий стоплосса и тейпрофита, цвет и направление движения которых определяются действующим трендом. Индикатор имеет возможность подавать алерты, отправлять почтовые сообщения и push-сигналы при смене направления тренда. Следует учесть что значение входного параметра индикатора Deviation of the take profit line in points для каждого финансового актива на каждом таймфрейме   необходимо подбирать индивидуально!
Arrows Venus
Ignacio Agustin Mene Franco
Arrow Venus! is an oscillator that uses the strategy of crosses capturing the entry whether for sale or purchase where it can be seen in the photo, when the line crosses the blue line with the red one, marking the red arrow it's sale, when the blue line crosses the red one upwards and marks the blue arrow, it is a buy signal very good for scalping and long! used at any time for forex markets and synthetic indices
RevCan Trend Entry MT5
A K M Syedur Rahman
5 (1)
[75% OFF - SALE ENDS SOON] - RevCan Trend Entry Point   is a trend based trade alert indicator for serious traders. It does all the price and chart analysis all by itself, and whenever it finds any potential high quality trading opportunity(Buy or Sell) using its revolutionized price prediction algorithms, it sends instant trade alert directly on the chart, MT4 terminal and on the mobile device.  The trade signals will be visible on the chart as Up and Down arrows, while the instant audible ale
Ein Kopf-Schulter-Muster ist eine Diagrammformation, die einer Grundlinie mit drei Spitzen ähnelt, wobei die beiden äußeren in der Höhe nahe beieinander liegen und die mittlere am höchsten ist. Es prognostiziert eine zinsbullische Trendumkehr und gilt als eines der zuverlässigsten Trendumkehrmuster. Es ist eines von mehreren Topmustern, die mit unterschiedlicher Genauigkeit signalisieren, dass ein Trend sich seinem Ende nähert. [ Installationsanleitung | Update-Anleitung | Fehlerbehebung | FAQ
Urgently mt5
Tatiana Savkevych
The Urgently indicator is designed to quickly determine the situation in the market, reflect the state of the market and signal profitable levels for opening trades. Market conditions change quickly enough, requiring constant calibration of trading strategies. Recommended for use in conjunction with any of the oscillators. The Urgently forex market trend indicator shows the trend direction and entry points. It smooths out price fluctuations when generating a signal by averaging the data and the
Nrha
Ratna Purwantari
This indicator uses Fibonacci to determine your trading levels precisely and measurably. It helps you to earn big profits. This indicator can also be used for various currency charts. You can also combine it with other indicators that you like so that the profits you get are also even greater. I hope you give me input so that this indicator can be better. We recommend using for the period M1 to M15. feel free to discuss with me. Thanks. 
Splash MT5
Pavel Verveyko
The indicator identifies the most suitable moment for entering the market in terms of market volatility, when the market has the strength to move (the signal is indicated by an arrow under the candle). For each of the signals, the presence of trends on the current and higher timeframes is determined, so that the signal is in the direction of the majority of positions opened on the market (denoted near the signal by abbreviations of timeframes with a trend present). The signal appears after the c
Pullback Hunter
Anton Polkovnikov
PULLBACK HUNTER What is every trader's cherished dream? To see without delay the places where the reversal will happen. This, of course, is from the category of magic, though... nothing is impossible. But for now I've prepared for you an indicator that marks in real time the end of corrections to the current movement or in short - catches pullbacks.What is the main point? Many people practice rebounds when the price moves in the direction of the open position. And they do them on the formation o
How to use Pair Trading Station Pair Trading Station is recommended for H1 time frame and you can use it for any currency pairs. To generate buy and sell signal, follow few steps below to apply Pair Trading Station to your MetaTrader terminal. When you load Pair Trading Station on your chart, Pair Trading station will assess available historical data in your MetaTrader platforms for each currency pair. On your chart, the amount of historical data available will be displayed for each currency pai
The "Trend Orbital" indicator is a tool for tracking trends in the financial asset market. It is based on the analysis of price data and provides a visual interpretation of the current direction of price movement. Options: InpAmplitude: Amplitude - determines the amount of volatility that the indicator takes into account when determining the trend. Group "Arrow": InpCodeUpArrow: Up Arrow Code - Defines the arrow symbol to display an uptrend. InpCodeDnArrow: Down Arrow Code - Defines the arrow
Naked Forex Kangaroo Tail Pro Indicator Kangaroo Tail Pro Indicator is a pattern recognition indicator for Forex, Stocks, Indices, Futures, Commodities and Cryptos. The Kangaroo Tail is a multi-bar pattern. The Kangaroo Tail pattern is very effective and is very simple to trade. The strategy that comes with the Kangaroo Tail is based on price action. The indicator does what it was designed for: displaying Kangaroo Tail patterns.     Don't expect to follow the up and down arrows and make mone
Magic EA MT5
Kyra Nickaline Watson-gordon
Magic EA is an Expert Advisor based on Scalping, Elliot Waves and with filters such as RSI, Stochastic and 3 other strategies managed and decided with the robot smartly. Large number of inputs and settings are tested and optimized and embedded in the program thus inputs are limited and very simple. Using EA doesn't need any professional information or Forex Trading Knowledge. EA can trade on all symbols and all time frames, using special and unique strategies developed by the author. The EA w
Introducing Your Ultimate Trading Edge:   Dynamic Support & Resistance, Advance Entry Levels Light Indicator for MT5 platform Unlock the power of precision trading with our cutting-edge Dynamic Support & Resistance Indicator. Designed to give traders unparalleled clarity, this indicator is your roadmap to identifying exactly where to buy and sell, maximizing your potential for consistent, sustainable profits. Why Choose Our Indicator? Crystal Clear Entry and Exit Points : No more guesswork. Our
Point Black
Ignacio Agustin Mene Franco
Black Card Pack indicator 5/1 point black It has the strategy of professional bollingers where each arrow gives you a different entry signal. It is used to operate in m1 and in d1 It is used for scalping and intraday, modified for forex markets ! suitable for all pairs modified for synthetic index markets suitable for all pairs! Ideal for volatility and jumps!
Goldgangster XAUUSD h1
Raphael Schwietering
Experience Excellence with Goldgangster Proven Results! Backed by 1 years of outstanding backtesting on GOLD H1 , Goldgangster delivers consistent performance, precision, and profitability like no other. Transform Your Trading with Goldgangster Meet Goldgangster , the cutting-edge automated trading solution designed to elevate your trading journey. Optimized for GoldM15, this revolutionary Expert Advisor (EA) combines state-of-the-art algorithms and advanced risk management to produce consistent
Pare de seguir as "sardinhas" e comece a operar como big player, de forma automática. O robô Imbalance Autotrader é a mais recente tecnologia de trade que monitora os big players (grandes investidores) do mercado financeiro. Com estratégia de rompimento ( breakout ) ou pullback (Fair Value Gap FVG e Order Block) , você consegue configurar o robô para o ativo, conforme condições que você deseja operar. Além disso, o robô pode ter stops configuráveis, dinâmicos ou fixos. Na questão de gerenciamen
Der psychologische Oszillator MT5 Forex Indikator ist eine großartige Modifikation des klassischen Oszillators, der Ihnen beim Handel mit MetaTrader 5 hilft. INFORMATIONEN ZUM INDIKATOR Forex Der psychologische Oszillator MT5 Indikator wird als Farbbalkendiagramm dargestellt und hat alle Eigenschaften von Forex-Oszillatoren. Es gibt auch Zonen, wann und in welchen Zonen sich der Markt befindet. Alles ist einfach und so klar wie möglich gemacht, damit alle Händler es ohne Schwierigkeiten ve
Käufer dieses Produkts erwarben auch
Spot the Trend. Read the Pattern. Time the Entry. 3 Steps in Under 30 Seconds! Trade effortlessly — no analysis required, Your smart assistant is ready to simplify your workflow No more chart overload. Trade with confidence using smart bias detection. Compatible with all currencies, crypto, stocks, metals, indices, and any timeframe. Just click and execute — it’s that simple. Deal for busy traders who want speed and clarity. TPTSyncX is a powerful all-in-one MetaTrader 5 indicator that seamless
CBT Quantum Maverick Hocheffizientes Binäroptionshandelssystem CBT Quantum Maverick ist ein leistungsstarkes Handelssystem für Binäroptionen, das für Händler entwickelt wurde, die Präzision, Einfachheit und diszipliniertes Handeln suchen. Keine Anpassung erforderlich – das System ist von Anfang an optimiert. Mit etwas Übung sind die Signale leicht zu beherrschen. Hauptmerkmale: Präzise Signale: Handelssignale basierend auf der aktuellen Kerze, die auf die nächste Kerze abzielen, ohne häufige N
IVISTscalp5
Vadym Zhukovskyi
5 (6)
Wir stellen Ihnen den iVISTscalp5-Indikator vor, der nicht nur einzigartig, sondern auch effektiv im Handel ist. Dieser Indikator basiert auf Zeitdaten und ist das Ergebnis jahrelanger Erfahrung und eingehender Analyse der Finanzmärkte. Der iVISTscalp5-Indikator ist ein ausgezeichnetes Werkzeug für manuellen Handel. Bequemlichkeit, Einfachheit und Visualisierung - die gesamte Komplexität ist verborgen. Wir haben die Einstellungen und Verwendung des iVISTscalp5-Indikators auf das Maximum vereinfa
The   Time_Price_SQ9_Degree   indicator is based on the 9 Gann square. Using this indicator, you can identify strong time and price zones. The indicator displays the levels as a degree value. The degrees can be set in the settings. After launching, the MENU button appears. If it is highlighted, it can be moved to any point on the graph, and after double-clicking on it, it stops being highlighted and menu buttons appear. To hide the menu, just double-click on the button, it will become highlight
The Naveen Dynamic Square  MT5  is one of the best known  technical analysis tools  inspired  by WD Gann along with the Gann Fan and Gann Box. It is considered a cornerstone of his trading technique that is based on time and price symmetry. The Naveen Dynamic Square MT5   is a powerful tool in finance for determining support and resistance levels based on a stock's extreme price points. It works by extrapolating probable price levels from a central value, typically an all-time or cyclical high o
This indicator is based on the mathematics of the great trader W.D. Ganna. With its help, you can easily find strong levels by analyzing swings to find the optimal entry point. The indicator works on all instruments and all timeframes. The indicator is fully manual and has control buttons. All you need to do is press the NEW button, a segment will appear, which you can place on any movement, swing or even 1 candle that you want to analyze. By placing the segment, press the OK button. A grid (th
This indicator identifies and displays zones, as it were areas of strength, where the price will unfold. The indicator can work on any chart, any instrument, at any timeframe. The indicator has two modes. The indicator is equipped with a control panel with buttons for convenience and split into two modes. Manual mode: To work with manual mode, you need to press the NEW button, a segment will appear. This segment is stretched over the movement and the LVL button is pressed. The level is displayed
TMA Channel is a price channel obtained through a special calculation method based on traditional TMA . The channel has upper, middle, and lower tracks . When the price approaches or exceeds the upper track, it is already in an overbought state, and attention should be paid to the situation of reversal and decline; When the price approaches or falls below the lower track, it is already in an oversold state, and attention should be paid to the situation of reversal and rise . The indicator will
Natürlich, hier ist die Übersetzung in Deutsch: Vorstellung des Astronomie-Indikators für   MT4 / MT5 : Dein ultimativer himmlischer Trading-Begleiter Bist du bereit, deine Trading-Erfahrung auf himmlische Höhen zu heben? Suche nicht weiter als unseren revolutionären Astronomie-Indikator für MT4. Dieses innovative Tool übertrifft herkömmliche Trading-Indikatoren und nutzt komplexe Algorithmen, um dir unvergleichliche astronomische Einblicke und präzise Berechnungen zu bieten. Ein Universum an In
TrendMaestro5
Stefano Frisetti
note: this indicator is for METATRADER4, if you want the version for METATRADER5 this is the link:  https://www.mql5.com/it/market/product/108106 TRENDMAESTRO ver 2.4 TRENDMAESTRO recognizes a new TREND in the bud, he never makes mistakes. The certainty of identifying a new TREND is priceless. DESCRIPTION TRENDMAESTRO identifies a new TREND in the bud, this indicator examines the volatility, volumes and momentum to identify the moment in which there is an explosion of one or more of these data a
Hello I Want to introduce The Forex Buy Sell Arrow Premium MT5 i recently release this premium indicator! its 1000% Non Repaint Indicator, It Work Perfectly Well,, i tested it day by day, Just mind blowing Result,  Including Powerful trend Algorithm! How It Work? well, it work market trend formula, when trend Bullish Or when trend Bearish,  Recommend Timeframe M30, H1 it work all timeframe, and all currency pair, 100% non repaint, How to take signal From Forex Buy Sell Arrow Premium Ind
AriBot
Arman Belassarov
AriMax   – AI-Powered Trading Robot AriMax is a cutting-edge AI-powered trading robot designed to help traders maximize profits while minimizing risk. Utilizing advanced machine learning algorithms and real-time market analysis, AriMax identifies high-probability trade opportunities with precision and speed. Key Features:     AI-Driven Market Analysis   – Analyzes market trends and patterns to make data-driven trading decisions.     Automated Execution   – Places trades seamlessly with optimiz
Reversal ALGO
Muhammad Abdullah Bhatti
Reversal Algo – Technischer Indikator zur Marktumkehranalyse Reversal Algo ist ein fortschrittlicher technischer Indikator, der speziell entwickelt wurde, um potenzielle Wendepunkte in Markttrends zu identifizieren. Durch die detaillierte Analyse historischer Preisdaten erkennt er bedeutende Hochs und Tiefs, die auf eine bevorstehende Trendänderung hinweisen können. Dieser Indikator bietet klare visuelle Signale auf dem Chart, sodass Händler Schlüsselbereiche für mögliche Umkehrungen präzise bes
Big Player Range
Thalles Nascimento De Carvalho
5 (3)
Die Macht von "BigPlayerRange" entdecken: Ihr starker Verbündeter in der technischen Marktanalyse BigPlayerRange ist ein fortschrittliches technisches Analysetool, das dazu entwickelt wurde, institutionelle Interessensbereiche im Markt aufzudecken. Mit diesem leistungsstarken Werkzeug können Sie präzise feststellen, wo große Marktteilnehmer aktiv sind, und Ihre Handelsstrategien entsprechend verbessern. Hauptmerkmale: Kartierung institutioneller Interessensbereiche : BigPlayerRange hebt Z
The   Gann Scalping Gold Indicator   is a robust technical analysis tool designed for precision trading in gold markets. It leverages Gann-based methodologies to identify key price levels, enabling traders to anticipate potential market reversals, breakouts, and areas of consolidation. Daily Reset Logic: Automatically resets touch statuses at the start of a new trading day, ensuring that the indicator aligns with fresh daily trends. How It Works: The indicator draws horizontal lines at predefine
VTrende Pro
Andrii Diachenko
5 (1)
VTrende Pro - MTF indicator for trend trading with a display panel for MT5 *** Videos can be translated into any language using subtitles (video language - Russian) Although the signals of the VTrende Pro indicator can be used as signals of a full-fledged trading system, it is recommended to use them in conjunction with the Bill Williams TS. VTrende Pro is an extended version of the VTrende indicator. Difference between Pro version and VTrende: - Time zones - Signal V - signal 1-2 waves -    S
WanaScalper
Isaac Wanasolo
1 (1)
A scalping indicator based on mathematical patterns, which on average gives signals with relatively small SL, and also occasionally helps to catch big moves in the markets (more information in the video) This indicator has three main types of notifications: The first type warns of a possible/upcoming signal on the next bar The second type indicates the presence of a ready signal to enter the market/open a position The third type is for SL and TP levels - you will be notified every time price re
XCalper TFO
Aecio de Feo Flora Neto
This oscillator was developed exclusively by xCalper in 2015 based on moving averages calculations to indicate and try predicting oversold and overbought levels. The fast line (white, by default) oscillates basically between values -0.5 (oversold) and +0.5 (overbought). Whenever this line crosses upward value -0.5, it means an oversold price level. When it crosses downward value +0.5, it means an overbought price level. When fast line crosses value 0.0 and returns, it is a strong pull-back indic
Smooth price for Monarch
Konstantin Gruzdev
5 (1)
The Smooth Price technical indicator is used for plotting a smoothed line as close to the price of the financial instrument as possible, and serves to eliminate its noise components. The indicator is part of the Monarch trading system, but here it is presented as an independent technical analysis tool. The indicator is based on the cluster digital filter , which, unlike the ClusterSMA , is applied directly to the price time series. Smooth Price does not redraw (except the very last, zero bar) an
The Expert Advisor and the video are attached in the Discussion tab . The robot applies only one order and strictly follows the signals to evaluate the indicator efficiency. Pan PrizMA CD Phase is an option based on the Pan PrizMA indicator. Details (in Russian). Averaging by a quadric-quartic polynomial increases the smoothness of lines, adds momentum and rhythm. Extrapolation by the sinusoid function near a constant allows adjusting the delay or lead of signals. The value of the phase - wave s
Классификатор силы тренда. Показания на истории не меняет. Изменяется классификация только незакрытого бара. По идее подобен полной системе ASCTrend, сигнальный модуль которой, точнее его аппроксимация в несколько "урезанном" виде, есть в свободном доступе, а также в терминале как сигнальный индикатор SilverTrend . Точной копией системы ASCTrend не является. Работает на всех инструментах и всех временных диапазонах. Индикатор использует несколько некоррелируемых между собой алгоритмов для класси
Currency Index Watcher is a simple and user-friendly tool for whoever wish to trade Forex using currencies indexes. Currency Index Watcher is configurable and usable directly from the panel. Indexes of 8 custom currencies EUR, USD, GBP, JPY, CHF, AUD, CAD, NZD (default) Any 3-chars symbol from your market watch could be used (BTC = bitcoin, RUB = ruble, CNH = yuan etc ...) : double click the symbol label  Ability to select which currencies and made-of pairs will be analyzed : check/uncheck wante
Forex Relative Performance indicator This indicator calculates the relative strength of major currencies against the US dollar. The basic idea behind this indicator is "to buy strong currency and to sell weak currency". This indicator allows you to quickly identify the best forex pair to trade according to your trading style (Intraday, Scalping, Swing, or Long Term)
Premium-Level ist ein einzigartiger Indikator mit mehr als 80% Genauigkeit der richtigen Vorhersagen! Dieser Indikator wurde von den besten Trading-Spezialisten seit mehr als zwei Monaten getestet! Den Indikator des Autors finden Sie nirgendwo anders! Anhand der Screenshots können Sie sich von der Genauigkeit dieses Tools überzeugen! 1 ist ideal für den Handel mit binären Optionen mit einer Ablaufzeit von 1 Kerze. 2 funktioniert bei allen Währungspaaren, Aktien, Rohstoffen, Kryptowährungen
Pendiente de Precio
Cesar Juan Flores Navarro
Indicador en base a la pendiente de la linea de precio, dibuja una línea de color cuando sube a base de los precios que previamente has sido procesados o linealizados, y cuando baja la pendiente la linea linealizada toma otro color. En este caso se a considerado 6 lineas de diferentes procesos desde pendientes largas hacia las cortas, observándose que cuando coincidan las pendientes se produce un máximo o mínimo, lo que a simple vista nos permitirá hacer una COMPRA O VENTA.
Индикатор Coefficient Of Determination (COD) представляет собой значение коэффициента детерминации или квадрат коэффициента корреляции между зависимой переменной — ценой и объясняющей переменной — тиковым объемом. Что это дает нам на практике? COD отлично распознает кульминацию трендовых движений, что позволяет подбирать оптимальные точки и ловить развороты рынка. Как использовать индикатор: Наиболее популярная торговая стратегия строится совместно с трендовым индикатором Moving Average (MA), пе
Fibonacci Multiple 12
Cesar Juan Flores Navarro
Fibonacci Múltiple 12, utiliza la serie fibonacci plasmado en el indicador fibonacci, aumentadolo 12 veces según su secuencia. El indicador fibonacci normalmente muestra una vez, el presente indicador se mostrara 12 veces empezando el numero que le indique siguiendo la secuencia. Se puede utilizar para ver la tendencia en periodos cortos y largos, de minutos a meses, solo aumentado el numero MULTIPLICA.
Recommended TimeFrame >= H1. 100% Non Repainted at any moment.  Use it carefully, only with Trend Direction. Trading Usage: 2 Variants: as Range System or as BreakOut System (Both Only With Trend Direction)::: (Always use StopLoss for minimise Risk); [1] as Range System: (Recommended) in UP TREND:  - BUY in Blue Line , then if price goes down by 50 points (on H1) open Second BUY.   Close in any Profit you wish: TrailingStop(45 points) or Close when Price touches upper Gold Line. in DOWN TREND
En base a cálculos matemáticos de determino una linea Horizontal que cruza a todas las señales de trading, mostrando los máximos y mínimos. La linea horizontal parte en dos las subidas y bajadas de las señales de trading, de tan manera que es fácil identificar los máximos y mínimos, y es inteligente por que es sensible a las subidas y bajadas, afín de no quedarse en un solo lado por siempre, trabaja excelentemente con otros indicadores suavizadores ya que les garantiza que en un intervalo de tie
Spike Detector
Tete Adate Adjete
dieser Indikator ist ein Spike-Detektor-Indikator, es wurde speziell für den Handel mit Boom 1000, Boom 500, Crash 1000 und Crash 500 entwickelt Wir empfehlen, es nur für Derivat Boom- und Crash-Indizes zu verwenden Die Einstellung ist intuitiv, vertraut und einfach zu bedienen es hat Benachrichtigungsfunktionen; akustische Benachrichtigungen und Push-Benachrichtigungen. Dieses Tool ist einfach zu bedienen, einfach zu handhaben Dieses Update basiert auf verschiedenen Strategien für Spikes
Weitere Produkte dieses Autors
DOWN and UP trend
Ywsf Hsyn Hmad Alrsh
It makes it easier for you to trade by providing trend charts in all frames from bottom to top. If it touches the upward trend, it is a good opportunity to sell, and the target is the downward trend, and vice versa. If it touches the downward trend, it is a good opportunity to buy, and the target is the upward trend. It can automatically redraw the trend. You can monitor higher frames and trade on lower frames for speculation .
Go Way TREND
Ywsf Hsyn Hmad Alrsh
Gehen Sie mit dem Trend. Ja, warten Sie in einem 15-Minuten-Frame auf das Einstiegssignal, ob Kauf oder Verkauf, und überprüfen Sie das Signal, wenn es in einem 30-Minuten-Frame erscheint (manchmal dauert es eine Stunde oder länger, bis das Signal erscheint. Sie können zurückkehren Gehen Sie zum 15-Minuten-Rahmen und kehren Sie zum 30-Minuten-Rahmen zurück und wiederholen Sie dies, bis das Hauptsignal für Sie erscheint. Wenn das Signal im 30-Minuten-Rahmen erscheint, steigen Sie mit dem Preis e
Auswahl:
Keine Bewertungen
Antwort auf eine Rezension