• Übersicht
  • Bewertungen
  • Diskussion

Hit Rate Top Bottom Signal

Hit Rate Top Bottom Signal

Hit Rate Top Bottom Signal

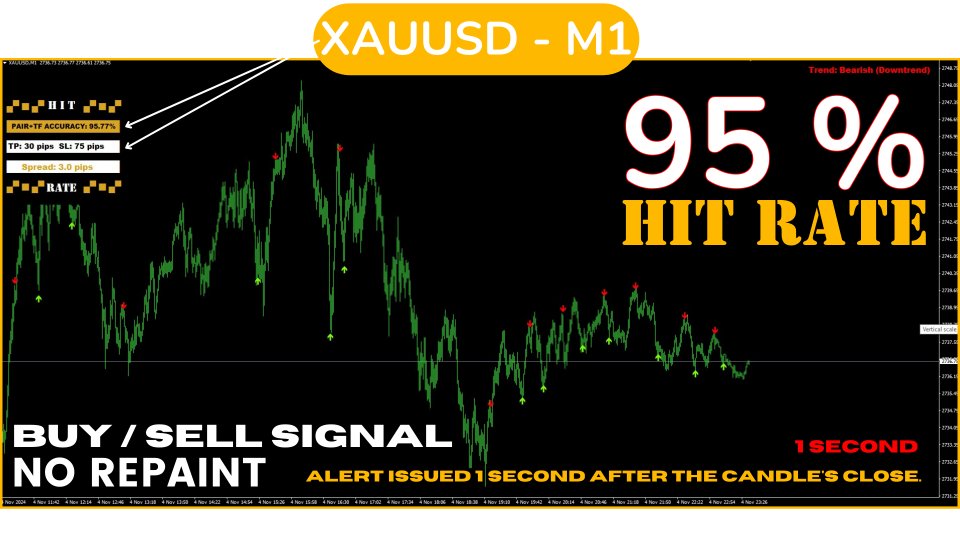
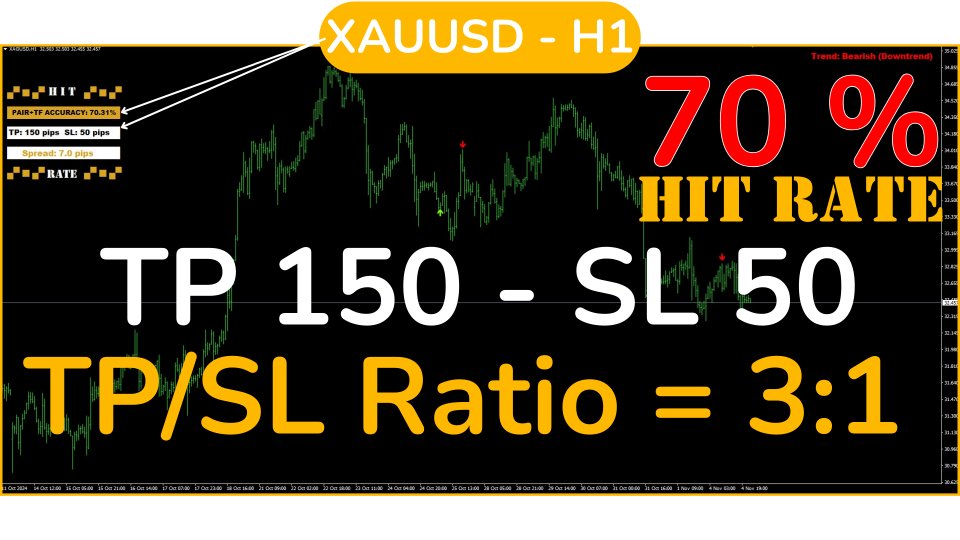
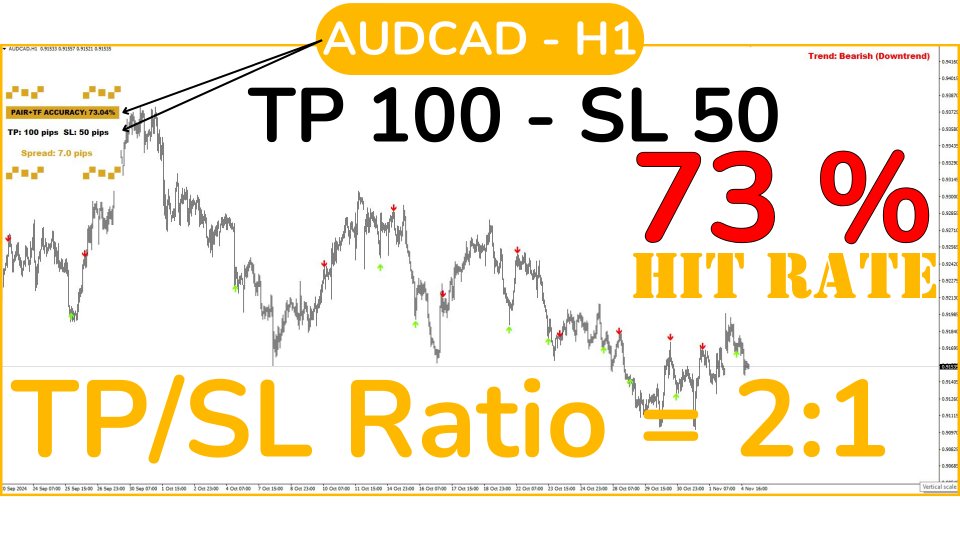
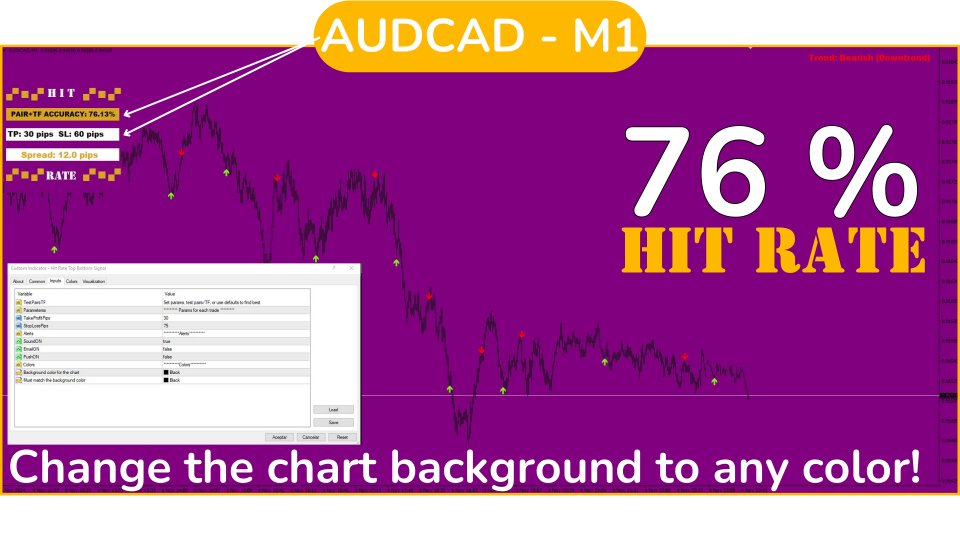
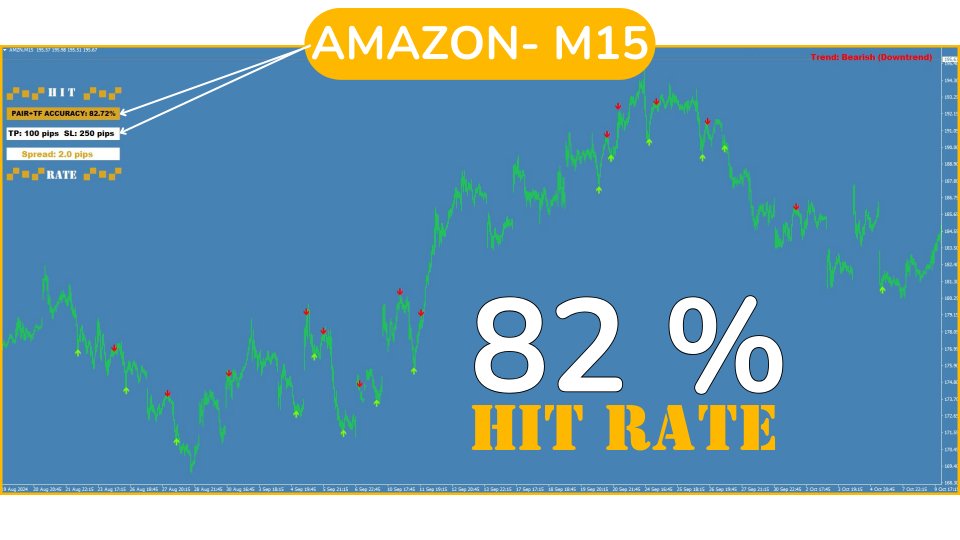
Hit Rate Top Bottom Signal bietet einen völlig innovativen Ansatz. Es ist ideal für diejenigen, die im Voraus bewerten möchten, wie das Signal mit einem bestimmten TP-SL funktioniert und in welchen PAAREN/TFs es am besten abschneidet.

Die Strategie Hit Rate Top Bottom Signal ist ein grundlegendes Werkzeug für jeden Trader und jede Art von Handel, denn sie gibt nicht nur präzise, nicht-neuzeichnende Signale ab, die klar anzeigen, wann und in welche Richtung gehandelt werden soll, sondern führt auch eine detaillierte Aufzeichnung der Trefferquote für jedes Paar und jeden TF mit einem vordefinierten Take Profit (TP) und Stop Loss (SL). Dies ermöglicht es, die Effizienzrate des Signals im Voraus zu kennen, was entscheidend für ein gutes Risikomanagement und präzises Handeln ist.

Diese Strategie zeichnet sich dadurch aus, dass sie sich auf das Erkennen von Umkehrpunkten in Impulsen konzentriert, anstatt auf vollständige Bewegungen. Dies führt dazu, dass die ausgegebenen Signale häufiger sind als bei herkömmlichen Top-Bottom-Signalen, da sie sich auf
Schlüsselmomente in jeder wichtigen Marktschwankung konzentrieren.


Diese Fähigkeit, die historische Effizienz des Signals in Kombination mit einem definierten SL/TP-Verhältnis prozentual anzuzeigen, macht diese Strategie zur besten Option für sicheres Handeln, da sie es dem Trader ermöglicht, datengestützte Entscheidungen zu treffen. Das Vertrauen in ein Signal, das nicht nur klar und direkt ist, sondern auch eine nachweisliche Historie hat, stellt sicher, dass wir eine der besten verfügbaren Strategien nutzen.


Wie handelt man mit diesem System?

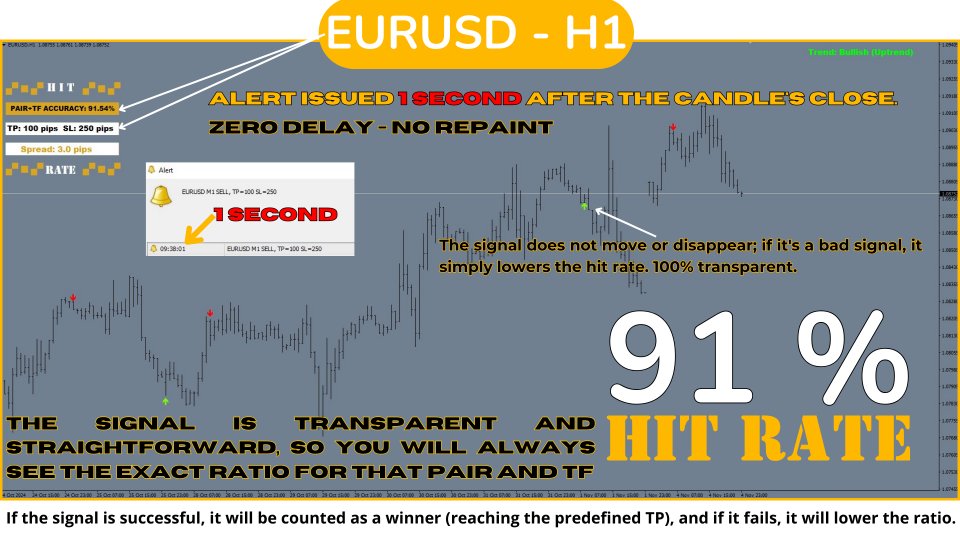
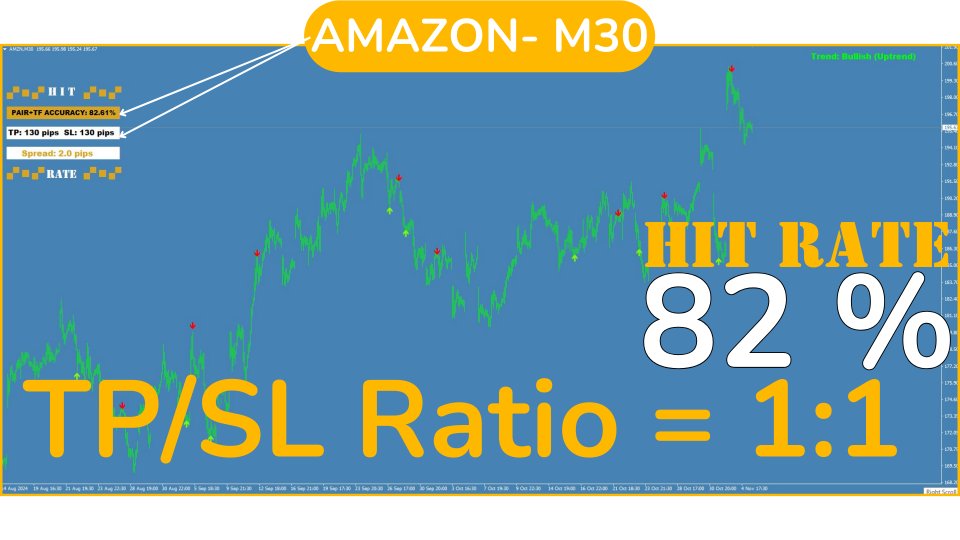
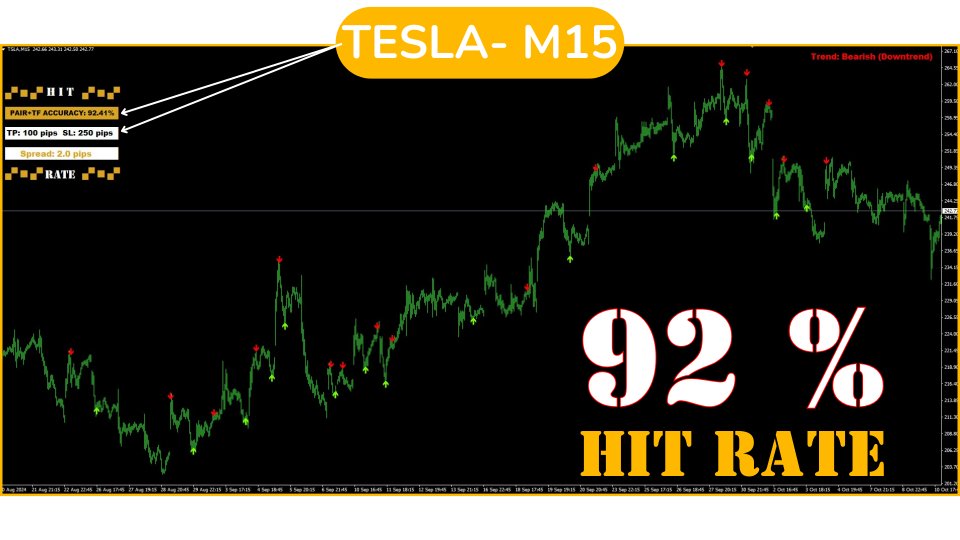
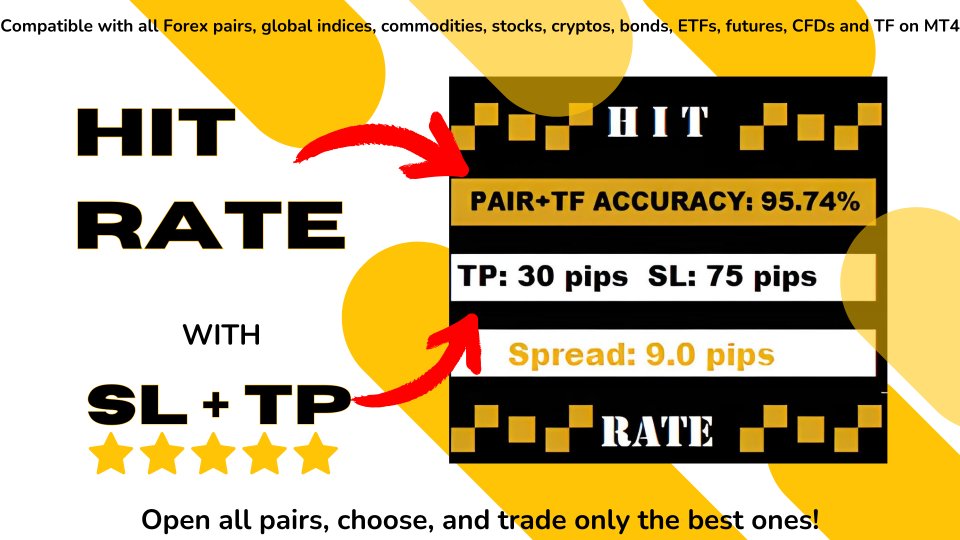
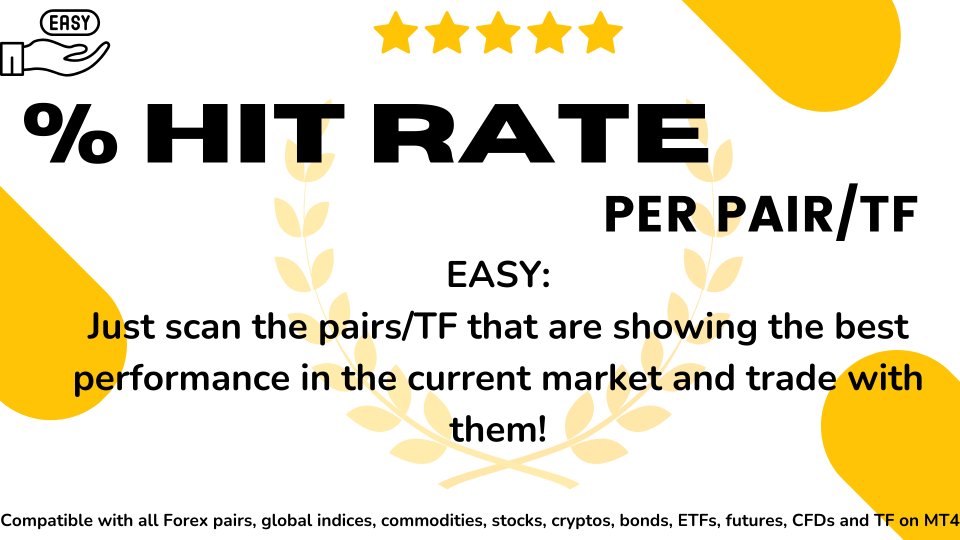
Öffnen Sie mehrere Paare und laden Sie den Indikator auf jedes davon. Analysieren Sie nun jedes Paar, um zu identifizieren, bei welchen Paaren und in welchen TFs (Zeiteinheiten) das Signal am besten funktioniert, und konzentrieren Sie sich auf diese. (BILDER ANSEHEN)

Das Signal hat standardmäßig ein TP von 100 Pips und ein SL von 250 Pips, aber Sie können die Werte einstellen, mit denen Sie handeln möchten, oder die Standardwerte beibehalten.

Beachten Sie, dass ein SL von 250 Pips auf H1 nicht dasselbe ist wie auf M1, aber keine Sorge: Wenn Sie die SL- und TP-Parameter manuell aktualisieren, wird der Trefferprozentsatz des Signals für diese neuen Parameter neu berechnet, sodass Sie die zu erwartenden Ergebnisse mit diesen Parametern im Voraus kennen.

Auf diese Weise können Sie die spezifischen Parameter jedes Paares anpassen, um die Strategie auf dieses Paar und diesen TF zu "optimieren" und die Trefferquote des Signals in diesem Kontext zu erfahren. Es wird empfohlen, diesen Vorgang einmal täglich, immer vor Handelsbeginn, durchzuführen, um die Paare/TFs mit der höchsten Effektivität zum aktuellen Zeitpunkt zu identifizieren. Die Standardparameter funktionieren am besten in TFs wie M30 oder H1, abhängig vom Paar.

Schritt für Schritt:

  1. Wählen Sie ein Paar aus und überprüfen Sie jeden TF. Überprüfen Sie, in welchem das Signal den höchsten Trefferprozentsatz hat, z.B. über 85-90% (wenn Sie die Standard-TP- und SL-Einstellungen verwenden). Wählen Sie diesen TF. Um zu verstehen, welches Verhältnis für Ihre Strategie optimal ist, wenn Sie nicht die Standard-TP- und SL-Einstellungen verwenden, lesen Sie bitte unten "Verhältnis zwischen SL/TP und der Trefferquote".

  2. Wiederholen Sie das Verfahren mit allen verfügbaren Paaren; je mehr Paare geöffnet sind, desto mehr Handelsmöglichkeiten ergeben sich.

  3. Warten Sie nun einfach auf die Signale und eröffnen Sie die Trades, sobald ein Signal ausgegeben wird, unter Einhaltung der vordefinierten SL- und TP-Werte.

  4. Falls Sie die TP- und SL-Werte wählen möchten, mit denen Sie handeln möchten, müssen Sie zunächst die Daten im Tab "Eingaben" ändern und die Werte für jedes Paar in Pips angeben. Dann überprüfen Sie jeden TF dieses Paares, wählen Sie den mit den besten Ergebnissen aus und achten Sie auf die Signale.

Handeln vom Handy aus:

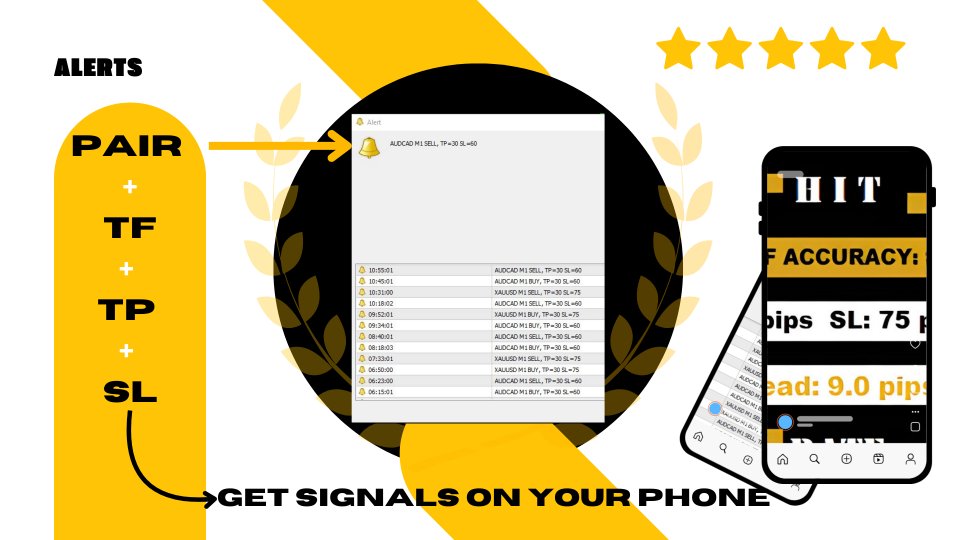
Dieser Prozess "Schritt für Schritt" sollte am Computer konfiguriert werden, aber dann können Sie die Handelsbenachrichtigungen auf Ihrem Handy empfangen. Wie? Stellen Sie sicher, dass Ihr Handy so eingerichtet ist, dass es Push-Nachrichten von Ihrem MT4-Terminal empfängt und Benachrichtigungen vom Terminal auf Ihrem Handy zulässt.

Wenn ein Signal ausgegeben wird, erhalten Sie auf Ihrem Handy: PAAR - TF - SIGNALTYP (KAUF/VERKAUF) - und die für dieses Paar zuvor konfigurierten TP- und SL-Werte.


Auf diese Weise müssen Sie nicht ständig vor dem Computer sitzen, da Sie die Trades direkt von Ihrem Handy aus öffnen können, SL und TP für dieses Paar setzen und sich das ständige Monitoring sparen.

Natürlich wird für diejenigen, die lieber am Computer handeln, das akustische und visuelle Signal mit denselben Daten (PAAR - TF - SIGNALTYP und TP- und SL-Werte) jedes Mal auf dem Bildschirm angezeigt, wenn ein Signal bei einem Paar ausgegeben wird.


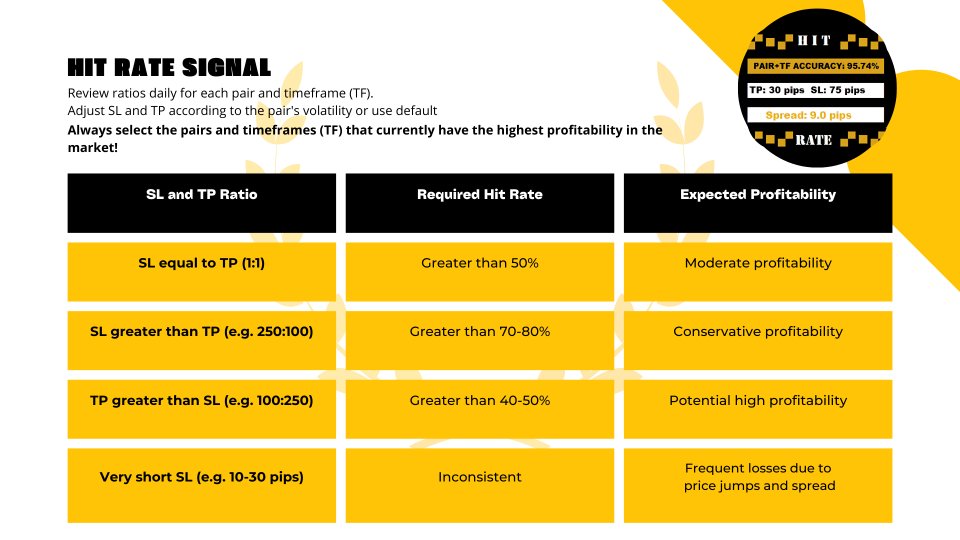
Verständnis des Verhältnisses zwischen SL/TP und der Trefferquote

Der Erfolg einer Handelsstrategie hängt von zwei Schlüsselfaktoren ab: zum einen vom Verhältnis zwischen Stop Loss (SL) und Take Profit (TP) und zum anderen von der Trefferquote des Signals. Jeder dieser Faktoren spielt eine grundlegende Rolle für die Rentabilität der Strategie, und das Verständnis, wie sie zusammenarbeiten, ist entscheidend für die Optimierung des Systems.

1. Verhältnis SL/TP:

  • Verhältnis SL/TP von 1:1: Die TP-Größe entspricht der SL-Größe (z.B. SL: 100 Pips und TP: 100 Pips). In diesem Fall benötigt die Strategie eine Trefferquote von mehr als 50%, um profitabel zu sein, da Gewinne und Verluste ähnlich sind.
  • SL größer als TP: (z.B. SL: 250 Pips und TP: 100 Pips), es wird eine viel höhere Trefferquote benötigt, um die Verluste zu kompensieren, wenn der SL erreicht wird. In diesem Fall ist eine Trefferquote von über 70% oder 80% ideal.
  • TP größer als SL: (z.B. TP: 250 Pips und SL: 100 Pips), die Strategie kann auch mit einer niedrigeren Trefferquote profitabel sein, da jeder Gewinn mehrere Verluste ausgleicht. Hier reicht eine Trefferquote von 40-50%, um Gewinne zu erzielen.

In allen Fällen!! Beachten Sie immer, dass ein sehr "enger" SL, z.B. 10-30 Pips, wahrscheinlich ständig erreicht wird (berücksichtigen Sie den Spread), was zu ständigen Verlusten bei eigentlich gewinnbringenden Trades führt. Seien Sie vorsichtig und lassen Sie dem Preis immer genügend Spielraum (einen großzügigen SL).

2. Trefferquote:

  • Die Trefferquote zeigt an, wie oft das System die Vorhersagen richtig trifft. Ein System mit einer hohen Trefferquote (z.B. 90%) ist zuverlässiger und erlaubt breitere SL/TP-Verhältnisse (SL größer als TP).
  • Eine niedrige Trefferquote bedeutet jedoch nicht unbedingt Verluste, solange der TP viel größer ist als der SL. Mit einem größeren TP werden, auch wenn nur wenige Treffer erzielt werden, die Gewinne die Verluste abdecken.

    DIES IST DER GRUND, WARUM ES WICHTIG IST, DIE TREFFERQUOTE DES SIGNALS IM VORAUS ZU KENNEN, UM MIT EINEM GUTEN KAPITALMANAGEMENT (SL+TP) EIN OPTIMALES ERGEBNIS ZU ERZIELEN.


Optimierung nach Paar und TF:

Jedes Paar und jeder Zeitraum kann unterschiedlich auf dasselbe SL/TP-Verhältnis reagieren, daher ist es wichtig, SL und TP entsprechend der Leistung des Paares und des TFs anzupassen. Zum Beispiel kann es bei volatilen Paaren oder höheren TFs ratsam sein, einen breiteren TP zu verwenden.

Probieren Sie verschiedene SL- und TP-Einstellungen für jedes Paar und TF aus und beobachten Sie die Trefferquote für jede Konfiguration. Dies hilft Ihnen, das optimale Gleichgewicht zu finden, um Gewinne zu maximieren und Verluste zu minimieren.


Beispiel für die Rentabilitätsbewertung:

Stellen Sie sich eine Strategie mit einem SL von 250 Pips und einem TP von 100 Pips vor. Damit diese Konfiguration profitabel ist, sollte die Trefferquote IDEALERWEISE ÜBER 70%-80% liegen, abhängig von der Volatilität und dem Verhalten des spezifischen Paares, damit die Gewinne die Verluste bei Erreichen des SLs ausgleichen.

Wenn das Verhältnis jedoch umgekehrt wird, also SL von 100 Pips und TP von 250 Pips, könnte eine Trefferquote von 40-50% ausreichen, da jeder Gewinntrade mehrere Verluste abdeckt.


Zusammenfassung:

  • SL größer als TP: Es wird eine hohe Trefferquote benötigt (idealerweise über 70%).
  • TP größer als SL: Kann mit einer niedrigeren Trefferquote funktionieren, etwa 40-50%.
  • Tägliche Optimierung: Überprüfen Sie täglich, ob das gewählte Verhältnis bei jedem Paar und TF erhalten bleibt, um die beste Leistung zu erzielen, und wenn Sie feststellen, dass die Leistung eines Paares abnimmt, wiederholen Sie den "Schritt für Schritt"-Prozess und überprüfen Sie die optimale Konfiguration erneut.

Es ist wichtig zu verstehen, dass diese Strategie auf allen Forex-Paaren, Gold, Silber, Aktien, Indizes und sogar auf Krypto (wenn Ihr Broker es zulässt) sowie in jedem TF verwendet werden kann, sodass es nicht erforderlich ist, sich auf Paare festzulegen, die: 1- Zu hohe Spreads haben 2- Nicht das gewünschte Verhältnis aufweisen, wählen Sie aus den besten!

Abschließend, denken Sie daran, dass es keine einzelne ideale Konfiguration gibt. Durch Variieren der Einstellungen werden Sie feststellen, dass verschiedene Konfigurationen je nach Paar und TF gute Ergebnisse liefern können. Deshalb ist es wichtig, ein klares Signal zu haben, das uns mitteilt, wann ein Trade durchgeführt werden soll, mit einem entsprechenden SL und TP (und vorher getestet), und uns eine
 Analyse der Trefferquote gibt, wodurch Hit Rate TopBottom Signal zu einer vollständigen Strategie wird. Wenn Sie die Daten in den Benachrichtigungen einfach lesen und entsprechend handeln, haben Sie die Sicherheit, informierte und getestete Entscheidungen zu treffen.

Trading ohne Stress, einfach und klar. Ohne Rätselraten oder Zweifel!


Empfohlene Produkte
Black series MT4
Dmitriy Kashevich
1 (1)
Black series MT4 - The indicator is designed for trading on binary options with Timeframe M1-M5-M15 Multicurrency (Works on cryptocurrency and currency pairs) The signal appears when the candle opens Up to 90% correct signals There is no signal redrawing at all Can be used with other indicators. Good for scalping! In Settings there is: -Indicator working methods -I Allert Arrow color Red signal down Blue signal up Also watch the video how the indicator works and signals
AWTime Indicator
Komang Putra Riswanjaya
Overview The Time Trading Indicator AWT is designed for traders who often miss or overlook their trading opportunities. This tool helps users stay on top of their trading windows by providing timely alerts. Key Features User-friendly interface: Simple and intuitive design for easy navigation. Easy to use:   Set it up quickly and start receiving notifications instantly. Alert and Push Notifications:   Stay informed with real-time alerts and push notifications. Customizable Objects:   Adjust the
FREE
Alpha Trend Zeichen ist seit langem ein sehr beliebtes Handelstool in unserem Unternehmen. Es kann unser Handelssystem überprüfen und Handelssignale klar anzeigen, und die Signale werden nicht driften. Hauptfunktionen: Anhand der Marktanzeige aktiver Bereiche können Indikatoren intuitiv bestimmen, ob der aktuelle Markttrend zu einem Trendmarkt oder zu einem volatilen Markt gehört. Und betreten Sie den Markt gemäß den Indikatorpfeilen, mit grünen Pfeilen für Kauf und roten Pfeilen für Verk
VR Cub
Vladimir Pastushak
VR Cub ist ein Indikator für den Erhalt hochwertiger Einstiegspunkte. Der Indikator wurde entwickelt, um mathematische Berechnungen zu erleichtern und die Suche nach Einstiegspunkten in eine Position zu vereinfachen. Die Handelsstrategie, für die der Indikator geschrieben wurde, hat sich seit vielen Jahren bewährt. Ihr großer Vorteil liegt in der Einfachheit der Handelsstrategie, die es auch unerfahrenen Händlern ermöglicht, erfolgreich damit zu handeln. VR Cub berechnet Positionseröffnungspunkt
This is the complete REX package. It consists of the lite, pro and ULTRA version.  Perfect for beginners and intermediates. REX complete is 100% non repaint. The strategy is based on a mix of different strategies, statistics, including pivot points, oscillators and patterns.  As the trading idea consists of a variety of some classic indicators like Momentum, Williams Percent Range, CCI, Force Index, WPR, DeMarker, CCI, RSI and Stochastic, it is clear that the fundamental indicators have being
Sneaky Busters 4
Mushfiq Faysal
5 (2)
Unveil Market Secrets with Sneaky Busters on MetaTrader 4! Delve deeper into the intricate world of trading with the Sneaky Busters indicator, specifically crafted to spotlight the sophisticated maneuvers of smart money and uncover hidden market trends. Comprehensive Features: 1. Smart Money Accumulation & Distribution Detection: Accurate Analysis: Identify key zones where smart money collects and disperses assets. These insights help you understand market sentiment and potential turning points.
Chart Patterns Detect 15 patterns (Ascending Triangle, Descending Triangle, Rising Wedge, Falling Wedge, Bullish Flag, Bearish Flag, Bullish Rectangle, Bearish Rectangle Symmetrical triangle, Head and Shoulders, Inverted Head and Shoulders, Triple top, Triple Bottom, Double Top, Double Bottom) Use historical data to calculate the probability of each pattern to succeed (possibility to filter notification according to the chance of success) gives graphic indication about the invalidation level and
Szia! Egy indikátorral. Több idő gyertyájának kirajzoltatása egy charton. Különböző színek rendelhetők a long és short gyertyákhoz. Vonal vastagsága állítható. A gyertya kitöltése engedélyezhető. Hello! With an indicator. Drawing multiple time candles on a chart. Different colors can be ordered for long and short candles. Line thickness can be adjusted. Filling the candle can be allowed. Videó: https://www.youtube.com/watch?v=-9bequnAw-g&amp ;ab_channel=GyulaKlein
SRP Pro
Farhad Kia
5 (1)
Strong Retracement Points Pro edition! SRP (Strong Retracement/Reversal Points) is a powerful and unique support and resistance indicator. It displays the closest important levels which we expect the price retracement/reversal! If all level are broken from one side, it recalculates and draws new support and resistance levels, so the levels might be valid for several days depending on the market! If you are still hesitating to start using this wonderful tool, you can check this link to see how ef
Wir stellen einen bahnbrechenden Strategie-Algorithmus für Superfrequenz-Neuralnetzwerke vor. Verwendung mit Low-Spread-Broker. Wie IC-Market eignet sich raw sehr gut. Erreichen Sie meine E-Mail, um die Set-Datei zu erhalten. Meine E-Mail-Adresse business@darkfxsignals.com. Verwenden Sie jeden Tag 5-10 Minuten während der New Yorker Sitzung für diesen Broker auf us30-Paar, da Sie ohne Provision einen starken Gewinn erzielen werden. Dank mir später . Unser Team hat hart an diesem Projekt gearbeit
Preface: First of all, let me introduce myself. I am a programmer and have been working for over 20 years. 2023 has passed, and our studio has achieved a record of 500 times with 7 manual transmissions. Below, we will show you how to do it through a series of operations. The first step is to model. Modeling is to find a fixed trading pattern. I think everyone has heard of a 2/8 probability, and through this probability, we can further refine it, which means that 1 to 4 is the optimal state. We h
The main idea of this indicator is rates analysis and prediction by Fourier transform. Indicator decomposes exchange rates into main harmonics and calculates their product in future. You may use the indicator as a standalone product, but for better prediction accuracy there is another related indicator - FreqoMaster - which uses FreqoMeterForecast as a backend engine and combines several instances of FreqoMeterForecast for different frequency bands. Parameters: iPeriod - number of bars in the ma
This indicator is another variant of the famous powerful indicator Fibonacci-SS https://www.mql5.com/en/market/product/10136 but has different behaviour in placing Pending Order and TP Line. Automatically places Fibonacci retracement lines from the last highest and lowest visible bars on the chart with: An auto Pending Order (Buy/Sell). Taking Profit 1, Taking Profit 2 is pivot point and Taking Profit 3 for extended reward opportunity. The best risk and reward ratio. Simple and powerful indica
Stratos Pali
Michela Russo
5 (1)
Stratos Pali Indicator   is a revolutionary tool designed to enhance your trading strategy by accurately identifying market trends. This sophisticated indicator uses a unique algorithm to generate a complete histogram, which records when the trend is Long or Short. When a trend reversal occurs, an arrow appears, indicating the new direction of the trend. Important Information Revealed Leave a review and contact me via mql5 message to receive My Top 5 set files for Stratos Pali at no cost! D
The indicator provides a superior alternative to price action analysis. It enables the identification of normalized patterns, which are then transformed into a graphical representation to forecast future steps within a time series. In the top-left corner, you'll find information regarding the expected prediction accuracy, determined through a complex MSQE calculation. You have the flexibility to adjust the time window, making it easy to validate the indicator's performance. Additionally, you can
True SnD
Indra Lukmana
5 (1)
This Supply & Demand indicator uses a unique price action detection to calculate and measures the supply & demand area. The indicator will ensure the area are fresh and have a significant low risk zone. Our Supply Demand indicator delivers functionality previously unavailable on any trading platform. Trading idea You may set pending orders along the supply & demand area. You may enter a trade directly upon price hit the specific area (after a rejection confirmed). Input parameters Signal - S
Simple to read and powerful, no fancy lines and drawings to clutter your chart or distract you. The trend probability oscillator estimates how likely a trend will continue in a certain period. The cummulator period controls how many bars in the past to use and is a proxy for the timescale the trend probability should hold. The use of a Max Line improves this further by indicating when a trend is likely to reverse. In most cases a trend must lose momentum before reversing. Hence, a trend probabil
Gartley Projection D
Oleksandr Medviediev
3.71 (7)
Der Indikator identifiziert die harmonischen Muster (XABCD) gemäß den Entwicklungen von H.M. Gartley („Profits in the Stock Market“, 1935г). Der D-Punkt wird als Punkt in der perspektivischen Projektion projiziert (geben Sie in den Einstellungen ProjectionD_Mode = true an). Wird nicht neu gezeichnet. Wenn ein Balken des Arbeitszeitraums schließt und sich der identifizierte Musterpunkt während der Balken von Patterns_Fractal_Bars nicht bewegt hat, erscheint ein Pfeil auf dem Diagramm (in Ric
Watch the Clock
David Leander Tschacher
Watch the Clock zeigt die Uhrzeit im Chartfenster. Die Uhrzeit ist nützlich, wenn du wissen möchtest, wann die Kerze schliesst. Du kannst auch einen Alarm setzen - zum Beispiel vor wichtigen News. ️ Watch the Clock funktioniert auch im Strategy Tester ️ Watch the Clock arbeitet effizient. ️ Watch the Clock kann deinen manuellen Tradingstyle verbessern. Inputs Alert -> Um welche Uhrzeit soll ein Alarm erscheinen? Time Shift in Minutes -> Soll die Uhrzeit um x Minuten verschoben werden
MACD Divergence
Sergey Deev
2.5 (2)
The indicator detects divergence signals - the divergences between the price peaks and the MACD oscillator values. The signals are displayed as arrows in the additional window and are maintained by the messages in a pop-up window, e-mails and push-notifications. The conditions which formed the signal are displayed by lines on the chart and in the indicator window. Indicator Parameters MacdFast - fast MACD line period MacdSlow - slow MACD line period MacdSignal - MACD signal line period MacdPri
ZhiBiMACD MT4
Qiuyang Zheng
4.5 (2)
Dies ist eine einzigartige MACD-Anzeige, die genauer und einfacher zu bedienen ist als herkömmliche MACD. Es ist für jeden Chartzyklus geeignet und für jede Marktvielfalt geeignet. Die rote Spalte ist das (Buy) Bandsignal und die blaue Spalte das (Sell) Bandsignal. Die gelbe und grüne Linie sind Trendlinien und die beiden Linien kreuzen sich nie. Kaufen: In der blauen Spalte die grüne Linie durch die mittlere 0-Achse betrachten. Verkaufen: In der roten Spalte die gelbe Linie entlang der
The indicator identifies two most important patterns of technical analysis - Pin Bar and Engulfing. MT5-version  https://www.mql5.com/en/market/product/53701 Settings: Mincandle size for PinBar - The minimum size of the Pin-Bar candlestick; Percentage of candle body on size - The percentage of the candle body in relation to its length; PinBar Alert - Alert when a Pin-Bar is detected; PinBar Mail - Sends an email when a Pin Bar is found; PinBar Notification - Sends a push notification when a Pin
PABT Pattern Indicator - it's classical system one of the signal patterns. Indicator logic - the Hi & Lo of the bar is fully within the range of the preceding bar, look to trade them as pullback in trend. In the way if indicator found PABT pattern it's drawing two lines and arrow what showing trend way.  - First line - it's entry point and drawing at: 1. On the high of signal bar or on middle of the signal bar (depending from indicator mode) for buy; 2. On the low of signal bar or on middle of t
RiKen
Gabriel Gomes
RiKen: Revolutionierung der technischen Analyse mit bewiesener Präzision und Zuverlässigkeit Entdecken Sie RiKen, ein innovatives Werkzeug für die technische Analyse, das darauf ausgelegt ist, Ihr Trading-Erlebnis zu transformieren. Dieser Indikator definiert den Finanzmarkt neu, indem er den Standard der technischen Analyse mit seinen einzigartigen Funktionen erhöht: Beeindruckende Genauigkeit von 70% : RiKen sticht hervor, indem es Kauf- und Verkaufssignale mit einer bemerkenswerten Genauigkei
Owl smart levels
Sergey Ermolov
4.34 (35)
MT5-Version  |  FAQ Der   Owl Smart Levels Indikator   ist ein komplettes Handelssystem innerhalb eines Indikators, der so beliebte Marktanalysetools wie die   fortschrittlichen Fraktale von Bill Williams , Valable ZigZag, das die   richtige Wellenstruktur   des Marktes aufbaut, und   Fibonacci-Levels , die die genauen Einstiegslevels markieren, enthält in den Markt und Orte, um Gewinne mitzunehmen. Detaillierte Strategiebeschreibung Anleitung zur Verwendung des Indikators Berater-Assistent im
Spirit mt4
Alena Snigireva
5 (1)
Spirit mt4 is an indicator that works without flashing, the signals are triggered after the arrow at the beginning of the next candle Includes several indicators for overbought and oversold levels. Works with any currency pair: EUR/USD, AUD/USD and others. After the purchase, send me a private message and I will send you the settings that I use for this indicator. Suitable for trading cryptocurrencies. I like to trade cryptocurrency more, so I use it more there. It can also be used
Distinctive
Tatiana Savkevych
Distinctive is a forex trending arrow indicator for identifying potential entry points. I like it, first of all, because it has a simple mechanism of work, adaptation to all time periods and trading tactics. Created on the basis of a regression channel with filters. Plotting the Lawrence indicator signals on a price function chart using a mathematical approach. How it works - when the price breaks out in the overbought / oversold zone (channel levels), a buy or sell signal is generated. Every
Trendiness Index
Libertas LLC
5 (3)
"The trend is your friend" is one of the best known sayings in investing, because capturing large trendy price movements can be extremely profitable. However, trading with the trend is often easier said than done, because many indicators are based on price reversals not trends. These aren't very effective at identifying trendy periods, or predicting whether trends will continue. We developed the Trendiness Index to help address this problem by indicating the strength and direction of price trend
BinaryUniversal
Andrey Spiridonov
BinaryUniversal is a signal indicator for binary options and Forex. In its work, the indicator uses a complex algorithm for generating signals. Before forming a signal, the indicator analyzes volatility, candlestick patterns, important support and resistance levels. The indicator has the ability to adjust the accuracy of the signals, which makes it possible to apply this indicator for both aggressive and conservative trading. The indicator is set in the usual way, it works on any time period and
Laser Trend
Nicolas Zouein
The trend is your friend! This is what this indicator is all about. Follow this famous saying and be safe. Characteristics: Buy/Sell signals fixed on the close of a bar. Works on all symbols and all timeframes. Clear visual market trend laser line, Buy/Sell signal arrows, market strength meter, TP1 & TP2 boxes. Visual signals when to enter, when to exit the market. No repainting. Compatible with Flexible EA for trading automation. (Ask for a free set file optimized to perform 2010-2018) Para
Käufer dieses Produkts erwarben auch
Trins
Ivan Simonika
1 (1)
One of the main definitions for monitoring the currency market is the trend. The Trins indicator is designed to display the trend in a visual form. Trend is a stable direction of price movement. To find it, the indicator uses calculations designed to smooth out sharp fluctuations that do not affect the overall picture of price movement. The trend can be increasing (bullish trend) and decreasing (bearish trend). In most cases, the trend is growing for a long time and drops sharply, but in all
Oni Scalper
Goh Cheng Wai
5 (2)
Dear Onis, This Indicator is used for   GBPUSD, US30 and GOLD on 1-Min Chart . For US30 , Depending on your broker, Minimum Lot Size will differ from 0.01 to 1.0 lots. My Current Account is trading at 1.0 lots at $1 per point . Please check with your Broker what's the Margin Required for your Minimum lot sizes before you trade on your Real account. I have Forward Tested the indicator for around 6 months before releasing it to the public. ( No Demo is available for the Indicator, Strategy
Mafaranga
Phillimon Shumbusho
The real market buy/Sell signals, you can trust.  This indicator tracks the trend strength, the market strength, the real current volume, and the price direction to give traders and investors the optimum point for entry in the form of signals. The time frames range from 5 minutes to one (1) hour chart. Trading on higher time frames produce the best outcomes, but also do produce less frequent trades, compared to trading on lower time frames.
This indicator is based on the Gann Signal indicator and acts as a market scanner. All you need to do is fill in the selected currency pairs in the settings and that’s it. Next, the indicator itself will view all these currency pairs and time frames from M5 to D1 simultaneously. When a new signal appears, the indicator will give you an Alert and also draw the letter N where this new signal will be.
Der TRANSACTION SPEED ist der hochwertigste Indikator, der anzeigt, wo und wann sich große Aufträge auf dem Markt ansammeln und welche Vorteile dies mit sich bringt. Er erkennt Trendänderungen in einem sehr frühen Stadium. Er ist gleichzeitig ein Indikator und ein Handelssystem. Das Konzept ist einzigartig und unglaublich profitabel. Im Devisenhandel wird das Tick-Volumen irreführenderweise als Volumen bezeichnet. In Wirklichkeit handelt es sich um die Preisveränderung pro Zeiteinheit, was de
Precautions for subscribing to indicator This indicator only supports the computer version of MT4 Does not support MT5, mobile phones, tablets The indicator only shows the day's entry arrow The previous history arrow will not be displayed (Live broadcast is for demonstration) The indicator is a trading aid Is not a EA automatic trading No copy trading function The indicator only indicates the entry position No exit (target profit)  The entry stop loss point is set at 30-50 PIPS Or the front
Moving pivot Average Fibonacci The  indicator compares the selected period with its counterpart from the previous period. The indicator determines the moving Fibonacci levels for the day or any time interval to assess the price movement range from the time average. The indicator helps predict the expected high or low for the day based on historical time data. The pivot line can be considered an average trend line and use it in a variety of trading strategies. If you have any question about t
Al in one level
Kundan Kumar Srivastava
5 (1)
This indicator is collection of important dynamic support and resistance giving a trader crystal clear idea , where to sell and where to buy. it completely complements trend lines, support, resistance, and sideways market and allow a trader to make sustainable profits. The thickness of lines suggests its strengths, the thicker the dynamic line, the stronger is rejection or pullback allowing a trader to make multi-fold profit, as they can clearly see them. Introducing Your Ultimate Trading Edge
Automatic, live & interactive picture of all trendlines. Assign push, email and sound alerts to the lines of your choice and be informed about price rollback, breakout, rollback after breakout, number of rollbacks, line expiration by double breakout. Correct, drag or delete the lines and interactively tune the line system. https://youtu.be/EJUo9pYiHFA . Chart examples https: //www.mql5.com/en/users/efficientforex Price Interaction Events All events are effective immediately and only after on
The indicator displays the probable ( Support and resistance ) levels. The indicator draws horizontal and trend levels of support and resistance. The indicator settings: Trends - the mode for displaying trend lines or horizontal lines of support and resistance Yes - display trend lines only No - display horizontal lines only UseResource - use the resources built into the indicator. Yes - use the ZigZag indicator from the resources of the product. No - use a custom ZigZag indicator. HistoryBar -
The indicator of a Professional Trader is an arrow indicator for predicting the direction of price movement. I have been working on this indicator since 2014. You can use this indicator as your main indicator, use its entry signals, and use it as your only indicator to find entry points. About the product: Recommended TF [H4-D1-W1]   . The indicator predicts the direction of the next candle. Fits a variety of tools; Flexibility in settings for different instruments and intervals through the
The [GRAFF] III manual trading system is based on multiple MetaTrader (MT4) indicators. Together, the entire PACK of GRAFF III indicators makes an advanced trading tool. The system consists of over 20 different custom-built indicators which have been carefully selected and tested in the long term to produce strong and efficient trading signals. The particular indicators are based on different mathematical formulas, so the entire system is calibrated to remove false signals from its own indicator
You can fins our other products from link : https://www.mql5.com/en/users/drbastem/seller   Also, you can ask all your questins from email : haskayafx@gmail.com or mobile : +90 530 867 5076 or @MehmetBastem    on telegram application This indicator is used to determine the trend. Standard Osma indicator is used. It has the indicator warning system: beep, e-mail and has three types of alerts, including messages to mobile phone. It shows the best performance on the chart of 5 minutes. When the
You can fins our other products from link : https://www.mql5.com/en/users/drbastem/seller   Also, you can ask all your questins from email : haskayafx@gmail.com or mobile : +90 530 867 5076 or @MehmetBastem    on telegram application This indicator is used to determine the trend. Standard Three Moving Average and ADX indicators are used. It has the indicator warning system (audio, e-mail) and three types of alerts, including messages to mobile phone. It shows the best performance on M5. When
This indicator is used to determine the trend. Standard Three Moving Average and ADX indicators are used. It has the indicator warning system (audio, e-mail) and three types of alerts, including messages to mobile phone. It shows the best performance on M5. When the trend value reaches the value set, the warning system is activated. This indicator works only with Forex symbols. Inputs SoundAlarm = true - Sound Alert Sendmail=true - Send an e-mail in case of a buy or sell signal Sendnotificatio
You can fins our other products from link : https://www.mql5.com/en/users/drbastem/seller   Also, you can ask all your questins from email : haskayafx@gmail.com or mobile : +90 530 867 5076 or @MehmetBastem    on telegram application This indicator is used to determine the trend. Standard MACD indicator is used. It has the indicator warning system: beep, e-mail and has three types of alerts, including messages to mobile phone. It shows the best performance on the chart of 5 minutes. When the
Smooth price for Monarch MT4
Konstantin Gruzdev
3.67 (3)
The Smooth Price technical indicator is used for plotting a smoothed line as close to the price of the financial instrument as possible, and serves to eliminate its noise components. The indicator is part of the Monarch trading system, but here it is presented as an independent technical analysis tool. The indicator is based on the cluster digital filter , which, unlike the ClusterSMA , is applied directly to the price time series. Smooth Price does not redraw (except the very last, zero bar) an
Regression Channel Tools" basiert. Durch die Nutzung dieses Tools können Trader eine außergewöhnliche Kontrolle über ihren Chart-Regression-Kanal erlangen und fundiertere Handelsentscheidungen treffen. Das Regression Channel Tool ist ein leistungsstarkes Instrument im Werkzeugkasten eines Traders. Es soll wertvolle Einblicke in Preisentwicklungen und potenzielle Unterstützungs- und Widerstandsniveaus bieten. Das Tool eignet sich besonders gut zur Visualisierung von Korrekturwellen innerhalb eine
A simplistic indicator informing a user on RSI divergence by sending messages to mobile device and email. The indicator draws 2 vertical lines, marking two RSI extrema that formed the divergence. You get the alert, open the charts and make a decision. The indicator does not show past divergences, thus when you attach it to a chart for the first time you see nothing. Graphics and alerts will appear as soon as divergences do. Drop it in Tester to see how it works. Parameters: RSIPeriod - number of
Green Wall Arrows
Daniel Luchinger
1 (1)
The Name Green Wall : Arrows hits a lot of TP, by changing the idea of non using SL as something bad, but instead use Small TP and a lot of free Margin and Patience. Use micro TP and a lot of Free Margin with this indicator on Forex. It also can be used with Binary Options. This strategy is intended to be traded Manually. This Indicator runs on Open Bar, arrows will delete when price are against it. The only Indicator Parameter is Alerts true/false, all the rest is included inside the code. Arro
Golden Monowave
Ahmed Mohamed Ali
Golden Monowave is monowave indicator, the monowave theory is one of Elliott wave approach and one of most complicate and accurate method. Golden Monowave can shortcut many major steps to identify and describe the monowave. It works on any timeframe and with any trading instrument, including currencies, indices, futures, etc. Input Parameters initial_Bars - set the initial number of bars to calculate. wave_color - select the color of the wave. label_color - select the color of labels. temp_lab
Ticks Size
Viktor Kolmakov
This indicator displays in a separate window the difference between the number of points which increased the price, and the number of points that decreased the price during the time interval specified in the settings. The time interval for calculation is expressed as the number of bars of the chart the indicator is attached to. This approach allows you to evaluate the movement direction (growth or fall) of the instrument's price, the strength of the movement and the size of the movement in point
NostradamusMT4
Andrey Spiridonov
1 (1)
NostradamusMT4 is a powerful indicator from the set of professional trader. The indicator is based on Andrei Spiridonov's original price calculation method (ESTIMATED PRICE) for the current candle price. Advantages The indicator does not redraw. It works on any timeframes. Works with any trading instruments. Perfectly suitable for scalping and trading binary options. Parameters Color - color of the ESTIMATED PRICE FUTURE line. How to work with the indicator The indicator forms the ESTIMATE
BinaryIndicator
Andrey Spiridonov
BinaryIndicator is a highly accurate indicator for trading binary options. It shows excellent results in scalping. This indicator is based in multifactor analysis of trend indicators, as well as confirmation oscillators, which in the end gives an increased accuracy of signals. Advantages of the indicator Increased accuracy of signals. Excellent results when trading binary options with a short expiration time from M30 to M1 . It works on any timeframes. Works with any trade symbols. Parameter
FutureTrade
Andrey Spiridonov
3 (2)
FutureTrade is one of the few indicators that predicts the price right on the price chart. The indicator calculation algorithm is based on the fast Fourier transform. Given the oscillatory behavior of the price, the Fourier function predicts its future behavior. The indicator should be attached in the usual way to a chart with the trading instrument specified symbol and with the M15 timeframe. This timeframe is the most optimal for working with any symbols. Once started, the indicator calculates
BinaryScalping
Andrey Spiridonov
BinaryScalping is a professional indicator for trading binary options and scalping. The algorithm of the indicator is based on the calculation of pivot points for each time period separately, the location of the price of the trading instrument relative to the pivot points is analyzed and the probability of a trading operation is calculated. The indicator has a built-in filter of trading signals based on the global trend. The indicator is installed in the usual way and works with any trading inst
This is the FXTraderariel PowerTrend . It compute a trendfollowing system based on it own algorithm. It gives you a buy or sell signal based on the trend. It based on the Supertrend, but our Version is not repainting. Furthermoore we added some Improvements and you can get an Arrow, Push or Alert when the trend changes. Depending on the settings it and trading style, it can be used for scalping or long-term trading . The indicator can be used on every time frame , but we advise to use it on H1
Sweet Waffle
Christophe Godart
The arrows are calculated with: -     2 Parabolic  parameters -     2 ADX parameters -     4 Stochastic parameters We recommend to combine it with Parabolic, ZigZag or Elliot waves indicator. Always trade the trend! If you make sure to draw your trend lines and support/resistance zones you will just have to wait for the signal to appear. Take the trade. For Binary Options it is advisable to set the expiry time to 5-15 min in M1 chart. THIS INDICATOR IS ZERO REPAINT Best assets to trade: -
Let´s try to make some real money! Call me profit addicted. I thought why not try to make THE dream come reality. With discipline, a clear strategy and this indicator I focus on entering the perfect trades. This indicator is very easy to use as you will get perfect entry points for Put or Call trades. The arrows are calculated with: -     Momentum  parameters -     Candle stick patterns -     Fundamental Price action We recommend to combine it with Parabolic, ZigZag or Elliot waves indic
Weitere Produkte dieses Autors
Aurum Apex Mt4 EA
Martin Alejandro Bamonte
5 (1)
Sie können jetzt die Demo-Version von Aurum Apex im Reiter Kommentare herunterladen, um die Live-Performance bei Ihrem eigenen Broker zu bewerten! Aurum Apex EA ist ein leistungsstarkes zu 100 % automatisiertes Handelstool, das für die MT4-Plattform entwickelt wurde. Es analysiert den Markt in Echtzeit und erkennt verschiedene Handelsmöglichkeiten. Geeignet für Trader aller Erfahrungsstufen bietet Aurum Apex EA drei Risikomodi, die über den Risikoparameter einstellbar sind: Risiko = 0,1 (Niedri
In der Welt des Tradings gibt es verschiedene Stile: Einige Trader bevorzugen es, einen EA über Monate hinweg laufen zu lassen, während andere wöchentlich Gewinne auszahlen möchten. HFT Fast M1 wurde speziell für letztere Gruppe entwickelt: für diejenigen, die schnelle Ergebnisse erzielen und wöchentlich Gewinne realisieren möchten. Einfach gesagt, dieser EA ist eine echte Trading-Maschine . Wenn Sie hingegen nach einem EA mit einem „monatlichen Ansatz“ suchen, empfehlen wir Ihnen, AURUM APEX EA
M1 Easy Scalper
Martin Alejandro Bamonte
M1 EASY SCALPER ist ein speziell für den 1-Minuten-Zeitrahmen (M1) entwickelter Scalping-Indikator, der mit jedem Währungspaar oder Instrument auf Ihrem MT4-Terminal kompatibel ist. Natürlich kann er auch auf anderen Zeitrahmen verwendet werden, aber er funktioniert besonders gut auf M1 (was komplex ist!) für Scalping. Hinweis: Wenn Sie scalpen möchten, stellen Sie sicher, dass Sie ein dafür geeignetes Konto haben. Verwenden Sie keine Cent- oder Standardkonten, da diese zu hohe Spreads haben! (n
Candle Probability Scalper
Martin Alejandro Bamonte
Gebrauchsanleitung für den Candle Probability Scalper Dieser Indikator macht Scalping einfach und 100% intuitiv. Candle Probability Scalper zeigt Ihnen auf einen Blick die prozentuale Stärke von Käufern und Verkäufern in ECHTZEIT und in der aktuellen Kerze an. Die Prozentsätze werden bei jedem Tick aktualisiert, sodass Sie Sekunde für Sekunde wissen, was die Mehrheit der Käufer und Verkäufer tut, ohne jegliche Verzögerung. Dies hilft Ihnen enorm, die Stärke der beiden Seiten zu bestimmen oder z
NextCandlePredictor Indikator NextCandlePredictor, ein Signalindikator mit Alarm, der nicht neu zeichnet, seine Farbe nicht ändert, sich nicht bewegt, nicht verschwindet und keine Verzögerung hat. Er hilft Ihnen, die Richtung der nächsten oder kommenden Kerzen in jedem Zeitrahmen zu identifizieren. Sehr empfehlenswert für hoch volatile Märkte wie New York, London oder sogar die Überlappung beider. Hauptmerkmale: Vielseitigkeit in Zeitrahmen: Bietet schnelle und genaue Signale in jedem Zeitrahmen
Clear Breakout
Martin Alejandro Bamonte
5 (1)
Der "Breakout Buy-Sell" Indikator ist darauf ausgelegt, potenzielle Kauf- und Verkaufsgelegenheiten basierend auf Preisdurchbrüchen während verschiedener Marktsitzungen (Tokio, London und New York) zu identifizieren und hervorzuheben. Dieser Indikator hilft Tradern, Kauf- und Verkaufszonen sowie Take-Profit (TP) und Stop-Loss (SL) Niveaus klar zu visualisieren. Nutzungsstrategie Der Indikator kann wie folgt verwendet werden: Erste Einstellungen : Wählen Sie die Marktsitzung und passen Sie den GM
Pairs and TF Changer
Martin Alejandro Bamonte
Sind Sie es leid, zwischen mehreren Charts zu wechseln, um verschiedene Währungspaare und Zeitrahmen zu überwachen? Der Pairs and TF Changer -Indikator wird Ihr Handelserlebnis revolutionieren! Nachdem Sie alle Indikatoren für Ihre Strategie geladen haben, fügen Sie den Pairs and TF Changer dem Chart hinzu. Bei Bedarf können Sie seine Position, Farben oder die Anzahl der angezeigten Spalten anpassen! Hauptmerkmale: Nahtlose Integration: Integrieren Sie diesen Indikator mühelos in Ihre Handelsstr
Scalping Signal NO Repaint NO Lag
Martin Alejandro Bamonte
5 (1)
"Scalping Signal No Repaint No Lag" ist der einzige Indikator auf dem Markt, der beim Ziehen auf ein beliebiges Diagramm automatisch alle erforderlichen Indikatoren lädt, ohne dass Vorlagen oder andere Indikatoren geladen werden müssen. Er konfiguriert das Diagramm automatisch so, dass es genau wie im bereitgestellten Bild aussieht. Dieser Indikator garantiert Signale ohne Neuzeichnung oder Verzögerung und ist daher ideal für Scalping-Strategien bei allen Währungspaaren und Zeitrahmen (TF). Funk
BullsEye Signal NoRepaint
Martin Alejandro Bamonte
3 (2)
BullseyeSignal – NoRepaint ist ein Signal, das, wie der Name schon sagt, unter keinen Umständen neu gezeichnet wird. Das Signal wird auf der gleichen Kerze ausgegeben, die im Bild zu sehen ist. Es ist ideal für stark volatile Märkte wie Forex, Kryptowährungen, Aktien, Indizes und Futures. Sie werden nur einen grünen Pfeil für den Kauf und einen roten Pfeil für den Verkauf sehen, aber hinter ihnen arbeiten viele Indikatoren zusammen, um ein vereinfachtes Handelserlebnis zu bieten. Es ist speziell
GbpUsd Pip Hunter EA
Martin Alejandro Bamonte
GBPUSD Pip Hunter EA Hauptmerkmale: Optimiert für GBPUSD im M15-Zeitrahmen: Speziell für das GBPUSD-Paar auf einem 15-Minuten-Chart entwickelt und getestet. Empfohlene Mindestkontogröße: Erfordert ein Mindestkontoguthaben von $1000, um niedrige Drawdowns zu gewährleisten. Spread-Kompatibilität: Am besten mit niedrigen Spreads oder ECN-Konten zu verwenden, um die Rentabilität zu maximieren. Risikomanagement: Beinhaltet eine Option zur Deaktivierung der exponentiellen Lot-Funktion, indem sie auf 1
Der MTFMA (Multi-Timeframe Moving Averages) Indikator verwendet mehrere gleitende Durchschnitte (MA) in verschiedenen Zeitrahmen, um Kauf- und Verkaufssignale (die nicht neu zeichnen) in einem separaten Fenster vom Hauptdiagramm bereitzustellen. Er ist vielseitig und einfach zu interpretieren, geeignet sowohl für Scalping in kleineren Zeitrahmen als auch für langfristigen Handel in größeren Zeitrahmen. Warum ist es Multiframe? Der Begriff Multiframe bezieht sich auf die Fähigkeit des Indikators,
Der "MultiSymbol & TF Chart Integrated"-Indikator ist darauf ausgelegt, schnell einen umfassenden Marktüberblick zu bieten, sodass Sie bis zu 60 Währungspaare in Ihren bevorzugten Zeitrahmen auf einem einzigen Chart überwachen können (Mehrfachmodus) oder das Paar, das Sie handeln, in allen TFs anzeigen können (Einfachmodus). Hauptvorteile: Umfassende Überwachung: Ermöglicht die Echtzeitüberwachung aller gewünschten Paare auf einem einzigen Chart auf einen Blick. Zeitersparnis: Vermeidet das Ums
GO Trend MultiTimeFrame
Martin Alejandro Bamonte
GoTrend Multi-Timeframe Indikator Der "GoTrend Multi-Timeframe" Indikator ist ein unverzichtbares Werkzeug für Trader, die eine schnelle und effiziente Möglichkeit suchen, die allgemeinen und spezifischen Trends eines Währungspaares in verschiedenen Zeitrahmen zu bewerten. Dieser Indikator ermöglicht es Tradern, auf einen Blick eine klare und umfassende Ansicht der Marktrichtung zu erhalten, wodurch die Entscheidungsfindung optimiert und die Effektivität ihrer Handelsstrategien erhöht wird. Haup
Gold Vertex EA
Martin Alejandro Bamonte
Gold Vertex EA is a reliable and stable option for those looking to automate their trading in the gold market. With a robust system based on one of the most effective indicators and a solid trend-following strategy, Gold Vertex EA is a powerful tool for traders who want precise, worry-free trading. Requirements Platform : MetaTrader 4 Supported Instruments : Specifically developed and configured for Gold (XAUUSD) Recommended Account Type : ECN or low spread Minimum Deposit Recommended : $100 Tim
Inferno Signals EA
Martin Alejandro Bamonte
Inferno Signals EA wurde entwickelt, um von bedeutenden Marktbewegungen zu profitieren, wobei es auf dem soliden M30-Zeitrahmen operiert. Es ist ideal für diejenigen, die mit einer kleinen Anfangsinvestition beginnen möchten, beginnend mit nur 100 $ pro Paar, mit einer automatischen Kapitalverwaltung, die dynamische Lot-Anpassungen und Sicherheitsniveaus wie den Stop-Loss (SL) umfasst. Mit einem niedrigen Drawdown und einer Strategie, die sich darauf konzentriert, die besten Gelegenheiten zu nut
MarketPrice Indicator
Martin Alejandro Bamonte
Der MarketPrice-Indikator wurde entwickelt, um eine schnelle Visualisierung zu bieten, die es ermöglicht, auf einen Blick die Trendrichtung eines Währungspaares über alle Zeitrahmen (Time Frames) zu erkennen und so die Entscheidungsfindung zu erleichtern und zu beschleunigen. Der MarketPrice-Indikator basiert auf täglichen Niveaus und Handelssignalen, die auf dem Kreuz von gleitenden Durchschnitten und der Marktstärke gemäß verschiedener technischer Indikatoren basieren. Er ist bereits vollständ
Last 50 Pips
Martin Alejandro Bamonte
Der Indikator Last 50 Pips ist dafür ausgelegt, Kauf- und Verkaufsmöglichkeiten basierend auf dem jüngsten Preisverhalten schnell zu identifizieren. Er misst die Preisänderungen in den letzten Kerzen, um Momente, in denen der Preis möglicherweise die Richtung ändert, in Gelb hervorzuheben. Kaufsignal: Sie sollten eine KAUF -Position eröffnen, wenn der Indikator von ROT auf GELB wechselt, was auf einen Wechsel von einem Abwärtstrend zu einem Aufwärtstrend hinweist. Bitte sehen Sie sich die Bild
FlashPoints Breakout
Martin Alejandro Bamonte
Jeden Tag zu Beginn des Marktes überprüft Flashpoints Breakout die Pivot-, Unterstützungs- und Widerstandsniveaus anhand der Daten des Vortages (Hoch, Tief und Schlusskurs), um zwei Ausbruchsniveaus (bullisch und bärisch) zu berechnen. Auf diese Weise haben Sie die neuen Einstiegspunkte am Morgen direkt zur Verfügung, zusammen mit Take Profit (TP) und Stop Loss (SL) Werten, wodurch Sie Buy Stop oder Sell Stop Pending Orders ohne zusätzliche Berechnungen platzieren können. Mit Flashpoints Breakou
Buy Sell Magic Signal
Martin Alejandro Bamonte
BUYSELLMAGIC is a non-repainting signal-type trading indicator designed to precisely detect entry points in the market.  Features Reliable and permanent signals : BUYSELLMAGIC signals are final once the candle closes, ensuring they will not be modified or removed from the chart. This gives you the confidence of working with an indicator that keeps its signals stable and trustworthy. Comprehensive alerts : In addition to signals on the chart, you’ll receive notifications via email, pop-up alert
Automatic Fibonacci Pivots
Martin Alejandro Bamonte
Automatic Fibonacci Pivots automatically calculates pivot levels and support/resistance based on Fibonacci, clearly showing key reference points that indicate potential reversal or trend continuation zones, as well as buy and sell areas . Designed for traders seeking clarity on charts without having to recalculate and manually place Fibonacci levels each time. Once set up on your computer, it will send an alert to your phone when a potential buy/sell signal is issued, allowing you to trade direc
Trade Insights Display
Martin Alejandro Bamonte
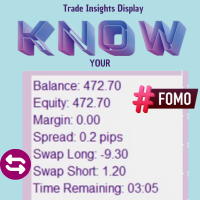
Trade Insights Display is the ideal companion for traders who want to operate with clarity and precision. This indicator provides real-time access to critical account data, such as: Balance Equity Margin Spread Swap Remaining time for the current candle . These data points are essential, regardless of the strategy or other indicators you use. Having this indicator always visible allows you to quickly assess your account status, the swap for each pair (helping you avoid high-cost trades), and the
Auswahl:
Keine Bewertungen
Antwort auf eine Rezension