• Übersicht
  • Bewertungen
  • Diskussion

Volatility Breakout Indicator

Der Volatility Breakout Indicator ist ein Trendindikator, der Wendepunkte bestimmt. Das Funktionsprinzip des Indikators basiert auf der Suche nach den anfänglichen Trendumkehrpunkten.
Da es auf ATR-Volatilitätsindikatoren basiert, wartet es nicht darauf, dass sich der Preis umkehrt und sich über eine gewisse Strecke bewegt, wie es bei Linienkreuzungen der Fall ist. Es bestimmt die Trendänderung mithilfe der ATR-indizierten Volatilitätsumkehrmethode.
Kann für alle Finanzinstrumente und Zeitrahmen verwendet werden.
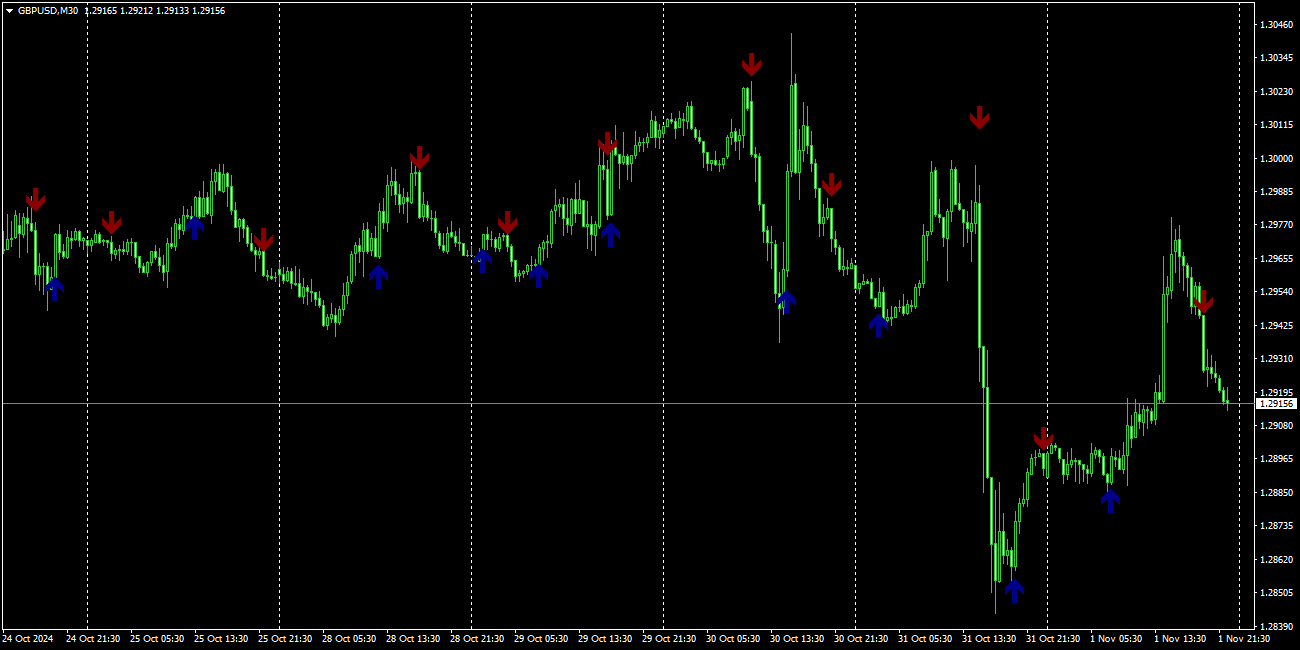
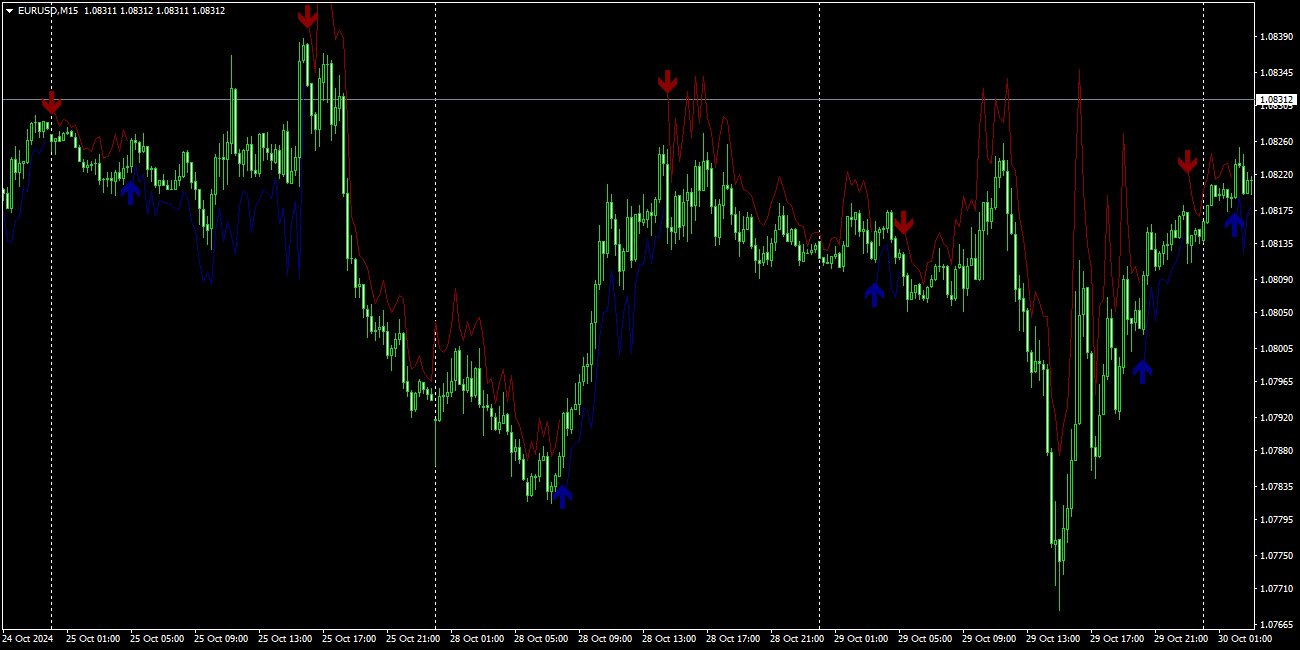
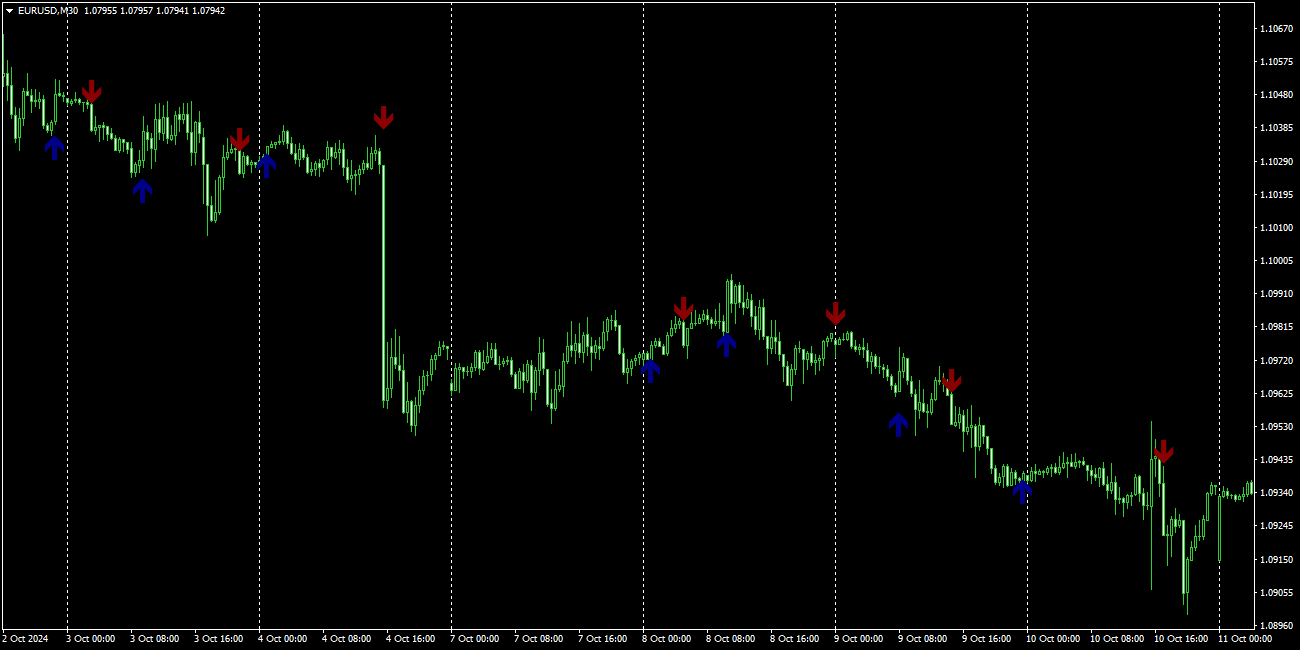
Die Pfeile erscheinen erst nach dem Schließen der Kerze und ändern nie ihre Farbe.
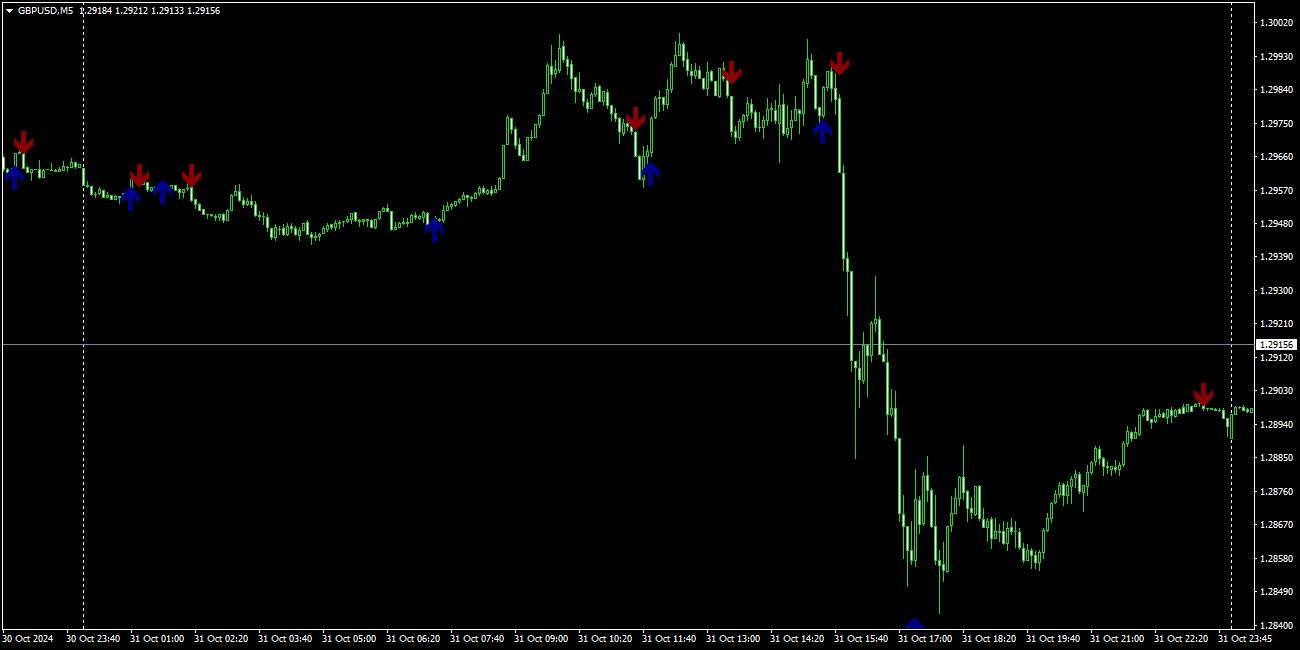
Kann als unabhängiger Indikator für einen oder zwei Zeitrahmen verwendet werden, um den Trend für die Zeitrahmen H1 - H4 zu bestimmen und Aufträge für M5 - M15 zu eröffnen.
Enthält verschiedene Arten von Warnungen für Pfeile.
Blaue Pfeile – nach oben drehen, rote Pfeile – nach unten drehen. Sie können die Anzeige von Linien einschalten.


Der Betrieb des Indikators wird durch zwei Parameter reguliert, die geändert werden müssen, um sie an Handelsinstrumente und Zeitrahmen anzupassen:

  1. Volatility Index (0,8-2) – passt die Häufigkeit von Trendumkehrungen an (von maximaler Häufigkeit bis minimal)
  2. ATR period (1-100) – welcher ATR-Zeitraum in den Berechnungen verwendet werden soll (ein größerer Zeitraum sorgt für eine Glättung)
Empfohlene Produkte
Doji Marker Point
Alexander Shienkov
This indicator shows the levels and signal dots of the Doji pattern. The indicator allows traders to easily determine possible location of a price rebound. Doji is a candlestick with Open and Close price equal, or almost equal. It should also have shadows of approximately the same size on both sides. Doji denotes the balance between buyers and sellers, or the absence of major players, or level testing. This pattern can mean both a reversal and a continuation of the trend. Indicator Parameters I
CycleIdentifier
Amyr Shryf Mhmd Salh
The Cycle Identifier MT4 indicator is a great choice of custom indicator for both short-term and long-term traders. The Cycle Identifier MT4 generates filtered price action signals to assist traders to identify when the conditions are right to open buy and sell positions. How it works The Cycle Identifier MT4 indicator displays on a separate indicator chart below the main chart where it draws an oscillating gray line. This gray line is characterized by upward and downward spikes that are accompa
The indicator allows you to trade binary options. The recommended time frame is М1 and the expiration time is 1 minutes. The indicator suitable for auto and manual trading. A possible signal is specified as a arrows above/under a candle. You should wait until the candle closes! Arrows are not re-painted Trade sessions: London and New York section Currency pairs: AUD/CAD Working time frame: M1 Expiration time: 1 minute The indicator also shows good results when using the martingale strategy - "Ma
FREE
Der Indikator „All Market Channels“ von ProfRobotrading erstellt automatisch alle gebildeten Handelskanäle und zeigt sie auf dem Bildschirm an. Dieser Indikator ist sehr praktisch für den Handel mit allen vorhandenen Kanalstrategien und ist auf alle Instrumente und Zeitrahmen anwendbar. Sehen Sie sich den Screenshot an – er wird Ihnen mehr sagen :) Weitere Informationen finden Sie auf unserer Website ProfRoboTrading.
Liquidity Buy Sell Signal Indicator is a no-nonsense, no delay, no repaint indicator ! Liquidity pools together with a trend filter is the most powerful and reliable signal according to me (with the correct parameters depending on the timeframe used) It selects buy/sell entry signals based on liquidity in the market. The time range to scan for liquidity can be set in the parameters. Liquidity is an important aspect in the market, especially for institutional investors, as they need lots of liqu
a novel indicator by the maker of velvet.                                                                                                                                                                                                                                                                                                                                                                                                                                                                           
FREE
Inside Bars
Paul Geirnaerdt
The Inside Bars indicator shows Inside Bars, the Breakout Zone and Breakouts thereof. Inside Bars are an important price action pattern. The price action of an Inside Bar is completely covered by the price action of the previous bar. Inside Bars are most often used on higher timeframes. Settings Inside Bars default settings are good enough most of the time. Feel free to fine tune them to your needs. ATR factor to skip large candles - very large candles should be filtered as they often cover othe
Smart Reversal Signal  is a professional indicator for the MetaTrader 4 platform; it has been developed by a group of professional traders. This indicator is designed for Forex and binary options trading. By purchasing this indicator, you will receive: Excellent indicator signals. Free product support. Regular updates. Various notification options: alert, push, emails. You can use it on any financial instrument (Forex, CFD, options) and timeframe. Indicator Parameters Perod - indicator calculat
One of the Price Action patterns called PinBar is implemented in a custom indicator. Usually means a large candle with a small body and a large tail. Such candles appear at the end of a movement or candles that indicate a continuation of the trend. The peculiarity of this PinBar indicator is that it determines the pattern on all timeframes. Information output by arrows is organized for the active timeframe and additionally for timeframes H1, H4, D1.
50+ Candlestick Patterns, Simulated Trading Results, Top Five Performers Candle Analysis extends Candlesticks Pattern Analysis by not only identifying Patterns but also recording the Past Performance of the Patterns. What it Does:- Identifies and plots results on chart Displays Top Patterns for both Bullish and Bearish type.  Log can be printed in experts tab to see Simulated Trading results Displays All or Selected Patterns Alerts on Pattern formation More detailed information in Blog
Upper and Lower Reversal – System zur frühzeitigen Vorhersage von Umkehrmomenten. Ermöglicht Ihnen, Preiswendepunkte an den Grenzen der oberen und unteren Preisbewegungskanäle zu finden. Der Indikator wird niemals seine Farbe ändern oder die Position der Signalpfeile ändern. Rote Pfeile sind ein Kaufsignal, blaue Pfeile sind ein Verkaufssignal. Passt sich allen Zeitrahmen und Handelsinstrumenten an Der Indikator wird nicht neu gezeichnet, er funktioniert nur, wenn die Kerze schließt. Es gibt v
Market Structure Zig Zag
Lesedi Oliver Seilane
4.63 (27)
Free Market structure zig zag to assist in price action trading the screenshots describe how to use and how to spot patterns new version comes with alerts, email alert and  push notification alert can be used on all pairs  can be used on all timeframes  you can add additional confirmation indicators the indicator shows you your higher high and low highs as well as your lower lows and lower highs  the indication makes price action analysis easier to spot.
FREE
This indicator Master XR indicator.Indicator displays trend movement. Indicator calculates automatically line. Features FiltPer - displays indicator period. deviation - displays indicator deviation. deviation2 - displays indicator deviation. How to understand the status: If (Timeframe M1-H1) FiltPer = 100; If ( Timeframe H4-MN) FiltPer = 5-20; ////////////////////////////////////////////////////////////////////////////////////////////////////////////////////////////////////////////////////// //
Die Idee hinter diesem Indikator besteht darin,   Murray-Pegel in allen Zeitrahmen zu finden und sie zu Combo-Pegeln zu kombinieren , die Signalpegel basierend auf starken Murray-Pegeln enthalten.   (+2,   +1, 8, 4, 0, -1, -2). Je kürzer der Zeitrahmen, desto mehr Chancen haben Sie, das Combo-Level sofort zu sehen. Es wird farblich hervorgehoben. Wenn Sie den Cursor über eine beliebige Zahl bewegen, wird ein Hinweis angezeigt, zu welchem ​​Zeitrahmen das Level gehört. Sie sehen jedoch immer den
Trend Scanner looks at the Market watchlist and Checks to see if there are trending cases between three (3) timeframes selected by the user. The analysis can assist in finding pairs to focus on for a particular session where a trader may need to have a bias in terms of direction to place trades for a particular system which requires multiple timeframe filtration of bar momentum. 3 Main indicators are involved: Moving Average, MACD and Heiken Ashi. User is able to select timeframes available on
Witch Hat for Binary Options is an indicator for binary options based on analysis of Bollinger Bands and RSI, using a modulated strategy with indicator settings using complex filters. This indicator never repaints, it has an almost accurate answer for you to make the entries. There are two ways for you to analyze your entry, when an arrow appears you have more than 90% chance of hits, and the other way is the lines that it automatically draws and its trend line. It has surprisingly strong sup
Ligma binary
Tanzid Ahmed Chonchol
The Ligma Binary Indicator is a sophisticated tool designed to assist traders in identifying key price action patterns that offer high-probability trade opportunities. This indicator is based on a unique strategy that detects isolated candles or “lonely” candles, which occur in trending markets and are often followed by strong price reversals or continuations. Key Features: Trend Detection: The indicator uses a Simple Moving Average (SMA) to identify the prevailing market trend (uptrend or downt
Chart Patterns Detect 15 patterns (Ascending Triangle, Descending Triangle, Rising Wedge, Falling Wedge, Bullish Flag, Bearish Flag, Bullish Rectangle, Bearish Rectangle Symmetrical triangle, Head and Shoulders, Inverted Head and Shoulders, Triple top, Triple Bottom, Double Top, Double Bottom) Use historical data to calculate the probability of each pattern to succeed (possibility to filter notification according to the chance of success) gives graphic indication about the invalidation level and
Ein speziell für das Scalping entwickelter technischer Indikator, der Volatilitätsimpulse erkennen und deren Dauer anzeigen kann. Es verfügt über flexible Parameter für manuelle Einstellungen, sodass Sie die Funktionalität des Indikators auf jedes Handelsinstrument anwenden können. Empfohlene Zeitrahmen sind M5, M15, M30, H1 und H4. Es gibt verschiedene Arten von Warnungen. Alle Signale ändern oder verfärben sich am Ende der Kerze nie. Der Indikator wird von oben nach unten durch Parameter konf
The main idea of this indicator is rates analysis and prediction by Fourier transform. Indicator decomposes exchange rates into main harmonics and calculates their product in future. You may use the indicator as a standalone product, but for better prediction accuracy there is another related indicator - FreqoMaster - which uses FreqoMeterForecast as a backend engine and combines several instances of FreqoMeterForecast for different frequency bands. Parameters: iPeriod - number of bars in the ma
KT Horizontal Lines MT4
KEENBASE SOFTWARE SOLUTIONS
In MetaTrader, plotting multiple   horizontal lines   and then tracking their respective price levels can be a hassle. This indicator automatically plots multiple horizontal lines at equal intervals for setting price alerts, plotting support and resistance levels, and other manual purposes. This indicator is suitable for Forex traders who are new and looking for chances to make quick profits from buying and selling. Horizontal lines can help traders find possible areas to start trading when the
MultiCurrency Indicators is a multi-currency indicator which calculates the values of multiple standard indicators for each of the 8 major currencies: EUR, GBP, AUD, NZD, USD, CAD, CHF, JPY. Advantages of the indicator Calculation is performed for 8 virtual charts of the currencies: EUR, GBP, AUD, NZD, USD, CAD, CHF, JPY; Show the currency strength, which does not depend on the currency pair; It allows determining the strongest and the weakest currencies at any moment, it also sorts currencies
ADX arrow N
Pavel Shutovskiy
ADX arrow Dieser Indikator zeigt die Signale des ADX-Indikators (Average Directional Movement Index) als Punkte auf dem Chart an. Dies erleichtert die visuelle Identifizierung von Signalen. Der Indikator verfügt auch über Warnungen (Pop-up-Meldungsfelder) Push-und Senden von Signalen an E-Mail. Rahmenbedingungen Zeitraum - Mittelungszeitraum. Anwenden auf - Preis für Berechnungen verwendet: Schließen, Öffnen, Hoch, Niedrig, Median (hoch + niedrig) / 2, Typisch (hoch + niedrig + schließen)
Smart Line is a trend indicator. It helps you find trend reversal points. This trading strategy is designed for trend trading. The indicator algorithm accurately determines the trend on various trading instruments, at different time intervals. The Smart Line indicator can be used as an additional tool, or as the main one. The color of the indicator lines changes depending on the current trend, as well as built-in indicators of possible entries in the position, indicated by arrows. Parameters
Reverse Martingale, also known as the "Paroli" betting system, is a gambling strategy used primarily in games of chance such as roulette, blackjack, or even sports betting. Unlike the traditional Martingale system, where a player doubles their bet after a loss, the Reverse Martingale involves increasing the bet after a win and reducing it after a loss. This strategy is often employed by individuals hoping to take advantage of winning streaks and capitalize on short-term gains. Here's how the Rev
Future Candle One Candle is an arrow indicator of candlestick patterns, based on the calculation of historical statistics. It identifies and calculates patterns consisting of one candle. Advantages of the indicator Gives information about the next candle right now; The indicator values are based on statistical data on the history of the current instrument; Forecasts and displays the result of trading based on its signals; The colors of the indicator have been selected for a comfortable operatio
Standard Trend Lines (Automatic). This indicator draws highly accurate trend lines. It draws Trend Lines automatically. This Trend Lines indicator was made by observing lot of discussions made about Trend Lines in forum. The Trend Lines can also be used to create Expert Advisor. Latest valid Trend Lines are drawn on Chart. Trend Lines Work on basis of OHLC price data.
Follow The Line PRO
Oliver Gideon Amofa Appiah
3.67 (3)
FOLLOW THE LINE (PRO VERSION) This powerful indicator is the full and complete version of my free indicator called "Follow The Line". IT IS BASED ON the popular maxim that: "THE TREND IS YOUR FRIEND" It gives alarms and alerts of all kinds. IT DOES NOT REPAINT and can be used for all currency pairs and timeframes. AVOID FALSE SIGNALS: BUY ONLY when price closes above the green line and the green line is above the blue channel. SELL ONLY when price closes below the pink line and the pink line i
Future Candle Two Candle is an arrow indicator of candlestick patterns, based on the calculation of historical statistics. It identifies and calculates patterns consisting of two candles. Advantages of the indicator Gives information about the next candle right now; The indicator values are based on statistical data on the history of the current instrument; Forecasts and displays the result of trading based on its signals; The colors of the indicator have been selected for a comfortable operati
Future Candle Three Candle is an arrow indicator of candlestick patterns, based on the calculation of historical statistics. It identifies and calculates patterns consisting of three candles. Advantages of the indicator Gives information about the next candle right now; The indicator values are based on statistical data on the history of the current instrument; Forecasts and displays the result of trading based on its signals; The colors of the indicator have been selected for a comfortable ope
Käufer dieses Produkts erwarben auch
Gann Made Easy
Oleg Rodin
4.79 (112)
Gann Made Easy ist ein professionelles und einfach zu bedienendes Forex-Handelssystem, das auf den besten Handelsprinzipien unter Verwendung der Theorie von Mr. basiert. W.D. Gann. Der Indikator liefert genaue KAUF- und VERKAUFSsignale, einschließlich Stop-Loss- und Take-Profit-Levels. Mit PUSH-Benachrichtigungen können Sie auch unterwegs handeln. Bitte kontaktieren Sie mich nach dem Kauf! Ich werde meine Handelstipps und tolle Bonusindikatoren kostenlos mit Ihnen teilen! Wahrscheinlich haben Si
Dynamic Forex28 Navigator
Bernhard Schweigert
5 (4)
Dynamic Forex28 Navigator – Das Forex-Handelstool der nächsten Generation AKTUELL 49 % RABATT. Dynamic Forex28 Navigator ist die Weiterentwicklung unserer seit langem beliebten Indikatoren und vereint die Leistung von drei in einem: Advanced Currency Strength28 Indicator (695 Bewertungen) + Advanced Currency IMPULSE mit ALERT (520 Bewertungen) + CS28 Combo Signals (Bonus) Details zum Indikator https://www.mql5.com/en/blogs/post/758844 Was bietet der Strength Indicator der nächsten Generation?
Gold Stuff
Vasiliy Strukov
4.86 (249)
Gold Stuff-Ein Trendindikator, der speziell für Gold entwickelt wurde, kann auch auf allen Finanzinstrumenten verwendet werden. Der Indikator wird nicht neu gezeichnet und verzögert sich nicht. Empfohlener Zeitrahmen H1. Nach diesem Indikator geschrieben EA Gold Stuff Berater, können Sie es in meinem Profil finden. WICHTIG! Kontaktieren Sie mich sofort nach dem Kauf, um Anweisungen und Bonus zu erhalten!   Sie können eine kostenlose Kopie unseres Strong Support- und Trendscanner-Indikators er
-   Real price is 80$   - 40% Discount ( It is 49$ now ) - Lifetime update free Contact me for instruction, add group and any questions! Related Products:  Bitcoin Expert , Gold Expert - Non-repaint - I just sell my products in Elif Kaya profile, any other websites are stolen old versions, So no any new updates or support. Introduction The breakout and retest strategy is traded support and resistance levels. it involves price breaking through a previous level.  The break and retest strategy is
Scalper Inside PRO
Alexey Minkov
4.76 (63)
!SPECIAL SALE! An exclusive indicator that utilizes an innovative algorithm to swiftly and accurately determine the market trend. The indicator automatically calculates opening, closing, and profit levels, providing detailed trading statistics. With these features, you can choose the most appropriate trading instrument for the current market conditions. Additionally, you can easily integrate your own arrow indicators into Scalper Inside Pro to quickly evaluate their statistics and profitability
Gold Venamax MT4
Sergei Linskii
5 (1)
Gold Venamax   – das ist der beste technische Indikator für Aktien. Der Indikatoralgorithmus analysiert die Preisbewegung eines Vermögenswerts und spiegelt die Volatilität und potenzielle Einstiegszonen wider. Indikatorfunktionen: Dies ist ein Super-Indikator mit Magic und zwei Blöcken von Trendpfeilen für komfortables und profitables Trading. Auf dem Diagramm wird eine rote Schaltfläche zum Wechseln von Blöcken angezeigt. Magic ist in den Indikatoreinstellungen eingestellt, sodass Sie den In
Lux Trend
Mohamed Hassan
5 (3)
After purchase, please contact me to get your trading tips + more information for a great bonus!   Lux Trend is a professional strategy based on using Higher Highs and Lower Highs to identify and draw Trendline Breakouts! Lux Trend  utilizes two Moving Averages to confirm the overall trend direction before scanning the market for high-quality breakout opportunities, ensuring more accurate and reliable trade signals. This is a proven trading system used by real traders worldwide, demonstrating
Currency Strength Wizard ist ein sehr leistungsstarker Indikator, der Ihnen eine Komplettlösung für erfolgreichen Handel bietet. Der Indikator berechnet die Stärke dieses oder jenes Forex-Paares anhand der Daten aller Währungen in mehreren Zeitrahmen. Diese Daten werden in Form von benutzerfreundlichen Währungsindizes und Währungsstärkelinien dargestellt, anhand derer Sie die Stärke dieser oder jener Währung erkennen können. Sie müssen lediglich den Indikator an das Diagramm anhängen, mit dem Si
FX Levels MT4
Daniel Stein
5 (2)
FX Levels: Außerordentlich präzise Unterstützungs- und Widerstandszonen für alle Märkte Kurzüberblick Suchen Sie eine verlässliche Methode, um Support- und Resistance-Level in jedem Markt zu identifizieren—egal ob Währungspaare, Indizes, Aktien oder Rohstoffe? FX Levels vereint die traditionelle „Lighthouse“-Methode mit einem modernen dynamischen Ansatz und bietet nahezu universelle Genauigkeit. Durch unsere Erfahrung mit echten Brokern sowie automatischen täglichen und Echtzeit-Updates hilft
PRO Renko System ist ein hochpräzises Handelssystem, das speziell für den Handel mit RENKO-Charts entwickelt wurde. Dies ist ein universelles System, das auf verschiedene Handelsinstrumente angewendet werden kann. Das System neutralisiert effektiv so genannte Marktgeräusche, die Ihnen Zugang zu genauen Umkehrsignalen geben. Der Indikator ist sehr einfach zu bedienen und hat nur einen Parameter, der für die Signalerzeugung verantwortlich ist. Sie können das Tool einfach an jedes Handelsinstrum
Golden Trend Indicator
Noha Mohamed Fathy Younes Badr
4.9 (10)
Golden Trend indicator  is The best indicator for predicting trend movement this indicator never lags and never repaints and never back paints    and give  arrow buy and sell    before the candle appear  and it will help you and  will make your trading decisions clearer its work on all currencies and  gold and crypto and all time frame This unique  indicator uses very secret algorithms to catch the  trends, so you can trade using this indicator and see the trend clear on charts  manual guide and
Scalper Vault
Oleg Rodin
5 (29)
Scalper Vault ist ein professionelles Scalping-System, das Ihnen alles bietet, was Sie für erfolgreiches Scalping benötigen. Dieser Indikator ist ein komplettes Handelssystem, das von Forex- und Binäroptionshändlern verwendet werden kann. Der empfohlene Zeitrahmen ist M5. Das System liefert Ihnen genaue Pfeilsignale in Richtung des Trends. Es liefert Ihnen auch Top- und Bottom-Signale und Gann-Marktniveaus. Die Indikatoren bieten alle Arten von Warnungen, einschließlich PUSH-Benachrichtigungen.
Trend Screener
STE S.S.COMPANY
4.78 (93)
Trendindikator, bahnbrechende, einzigartige Lösung für Trendhandel und -filterung mit allen wichtigen Trendfunktionen in einem Tool! Es handelt sich um einen 100 % nicht neu zu malenden Multi-Timeframe- und Multi-Währungs-Indikator, der für alle Symbole/Instrumente verwendet werden kann: Forex, Rohstoffe, Kryptowährungen, Indizes und Aktien. ZEITLICH BEGRENZTES ANGEBOT: Der Support- und Resistance-Screener-Indikator ist für nur 50 $ und lebenslang verfügbar. (Ursprünglicher Preis 250 $) (Angebot
MTF Supply Demand Zones
Georgios Kalomoiropoulos
4.83 (23)
Automatisierte Angebots- und Nachfragezonen der nächsten Generation. Neuer und innovativer Algorithmus, der bei jedem Diagramm funktioniert. Alle Zonen werden dynamisch entsprechend der Preisbewegung des Marktes erstellt. ZWEI ARTEN VON WARNUNGEN --> 1) WENN DER PREIS EINE ZONE ERREICHT 2) WENN EINE NEUE ZONE BILDET WIRD Sie erhalten keinen weiteren nutzlosen Indikator. Sie erhalten eine vollständige Handelsstrategie mit nachgewiesenen Ergebnissen.     Neue Eigenschaften:     Warnungen, w
IX Power MT4
Daniel Stein
4.71 (7)
IX Power: Markteinblicke für Indizes, Rohstoffe, Kryptowährungen und Forex Überblick IX Power ist ein vielseitiges Tool zur Analyse der Stärke von Indizes, Rohstoffen, Kryptowährungen und Forex-Symbolen. Während FX Power die höchste Präzision für Währungspaare bietet, indem es alle verfügbaren Paardaten einbezieht, konzentriert sich IX Power ausschließlich auf die Marktdaten des zugrunde liegenden Symbols. Dies macht IX Power zu einer hervorragenden Wahl für Nicht-Forex-Märkte und zu einem zuv
Easy Breakout
Mohamed Hassan
5 (9)
After your purchase, feel free to contact me for more details on how to receive a bonus indicator called VFI, which pairs perfectly with Easy Breakout for enhanced confluence!   Easy Breakout is a powerful price action trading system built on one of the most popular and widely trusted strategies among traders: the Breakout strategy ! This indicator delivers crystal-clear Buy and Sell signals based on breakouts from key support and resistance zones. Unlike typical breakout indicators, it levera
Smart Set up Levels
Mohit Dhariwal
5 (1)
Smart Set up leve l is a very powerful indicator based on the concept of order blocks and set up entries with proper fvg and breakouts to make a very nice level to enter like a pro trader. Very easy to use interface and friendly to enter on buy and sell signals. Works Best on M15 Time frame on Gold, Bitcoin and Fx pairs. Daily 4-5 trades on each pair  Works great on gold like a pro on M15 It is non repainting nor lagging It is very powerful indicator giving precise entries and prop acts can be c
FX Volume
Daniel Stein
4.59 (34)
FX Volume: Erleben Sie den echten Marktüberblick aus der Sicht eines Brokers Kurzüberblick Möchten Sie Ihre Handelsstrategie auf das nächste Level bringen? FX Volume liefert Ihnen Echtzeit-Einblicke in die Positionierung von Retail-Tradern und Brokern — lange bevor verzögerte Berichte wie der COT verfügbar sind. Ob Sie nach beständigen Gewinnen streben oder einfach einen tieferen Vorteil am Markt suchen, FX Volume hilft Ihnen, große Ungleichgewichte zu erkennen, Breakouts zu bestätigen und Ihr
Gold Trend   - dies ist ein guter technischer Indikator für Aktien. Der Algorithmus des Indikators analysiert die Preisbewegung eines Vermögenswerts und spiegelt die Volatilität und mögliche Einstiegszonen wider. Die besten Indikatorsignale: - Für VERKAUFEN = rotes Histogramm + roter SHORT-Zeiger + gelber Signalpfeil in dieselbe Richtung. - Für KAUFEN = blaues Histogramm + blauer LONG-Zeiger + aquafarbener Signalpfeil in dieselbe Richtung. Vorteile des Indikators: 1. Der Indikator erzeugt
Beast Super Signal
Dustin Vlok
4.73 (89)
Suchen Sie nach einem leistungsstarken Indikator für den Devisenhandel, der Ihnen dabei helfen kann, profitable Handelsmöglichkeiten mit Leichtigkeit zu erkennen? Suchen Sie nicht weiter als das Beast Super Signal. Dieser benutzerfreundliche trendbasierte Indikator überwacht kontinuierlich die Marktbedingungen, sucht nach neuen sich entwickelnden Trends oder springt auf bestehende Trends ein. Das Beast Super Signal gibt ein Kauf- oder Verkaufssignal, wenn alle internen Strategien aufeinander ab
Wir stellen Ihnen ON Trade Waves Patterns Harmonic Elliot Wolfe vor, einen fortschrittlichen Indikator, der entwickelt wurde, um verschiedene Markt-Muster mithilfe sowohl manueller als auch automatischer Methoden zu erkennen. Hier ist, wie er funktioniert: Harmonische Muster: Dieser Indikator kann harmonische Muster erkennen, die auf Ihrem Chart erscheinen. Diese Muster sind für Trader, die die Theorie des harmonischen Handels praktizieren, wie sie in Scott Carney's Buch "Harmonic Trading vol 1
System Trend Pro
Aleksandr Makarov
5 (2)
System Trend Pro - This is the best trend trading indicator!!! The indicator no repaint!!!  The indicator has   MTF   mode, which adds confidence to trading on the trend (   no repaint   ). How to trade? Everything is very simple, we wait for the first signal (big arrow), then wait for the second signal (small arrow) and enter the market in the direction of the arrow. (See screens 1 and 2.) Exit on the opposite signal or take 20-30 pips, close half of it, and keep the rest until the opposite s
M1 Arrow
Oleg Rodin
5 (16)
Eine Intraday-Strategie, die auf zwei Grundprinzipien des Marktes basiert. Der Algorithmus basiert auf der Analyse von Volumina und Preiswellen mit zusätzlichen Filtern. Der intelligente Algorithmus des Indikators gibt nur dann ein Signal, wenn sich zwei Marktfaktoren zu einem vereinen. Der Indikator berechnet Wellen eines bestimmten Bereichs auf dem M1-Diagramm unter Verwendung der Daten des höheren Zeitrahmens. Und um die Welle zu bestätigen, verwendet der Indikator eine Volumenanalyse. Dieser
FX Power MT4 NG
Daniel Stein
4.94 (18)
FX Power: Analysieren Sie die Stärke von Währungen für intelligentere Handelsentscheidungen Übersicht FX Power ist Ihr unverzichtbares Werkzeug, um die tatsächliche Stärke von Währungen und Gold unter allen Marktbedingungen zu verstehen. Indem Sie starke Währungen kaufen und schwache verkaufen, vereinfacht FX Power Ihre Handelsentscheidungen und deckt Chancen mit hoher Wahrscheinlichkeit auf. Ob Sie Trends folgen oder extreme Delta-Werte nutzen, um Umkehrungen zu prognostizieren, dieses Tool p
Advanced Supply Demand
Bernhard Schweigert
4.91 (294)
Derzeit 33% Rabatt! Die beste Lösung für jeden Anfänger oder erfahrenen Händler! Dieser Indikator ist ein einzigartiges, qualitativ hochwertiges und erschwingliches Trading-Tool, da wir eine Reihe von proprietären Funktionen und eine neue Formel integriert haben. Mit diesem Update werden Sie in der Lage sein, doppelte Zeitrahmenzonen anzuzeigen. Sie können nicht nur einen höheren TF (Zeitrahmen) anzeigen, sondern sowohl den Chart-TF als auch den höheren TF: SHOWING NESTED ZONES. Alle Supply Dema
MetaBands M4
Vahidreza Heidar Gholami
5 (3)
MetaBands verwendet leistungsstarke und einzigartige Algorithmen, um Kanäle zu zeichnen und Trends zu erkennen, sodass es Tradern potenzielle Punkte für den Einstieg und Ausstieg aus Trades bieten kann. Es ist ein Kanalindikator sowie ein leistungsstarker Trendindikator. Es umfasst verschiedene Arten von Kanälen, die einfach durch Verwendung der Eingabeparameter zusammengeführt werden können. MetaBands verwendet alle Arten von Warnmeldungen, um Benutzer über Marktereignisse zu informieren. Funkt
Enigmera
Ivan Stefanov
5 (7)
ENIGMERA: Der Kern des Marktes Wichtig: Die MQL5.com-Demo wird im Strategy Tester ausgeführt und spiegelt möglicherweise nicht vollständig die Funktionalität von Enigmera wider. Überprüfen Sie die Beschreibung, Screenshots und das Video für Details. Zögern Sie nicht, mir bei Fragen eine Nachricht zu senden! Der Code des Indikators wurde vollständig neu geschrieben. Version 3.0 fügt neue Funktionen hinzu und behebt Fehler, die seit der Einführung des Indikators aufgetreten sind. Einführung Dies
Apollo BuySell Predictor ist ein professionelles Handelssystem, das mehrere Handelsmodule umfasst. Es bietet einem Trader einzigartige Breakout-Zonen, Fibonacci-basierte Unterstützungs- und Widerstandsniveaus, Pivot-Trendlinie, Pullback-Volumensignale und andere hilfreiche Funktionen, die jeder Trader täglich benötigt. Das System funktioniert mit jedem Paar. Empfohlene Zeitrahmen sind M30, H1, H4. Der Indikator kann jedoch auch mit anderen Zeitrahmen arbeiten, mit Ausnahme der Zeitrahmen höher a
Blahtech Supply Demand
Blahtech Limited
4.64 (36)
Was: $299  Now: $149   Supply Demand uses previous price action to identify potential imbalances between buyers and sellers. The key is to identify the better odds zones, not just the untouched ones. Blahtech Supply Demand indicator delivers functionality previously unavailable on any trading platform. This 4-in-1 indicator not only highlights the higher probability zones using a multi-criteria strength engine, but also combines it with multi-timeframe trend analysis, previously confirmed swings
Entdecken Sie das Geheimnis des erfolgreichen Forex -Handels mit unserem benutzerdefinierten MT4 -Indikator! Haben Sie sich jemals gefragt, wie Sie Erfolg auf dem Forex -Markt erzielen können und gleichzeitig Gewinne erzielen und gleichzeitig das Risiko minimieren können? Hier ist die Antwort, nach der Sie gesucht haben! Erlauben Sie uns, unseren proprietären MT4 -Indikator vorzustellen, der Ihren Handelsansatz revolutionieren wird. Einzigartige Vielseitigkeit Unser Indikator ist speziell für
Weitere Produkte dieses Autors
Trendindikatoren sind einer der Bereiche der technischen Analyse und werden im Handel an Finanzmärkten eingesetzt. Angular Trend Lines -Indikator – bestimmt umfassend die Trendrichtung und generiert Einstiegssignale. Neben der Glättung der durchschnittlichen Richtung der Kerzen Dabei wird auch der Neigungswinkel von Trendlinien genutzt. Für den Neigungswinkel wurde das Prinzip der Konstruktion von Gann-Winkeln zugrunde gelegt. Der Indikator für die technische Analyse kombiniert Candlestick-Glätt
Ein technischer Indikator, der Diagramme strukturiert und zyklische Preisbewegungen identifiziert. Kann mit allen Diagrammen funktionieren. Mehrere Arten von Benachrichtigungen. Auf dem Diagramm selbst befinden sich zusätzliche Pfeile. Ohne erneutes Zeichnen der Historie wird beim Schließen der Kerze gearbeitet. Empfohlener TF ab M5. Einfach zu verwenden und Parameter zu konfigurieren. Wenn Sie 2 Indikatoren mit unterschiedlichen Parametern verwenden, können Sie diese ohne andere Indikatoren ve
Point Trend Indicator – Ein Indikator für das obere und untere Niveau des Trends, der die Trendrichtung bestimmen und seine Verstärkung anzeigen kann. Die Trendrichtung wird durch runde Punkte bestimmt; liegen die Punkte über der Nulllinie, ist der Trend bullisch, liegen sie darunter, ist der Trend bärisch. Die Zunahme der Richtungsbewegung wird durch Pfeile angezeigt. Es gibt den einzigen Parameter zur manuellen Anpassung – die Dauer der Trendrichtung.   Möglichkeiten Funktioniert in allen Zei
Volatility Trend System – ein Handelssystem, das Signale für Einstiege gibt. Das Volatilitätssystem liefert lineare und punktuelle Signale in Richtung des Trends sowie Signale zum Verlassen des Trends, ohne Neuzeichnung und Verzögerungen. Der Trendindikator überwacht die Richtung des mittelfristigen Trends, zeigt die Richtung und deren Änderung an. Der Signalindikator basiert auf Änderungen der Volatilität und zeigt Markteintritte an. Der Indikator ist mit mehreren Arten von Warnungen ausgestat
Indikator für manuellen Handel und technische Analyse für Forex. Es besteht aus einem Trendindikator mit dem Eröffnungsniveau des Handelstages und einem Pfeilindikator zur Bestimmung von Einstiegspunkten. Der Indikator ändert seine Farbe nicht; er funktioniert, wenn die Kerze schließt. Enthält verschiedene Arten von Warnungen für Signalpfeile. Kann für die Arbeit mit jedem Diagramm, Handelsinstrument oder Zeitrahmen konfiguriert werden. Die Arbeitsstrategie basiert auf der Suche nach Preisbewe
Wave Reversal Indicator - bestimmt die Richtung und Preisumkehrungen um die Bilanzlinie. Der Indikator zeigt Wellenbewegungen und Trendanstiege. Er gibt Empfehlungen, wohin er dem Händler folgen soll, und hilft bei der Verfolgung der Handelsstrategie. Es handelt sich um eine Ergänzung zu einer Intraday- oder mittelfristigen Strategie. Fast alle Parameter werden für jeden Zeitrahmen ausgewählt und ändern sich automatisch. Der einzige Parameter, der manuell angepasst werden kann, ist die Wellenlän
FREE
Scalping Entry Points - ist ein manuelles Handelssystem, das sich an Preisbewegungen anpassen und Signale für offene Geschäfte ohne Neuzeichnung geben kann. Der Indikator bestimmt die Richtung des Trends anhand des zentralen Unterstützungs- und Widerstandsniveaus. Der Punktindikator liefert Signale für Ein- und Ausstiege. Geeignet für manuellen Intraday-Handel, Scalping und binäre Optionen. Funktioniert für alle Zeitrahmen und Handelsinstrumente. Der Indikator gibt verschiedene Arten von Warnung
Das Volatility Trend System ist ein Handelssystem, das Signale für Einstiege liefert. Das Volatilitätssystem liefert lineare und punktuelle Signale in Richtung des Trends sowie Signale zum Verlassen des Trends, ohne Neuzeichnung oder Verzögerungen. Der Trendindikator überwacht die Richtung des mittelfristigen Trends, zeigt die Richtung und deren Änderung an. Der Signalindikator basiert auf Änderungen der Volatilität und zeigt Markteintritte an. Der Indikator ist mit mehreren Arten von Warnungen
An indicator that determines the point levels of price resistance. The arrows indicate price bounces in the indicated directions. Arrows are not redrawn formed on the current candle, shown on the previous candle for convenience.      It has one setting - the formation intensity: If the parameter is smaller, most of the signals are formed in a wide trend. If the parameter is larger, signals are formed in a narrower trend. Input parameters Formation Intensity - Arrow Formation Intensity Number B
Line Breakouts – System für den Trendhandel. Enthält eine Trendkennung, die mithilfe der Perioden- und Glättungsfunktion an jedes Diagramm und Handelsinstrument angepasst werden kann. Und ein bestimmender Faktor für die Unterstützungs- und Widerstandsniveaus. Wenn der Preis unter der Widerstandslinie liegt, eröffnen Sie Verkaufsgeschäfte, und wenn der Preis über der Unterstützungslinie liegt, eröffnen Sie Kaufgeschäfte. Der Stop-Loss sollte einige Punkte von den Linien entfernt platziert werden.
Arrow indicator with trend filter. Generates trend input without delays or delays - on the emerging candle. Suitable for use on any trading tools and timeframes. Easy to use, contains the direction of the trend in the form of a histogram lines and signal generator. Input parameters Period Trend Line - Period of the Histogram Line Signal Generator Period - If the period is longer, then the arrows are less Play sound Display pop-up message Send push notification Send email Sound file signal - Fi
Lines Channel Pro
Vitalyi Belyh
5 (1)
The "Lines Channel Pro" indicator determines price reversals from the High/Low channel. Contains a built-in trend finder, signal lines, entry and exit points. The recommended timeframe for M15 to work is D1. For each timeframe and trading instrument, depending on the volatility, it is necessary to select individual settings. Does not redraw calculations. Input parameters Use Channel trend filter - Turn on/off the trend filter Channel trend period - Trend filter period (from 8 and above) Line
Der Indikator „ ZigZag on Trend “ ist ein Assistent zur Bestimmung der Richtung der Preisbewegung sowie ein Balken- und Pip-Rechner. Es besteht aus einem Trendindikator, der die Richtung des Preises anhand einer Trendlinie in Form eines Zickzacks überwacht, und einem Zähler, der die Anzahl der in Trendrichtung durchlaufenen Balken und die Anzahl der Punkte auf einer vertikalen Skala berechnet. (Berechnungen werden bei der Eröffnung des Balkens durchgeführt) Der Indikator wird nicht neu gezeichne
Channel Cluster
Vitalyi Belyh
5 (1)
Cluster indicator working in the price channel. For operation, the indicator builds a channel line - (dashed line). Inside the channel, cluster sections are determined that determine the direction of the price movement - (histograms in two directions), start with large arrows. Small arrows are plotted above / below each histogram - indicator increase volatility. The indicator does not redraw the values. Works on any tools and timeframes. Entrances are made when large arrows appear, inside small
Oscillatory price direction indicator for Forex. It has 2 operating modes - trend and scalping. The trend mode of operation allows you to determine the direction of the market movement in the medium term. The scalping mode works by determining the price movement in the short term. Consists of a blue line, from which the balance between the directions of the price and signal green / red line. The green line shows the direction of the price up, and the red line shows the direction of the price dow
Zig-Zag indicator with additional signals for inputs. Visually easy to use: The red zig-zag line is an uptrend. The blue zig-zag line is a downward trend. Arrows in the form of additional signals. Works on any trading pairs. On any timeframe. Not redrawn. Input parameters Zig-Zag Period - Zig-zag period (from 5) Signal Period - period of signal arrows (from 3) Alerts for signals Play sound - Sound alert Display pop-up message - Notification by message on the screen Send push notification
Signal indicator that displays price reversals from the upper and lower corners of the chart. It is adjusted for different volatility and timeframes by one parameter - Gradation . Works on any trading pairs. The recommended timeframe for use is from M15 and higher. Not redrawn. If necessary, I will help you choose the optimal setting. Input parameters Gradation - from 0 and higher. If the parameter is larger, arrows are displayed at shorter price intervals. Alerts for signals Play sound - S
Linear indicator for trend trading together with scalping method. The yellow line is used to calculate the long-term price trend. As the yellow line moves, a scalper signal line is applied - a thin red one. A zero level is applied to confirm signals. If the yellow line crossed the zero level upwards, the trend is up. If the yellow line crossed the zero level from top to bottom, the trend is down. The signal red line works in a similar way, only its sensitivity to price movements is higher. Re
Candles Scalper is an indicator of scalping signals. Designed for use on flat and average price movements, showing price reversal directions. It works the same on long trends, but with fewer signals. Suitable for use on timeframes more than M15, the optimal timeframe is M15, M30, H1. Arrows serve as input signals, and dots serve to stop the signal. Sell signals are blue, stops are blue. Buy signals are brown, stops are red. There is 1 parameter in the "Signal index" settings - the index of the
A technical indicator that calculates its readings based on trading volumes. It has an oscillatory line that follows the change in volumes. Large arrows on the line indicate reversal values. A channel is built around the line with small arrows showing the strengthening of price movement in the direction of increasing volumes. The indicator does not redraw values. Works on any instrument and timeframe. It can complement any trading strategy by finding a trend or make entries in the direction of a
This indicator is based on a trend guide line and a special oscillator, defining entry points at the moments of potential price movement. The indicator does not redraw. Works on any instrument. The most preferred time frames to use are M5, M15, M30, H1, H4. The guide trend line of the indicator gives an idea about the movement of the market. When the green line crosses the zero level from top to bottom - the market is bearish when it crosses from bottom to top - bull market. The oscillator is
A trend indicator showing the strength of bulls and bears in a trading range. Consists of two lines: The green line is a balanced overbought/oversold condition. The red line is the direction of trading activity. Does not redraw calculations. Can be used on all Symbols/Instruments/Time Frames. Easy to use and set up. How to use the indicator and what it determines. The basic rule is to follow the direction of the red line: if it crosses the green line from the bottom up, the market is dominat
Developed methods for trading collected in one indicator. In the form of arrows, it defines entries in the direction of the trend. It has 2 types of arrows - trend and signal guides, informing about the potential movement in the direction of the trend. Works without redrawing, ready for use on all symbols/tools. The most suitable time frames to use are M15, M30, H1, H4. How to use The indicator finds the direction of the trend in the form of a signal arrow, a graphic rectangle stretches along
Zyklischer Indikator für den Handel und die Prognose der Marktrichtung. Zeigt das zyklische Verhalten des Preises in Form eines Oszillators. Gibt Signale für die Eröffnung von Trades aus, wenn es eine Erholung von der Ober- und Untergrenze des Oszillators gibt. In Form eines Histogramms zeigt es die geglättete Stärke des Trends.  Ergänzt jede Handelsstrategie, vom Scalping bis zum Intraday.  Der Indikator wird nicht neu gezeichnet.  Geeignet für den Einsatz auf allen Symbolen/Instrumenten.  Gee
Max Min Reversal Arrows - an arrow reversal indicator for predicting price movement. The indicator is built on the support and resistance levels at the local lows and highs of the price. Product features Arrows appear on the current candle. The indicator does not redraw. Can be used on all time frames and trading instruments. Recommended timeframes to use M30, H1, H4. The dotted lines are the support and resistance levels within the signal. Price movement from these levels means a reversal. Pr
Scalping Entry Points - ist ein manuelles Handelssystem, das sich an Preisbewegungen anpassen und Signale für offene Geschäfte ohne Neuzeichnung geben kann. Der Indikator bestimmt die Richtung des Trends anhand des zentralen Unterstützungs- und Widerstandsniveaus. Der Punktindikator liefert Signale für Ein- und Ausstiege. Geeignet für manuellen Intraday-Handel, Scalping und binäre Optionen. Funktioniert für alle Zeitrahmen und Handelsinstrumente. Der Indikator gibt verschiedene Arten von Warnung
Indikator des Preiskanals und des darin enthaltenen Breakpoint-Generators. Es gibt einen Eindruck von der Lage des Preises im Verhältnis zur Nutzungsdauer. Es enthält geglättete Trend-Absprunglinien entlang der Kanalgrenzen und Absprungpunkte, die den Ein- und Ausstiegszeitpunkt bestimmen. Funktioniert mit verschiedenen Handelsinstrumenten und Zeitrahmen. So arbeiten Sie mit dem Indikator Folgen Sie der Kanalunterbrechungslinie. Die blaue Linie zeigt die oberen Eingänge, die rosa Linie die unt
Candle Binary Scalper ist ein technisches Analyseprodukt für Devisen und binäre Optionen. Enthält mehrere technische Indikatoren, die in einem Handelssystem zusammengefasst sind. Geeignet für den manuellen Handel innerhalb eines Trends, für Scalping und binäre Optionen. Funktioniert für alle Zeitrahmen und Handelsinstrumente. Empfohlene Zeitrahmen für den Handel M15, M30, H1 und H4, M5 und M1 sollten bei hoher Volatilität verwendet werden. Es gibt verschiedene Arten von Warnungen. So verwenden
Binary Lines ist ein technischer Analyseindikator für Währungen, Rohstoffe, Kryptowährungen, Aktien, Indizes und alle Finanzinstrumente. Kann für binäre Optionen oder Forex-Scalping verwendet werden. Zeigt Ein- und Ausstiegspunkte in festen Abständen an und stellt bereit Händlern die notwendigen Informationen über die Ergebnisse möglicher Transaktionen. Einstiegspunkte werden ganz am Anfang der Kerze in Richtung der MA-Linie und der Dauer gebildet Trades in Bars können manuell angepasst und an j
Ein technischer Indikator, der seine Messwerte anhand des Handelsvolumens berechnet. In Form eines Histogramms zeigt es die Akkumulation der Stärke der Bewegung des Handelsinstruments. Es verfügt über unabhängige Berechnungssysteme für bullische und bärische Richtungen. Funktioniert mit allen Handelsinstrumenten und Zeitrahmen. Kann jedes Handelssystem ergänzen. Der Indikator zeichnet seine Werte nicht neu, die Signale erscheinen auf der aktuellen Kerze. Es ist einfach zu bedienen, lädt das Diag
Auswahl:
Keine Bewertungen
Antwort auf eine Rezension