ZigZag Medvedev Close for MQL5
- Indikatoren
- Valeriy Medvedev
- Version: 1.3
- Aktualisiert: 12 Juni 2021
- Aktivierungen: 5
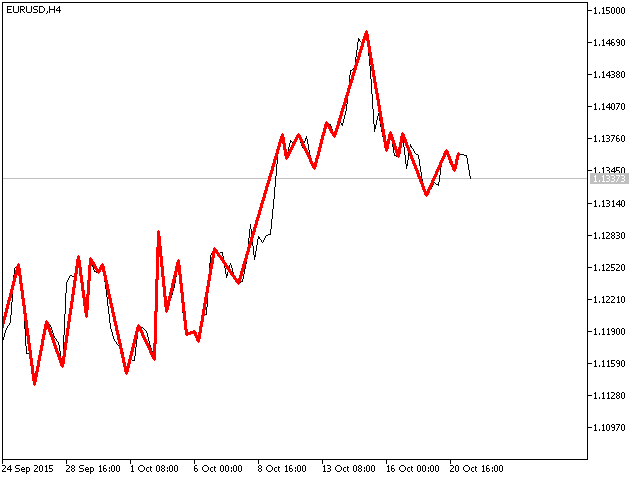
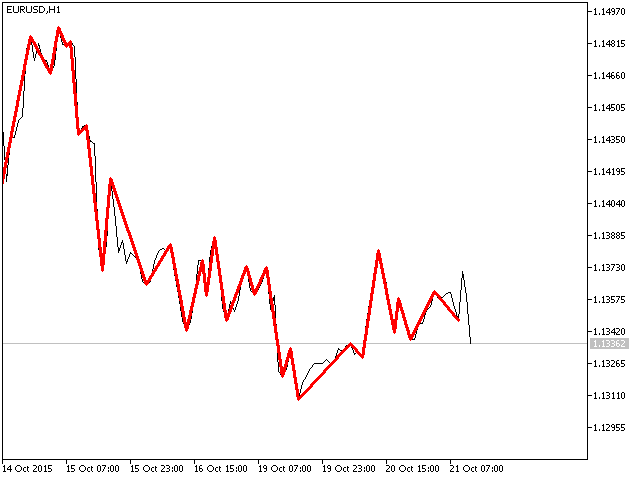
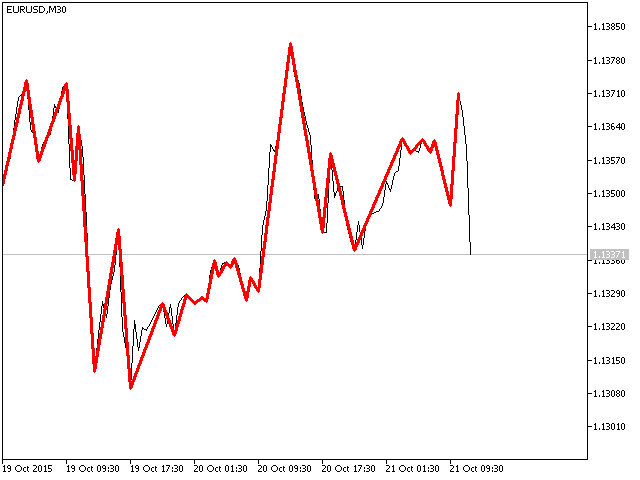
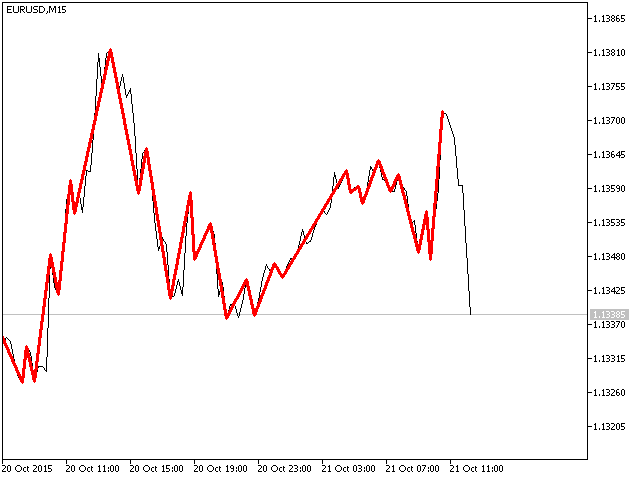
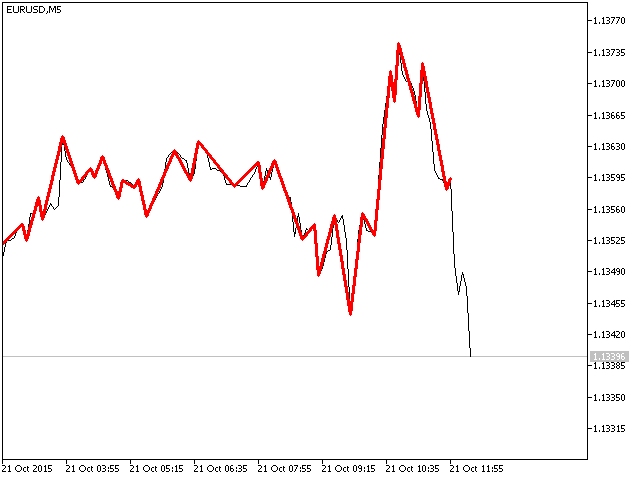
The indicator is based on the two-buffer scheme and does not require any additional settings. It can be used on any financial instrument without any restrictions. The indicator is a known ZigZag, but it does not redraw. The indicator allows to easily detect significant levels on the price chart, as well as demonstrates the ability to determine the probable direction of a price movement. The calculations are based on the candles' Close prices, thus improving the reliability of the levels.
Parameter
- MinBars – amount of calculated bars, the default is 500. If 0, calculation is performed on the entire available history.
Constructive suggestions and feedback are highly appreciated.

Der Benutzer hat keinen Kommentar hinterlassen