EMA Trend Histogram
- Indikatoren
- Nils R M Peleman
- Version: 1.1
- Aktualisiert: 3 Oktober 2024
Detailed Description:
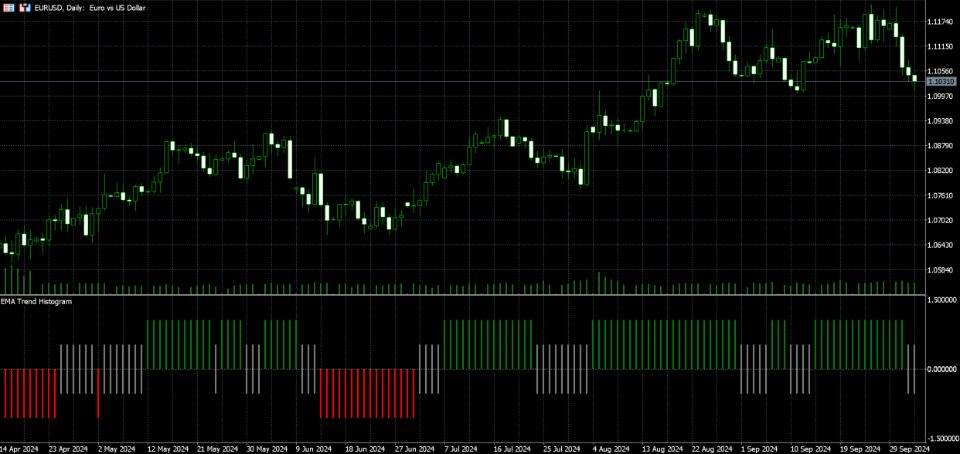
The EMA Trend Histogram Indicator is a powerful tool for traders seeking clear trend identification based on the widely-used Exponential Moving Averages (EMAs).This indicator provides an easy-to-interpret histogram and helps you simplify trend identification by using the 50 EMA and 200 EMA on two crucial timeframes: H1 and H4. By observing the relationship between short-term and long-term EMAs on multiple timeframes, this indicator provides a quick and clear view of market direction:
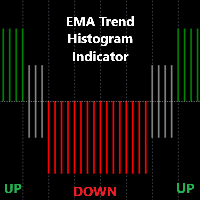
- Uptrend: The 50 EMA is above the 200 EMA on both timeframes, indicated by green histogram bars.
- Downtrend: The 50 EMA is below the 200 EMA on both timeframes, indicated by red histogram bars.
- Neutral: No clear trend, marked by gray bars.
The intuitive design makes it easy for you to gauge the strength of a trend, enabling more informed decisions.
Key Features:
- Uses 50-period and 200-period EMAs for trend detection on two crucial timeframes: H1 and H4.
- Color-coded histogram: Green (uptrend), Red (downtrend), Gray (neutral).
- Customizable input parameters (EMA periods and bars to process).
- Works in a separate window, allowing for clutter-free charting.
Customizable Input Parameters:
- EMA Short Period (Default = 50): Adjust the short-term EMA based on your trading strategy.
- EMA Long Period (Default = 200): Adjust the long-term EMA based on your trading strategy.
- Bars to Process (Default = 1000): Set the number of historical bars for the indicator to calculate, controlling the data used for trend analysis and histogram responsiveness.
These settings allow for personalized optimization based on market conditions and trading preferences.
Benefits:
- Clear Trend Direction: Instantly see the overall market trend using a simple, color-coded histogram.
- Multi-timeframe Analysis: Combines insights from H1 and H4 timeframes for more robust trend identification.
- Easy to Use: Ideal for both beginners and advanced traders looking for a trend-following strategy.
Recommendations:
For optimal results, use the EMA Trend Histogram alongside other tools such as support and resistance levels, or oscillators, to confirm your analysis
Support:
If you have any recommendations, require assistance, or have questions regarding the EMA Trend Histogram Indicator, please feel free to reach out!


