• Übersicht
  • Bewertungen
  • Diskussion

Asi roc oscillator

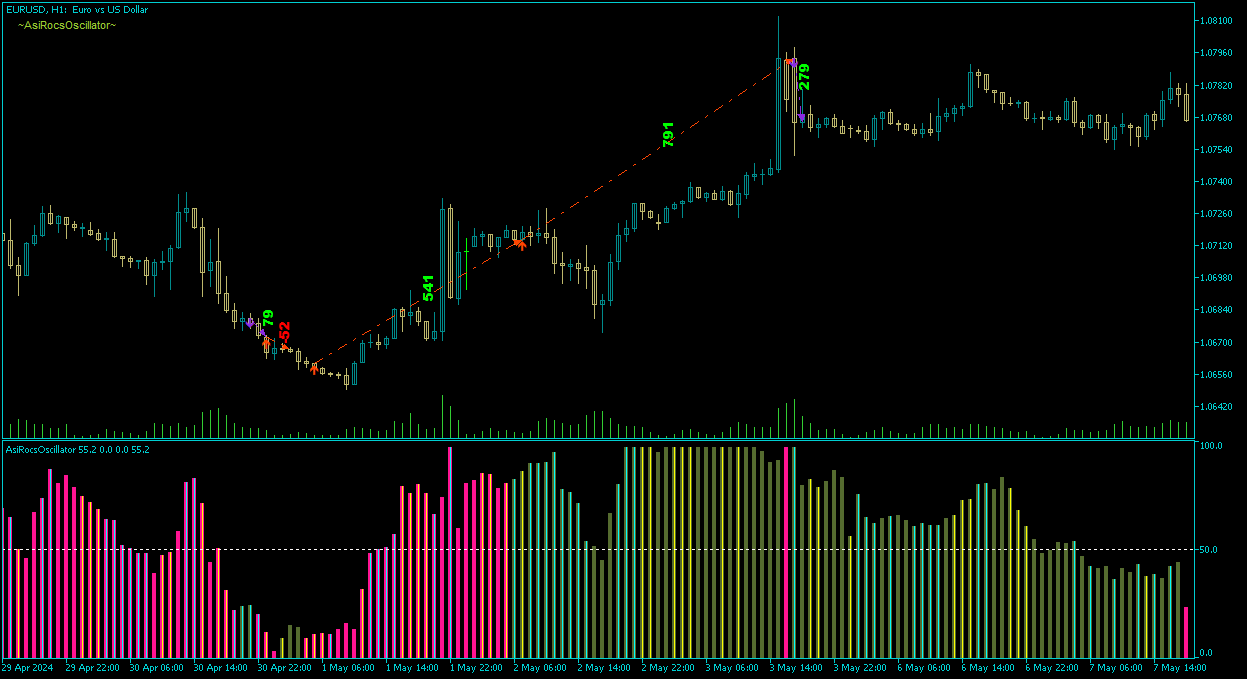
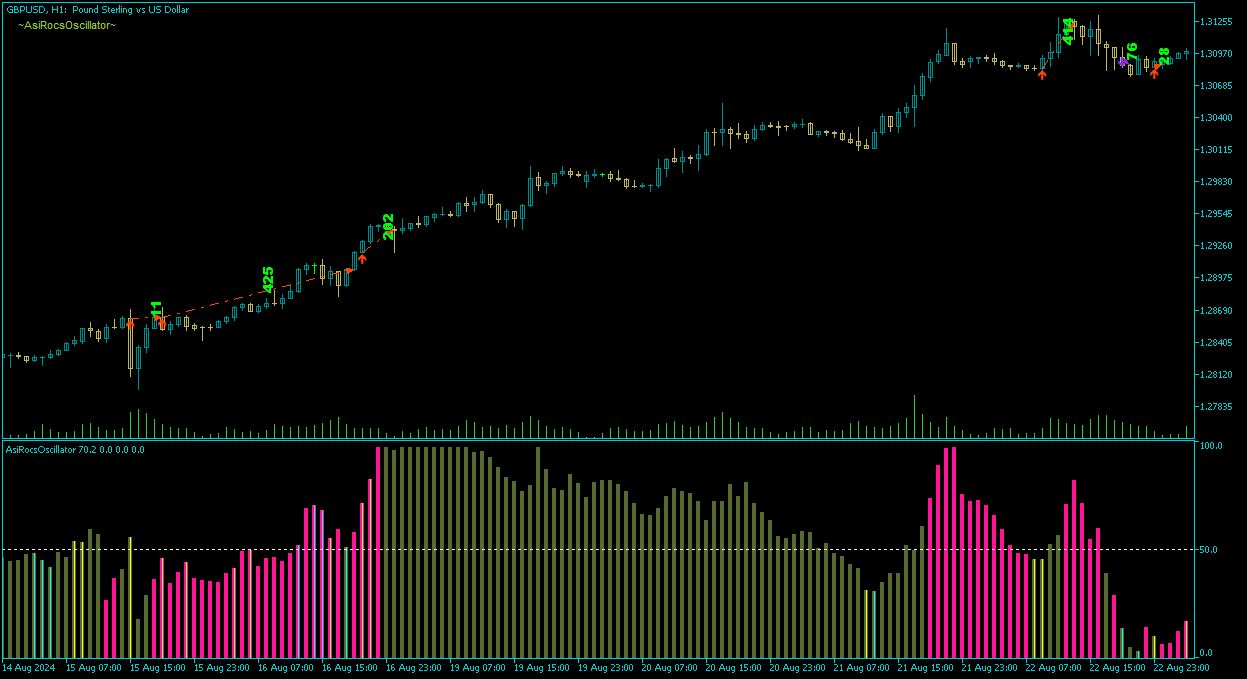
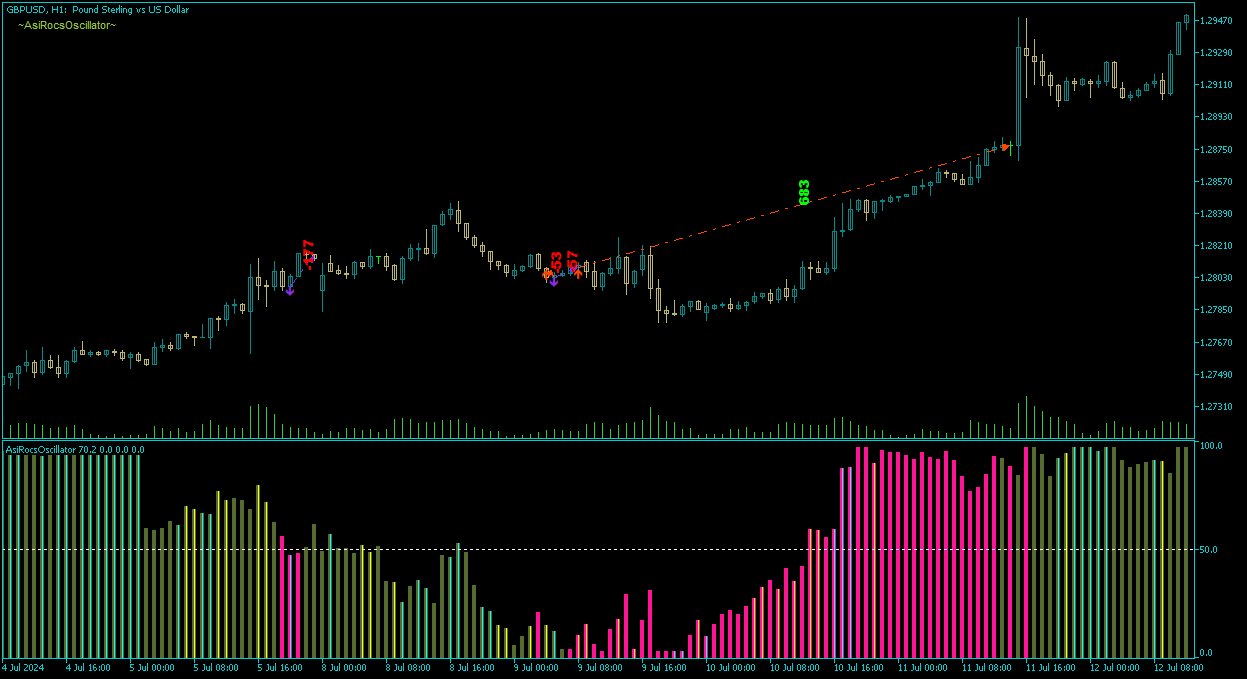
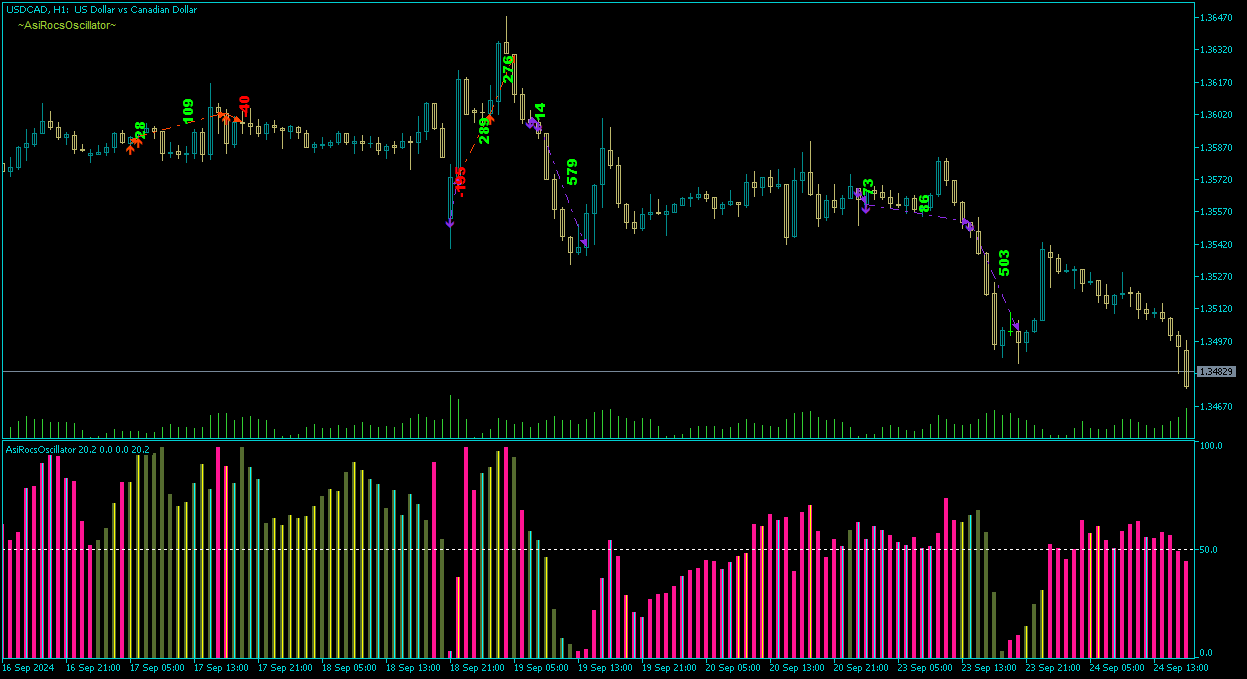
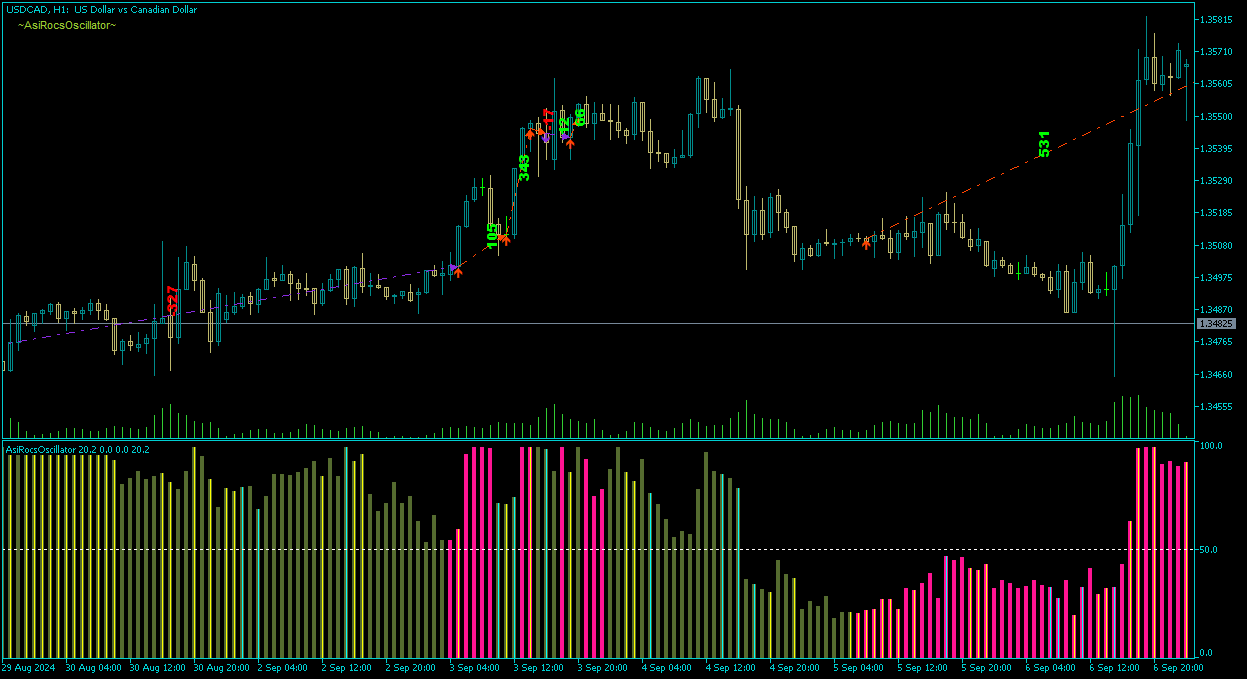
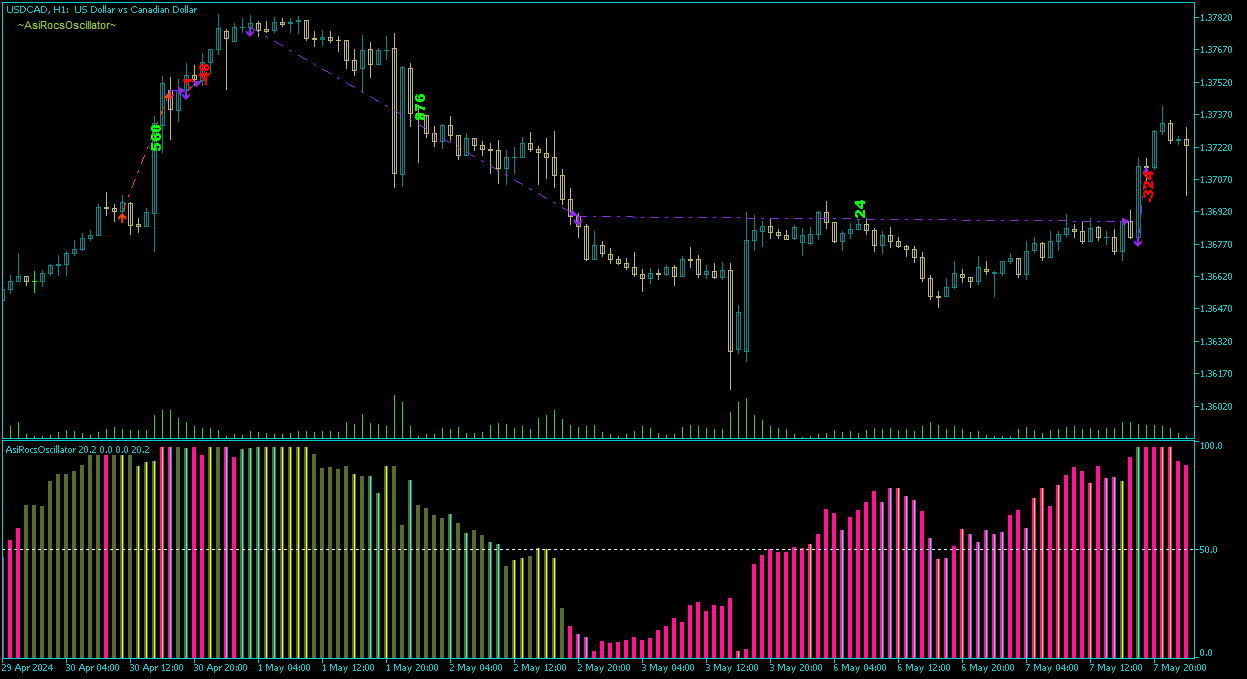
Introducing the innovative AsiRocsOscillator  — your reliable guide in the world of financial markets! Combining the power and accuracy of an oscillator with the speed of reaction for early signals, but confirmed by session close, AsiRocsOscillator offers unique opportunities for traders of any level.

AsiRocsOscillator key features:
  • Multilevel market analysis: analyzes all price fluctuations, gaining access to a complete picture of the market.
  • Accurate assessment of strength and direction: provides a clear understanding of the real strength and direction of the market.
  • Trend recognition: automatically determines current lines for effective position management.
  • Identification of key points: quickly identifies turning points of short-term fluctuations, helping to anticipate possible trend changes.
  • Excellent overbought/oversold indicator: effectively signals possible entry and exit points, reducing risks and increasing your confidence in decision-making.
  • Easy to use: the interface is intuitive and user-friendly, facilitating data analysis and strategy planning.
  • Integration with other tools / support for traditional methods: allows you to apply classic technical analysis tools, such as support and resistance lines, for in-depth study of market conditions, as well as detecting overbought and oversold conditions: extreme values of the oscillator can indicate the state of overbought or oversold market, which is an important signal for opening or closing positions.
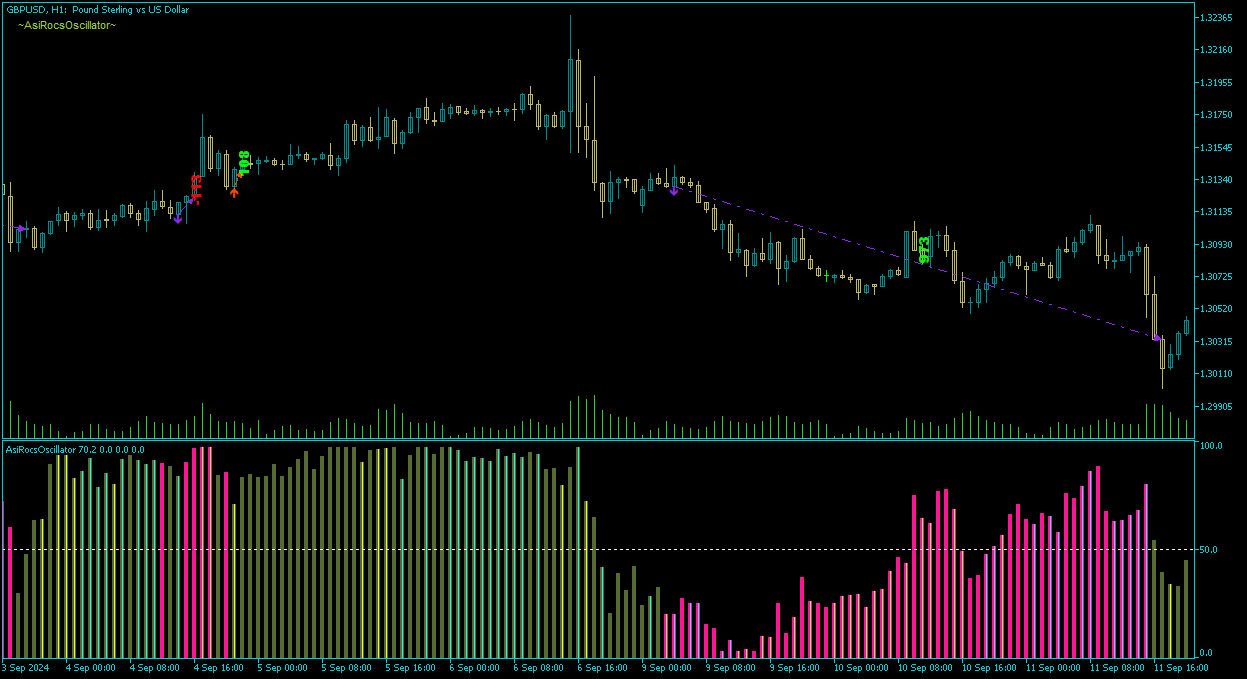
  • Individual approach: you can choose your favorite trading instrument from 3 options(EURUSD H1,GBPUSD H1,USDCAD H1) , each of which will provide the optimal trading strategy for the corresponding instrument.
  • Waits for confirmation of signals at the close of the timeframe for maximum accuracy and resistance to market fluctuations.
  • Aimed at minimizing trading risks, seeks to reduce capital drawdown to a minimum.
Thousands of professionals around the world have already chosen AsiRocsOscillator, due to its ability to significantly improve trading efficiency and minimize risks. 


Empfohlene Produkte
Asi rocs robot
Ekaterina Saltykova
Introducing the innovative AsiRoc Robot  — your reliable guide in the world of financial markets! Combining the power and accuracy of an oscillator with the speed of reaction for early signals, but confirmed by session close, AsiRocsRobot offers unique opportunities for traders of any level. AsiRocsRobot key features: Multilevel market analysis: analyzes all price fluctuations, gaining access to a complete picture of the market. Accurate assessment of strength and direction: provides a clear un
Balance Weighted Moving Hedge System- is the trend following manual system for forex/crypto market. Indicator represents custom balance-weighted moving average indicator. The main advantagies : very stable moving with really early signals, defines current trend power, ignores market noise. The more width of indicator line - the more expressive trend is. On the other hand thin moving line shows unstable / choppy market. Indicator can be used as single b alance weighted moving or with hedge strate
Limitless MT5
Dmitriy Kashevich
Limitless MT5 is a universal indicator suitable for every beginner and experienced trader. works on all currency pairs, cryptocurrencies, raw stocks Limitless MT5 - already configured and does not require additional configuration And now the main thing Why Limitless MT5? 1 complete lack of redrawing 2 two years of testing by the best specialists in trading 3 the accuracy of correct signals exceeds 80% 4 performed well in trading during news releases Trading rules 1 buy signa
INDIKATOR basierend auf KÜNSTLICHER INTELLIGENZ, der mögliche Call- und Put-Eingaben für binäre Optionen generiert. Der Indikator funktioniert nach drei verschiedenen Strategien: 1) Durch das Ablesen der Volumina wird ein Signal gesendet, wann sich der Preis umkehren sollte 2) Durch die Divergenz zwischen Preis und Volumen sendet es ein Signal, wann sich der Trend fortsetzen oder umkehren sollte 3) Durch die Konvergenz zwischen Preis und Volumen sendet es ein Signal, wann sich der Trend
Gold Paladin MT5 releases version 2.9, which is loaded with a real virtual stop loss module and all adopts Apocalypse's technology, such as dynamic FuHeZhi technology.Old customers who have purchased the MT4 version can switch to the MT5 version for $50, please contact me.        Because of the war, the fluctuation pattern of XAUUSD was affected, and it also affected EA.but I am still there.I believe in my EA and will continue to invest and stick to it.Today, the crucial version 2.9 has
Tools zum Verdienen und Forschen. Der Kern der Handelssignale und -strategie basiert auf dem Algorithmus des Autors zur Bildung von Preisprognosemustern. Für jedes Instrument anwendbar! Ergänzt um ein Kontrollsystem basierend auf dem MA "Nine-Tailed Fox" , das das Signal so genau wie möglich für den Markt, das Instrument und den Arbeitszeitraum aktualisiert und anpasst. Zugelassen: Alle Instrumente in allen Märkten (es gibt Ausnahmen). Für wen: Hedgefonds, Fonds- und Vermögensverwalter, Anlag
OrionMT5
Evgeniy Zhdan
The algorithm of the adviser calculates zones of consolidation of the price and the most tentative variants of price movements. Due to the unique method of determining candlestick patterns in the near past, a trade expert adapts to changing market conditions with minimal delay. This allows you to trust the adviser to work offline for quite a long time without the need for frequent monitoring. The Expert Advisor was developed in the conditions of "floating" delay in the execution of trade ord
Sun
Arthur Hatchiguian
3.72 (29)
Sun ist ein aggressiver Multi-Cycle-Scalper, der für EURUSD M1 entwickelt wurde. Jeder Zyklus ist unabhängig. Er verwendet eine Sequenz von Aufträgen und hat seinen eigenen TP und SL. Er verwendet ein Martingale-System. Dieser EA nutzt starke Wiederholungen der Vergangenheit, um eine Position einzunehmen und eine hohe Erfolgsrate zu erzielen. Es ist sehr wichtig, den Blogbeitrag zu lesen, bevor Sie beginnen. Die Mindesteinlage beträgt $100 bei einer Hebelwirkung von 1:500. Ein Autolot-System
Glider
Vitalii Zakharuk
The Glider indicator gives accurate and timely signals to enter and exit the transaction that appear on the current candle. Using the indicator is very simple. When a dot and a blue line appear, open a buy deal. When a dot and a red line appear, open a sell deal. The main purpose of this indicator is to determine the moments of entry and exit from transactions, therefore the Glider indicator will display only the trend line and entry points, i.e. displays displays the entry points to the mark
Dieser auf künstlicher Intelligenz basierende Indikator identifiziert mögliche Marktumkehrpunkte durch Auslesen des Fußabdrucks und signalisiert im Voraus kleine Marktbewegungen, bevor sie auftreten. Im Gegensatz zu Preis- und Volumenindikatoren, die „späte“ Einträge generieren, d. h. wenn bei einer Richtungsänderung bereits eine Bestätigung des Preises oder Volumens erfolgt ist und die Bewegung daher oft bereits beendet ist, signalisiert dieser Indikator basierend auf dem, was er in der Tabell
Smooth price for Monarch
Konstantin Gruzdev
5 (1)
The Smooth Price technical indicator is used for plotting a smoothed line as close to the price of the financial instrument as possible, and serves to eliminate its noise components. The indicator is part of the Monarch trading system, but here it is presented as an independent technical analysis tool. The indicator is based on the cluster digital filter , which, unlike the ClusterSMA , is applied directly to the price time series. Smooth Price does not redraw (except the very last, zero bar) an
Eazy Indicator
Isaac Agyei Poku
Forex BUY and SELL signals from the best Heiken Ashi Smoothed indicator. Draw bullish/bearish bars on the chart. Accurate trend detector. Heiken Ashi Smoothed is a simple MT5 indicator that draws bullish and bearish bars in the chart to reflect the direction of the trend. The indicator consists of orange bearish bars and green bullish bars. When the trend changes its direction, the indicator changes its color. The indicator is a modernization of the traditional Heiken Ashi indicator. Moving Aver
Der Indikator verfolgt den Trend in 5 verschiedenen Chartzeiten für dasselbe Asset, basierend auf 6 Signalen für jede Chartzeit. Das Hauptziel des Indikators besteht darin, uns den Mehrheitstrend des finanziellen Vermögenswerts zu zeigen, in den er platziert wurde. Das System überträgt die Informationen der Trends in mehreren grafischen Zeiten. Auf diese Weise hat der Benutzer einen umfassenden Überblick über die Bewegung des Assets. Diese Art von Tool ermöglicht dem Benutzer eine höhere Tre
Navigator FX mt5
Tatiana Savkevych
2 (1)
Navigator FX: Your reliable guide to the Forex market Navigator FX is an advanced trading bot designed for Forex traders. This innovative tool has a wide range of features that allow traders to effectively manage their trades and strategies. The price for the first user will be low, and it will increase in the future. Advantages of Navigator FX: Reliability and Stability: Navigator FX is designed to the highest standards of reliability and stability. Intelligent Risk Management: Built-i
Big Player Range
Thalles Nascimento De Carvalho
5 (2)
Entdecken Sie die Kraft von "BigPlayerRange": Ihr Verbündeter in der technischen Marktanalyse Wir stellen Ihnen BigPlayerRange vor, ein fortschrittliches Werkzeug für die technische Analyse, das entwickelt wurde, um die Interessenbereiche institutioneller Anleger auf dem Markt aufzudecken. Mit diesem Tool können Sie präzise identifizieren, wo die Hauptakteure aktiv sind und wie sich dies auf Ihre Handelsstrategien auswirken kann. Hauptmerkmale: Kartierung von Interessenbereichen institution
This indicator works on atr with some edited . The AI ​​MACD FILTER indicator is used for confirmation. Certainly, the indicator contains an alert when the signal appears, and you use the exit of the deal on the saturation that occurs at the AI ​​MACD. The accuracy of the work is high on gold, the time frame is five minutes, while staying away from trading at the time of news that occurs on the US dollar. And using high liquidity trading times, which are two hours before the opening of the Lo
Introduction to Fractal Pattern Scanner Fractal Indicator refers to the technical indicator that makes use of the fractal geometry found in the financial market. Fractal Pattern Scanner is the advanced Fractal Indicator that brings the latest trading technology after the extensive research and development work in the fractal geometry in the financial market. The most important feature in Fractal Pattern Scanner is the ability to measure the turning point probability as well as the trend probabil
"Dragon's Tail" is an integrated trading system, not just an indicator. This system analyzes each candle on a minute-by-minute basis, which is particularly effective in high market volatility conditions. The "Dragon's Tail" system identifies key market moments referred to as "bull and bear battles". Based on these "battles", the system gives trade direction recommendations. In the case of an arrow appearing on the chart, this signals the possibility of opening two trades in the indicated directi
QXS Market Scanner
Netlux Digital Kft.
QuantXMarketScanner is a multi assets indicator for MT5 - Mathematical model based on 7 custom moving averages indicators  - Adaptable on Currencies, Stocks and Crypto - Automatic setup, self optimized About QuantXsystem Products: –         Simple installation & integration into MT5   –         Unlimited License after purchase (for one user) –         Automatic pattern recognition to identify the best timing and price levels. –         Trading indicators are displayed directly and automatica
Trend indicator, a revolutionary unique solution for trend trading and filtering with all important trend features built into one tool! This is a 100% non-repainting multi-timeframe and multi-currency indicator that can be used on all currency pairs. HandleTrend is an effective trend following indicator that gives trend signals in the form of arrows on the chart.
Fibonacci Multiple 12
Cesar Juan Flores Navarro
Fibonacci Múltiple 12, utiliza la serie fibonacci plasmado en el indicador fibonacci, aumentadolo 12 veces según su secuencia. El indicador fibonacci normalmente muestra una vez, el presente indicador se mostrara 12 veces empezando el numero que le indique siguiendo la secuencia. Se puede utilizar para ver la tendencia en periodos cortos y largos, de minutos a meses, solo aumentado el numero MULTIPLICA.
Bird Onixx
Yvan Musatov
Professional expert   Bird Onix   analyzes the market using a special algorithm. The basic principle is that the bot takes the specified prices for a certain period of time and calculates the strength and amplitude of the price by comparing it with its own indication system based on actual data. The moment when the trend loses strength and reverses is recorded, and then the previous series is closed and a new one is prepared. The bot also analyzes its own overbought/oversold signals in its algo
GoldHFT MT5
Aldo Marco Ronchese
On special price till the end of the month . High Frequency Trader for Gold ! Meaning this EA can trade many times in a second to take advantage of news and fast movements while waiting patiently in slow markets for tiny moves to take advantage of . Only the best will do and you have found a hidden gem. Introducing the future of XAUUSD trading: EA Gold HFT   The AI-powered expert advisor that learns and adapts to the market EA Gold HFT is a revolutionary new trading tool that uses artificial in
Классификатор силы тренда. Показания на истории не меняет. Изменяется классификация только незакрытого бара. По идее подобен полной системе ASCTrend, сигнальный модуль которой, точнее его аппроксимация в несколько "урезанном" виде, есть в свободном доступе, а также в терминале как сигнальный индикатор SilverTrend . Точной копией системы ASCTrend не является. Работает на всех инструментах и всех временных диапазонах. Индикатор использует несколько некоррелируемых между собой алгоритмов для класси
This indicator is based on a mathematical formula which gives you the possibility to seek and find the right frequency of the movement, and to determine its key level; just adjust the frequency parameter! Simple and highly effective; using this indicator you can easily predict the next support and  resistance    levels of the day. Also, this indicator determines the range and the next two importants levels of the movement outside this range so far. SGFL3 and RGFL3  are levels with high certainty
Price Action Scanner is an indicator that identifies price behaviors and provides alerts. This indicator can simultaneously detect signals for up to 6 different symbols across various timeframes. By setting a separator, you can add different symbol names and timeframes. The indicator can detect multiple common signal types such as Pinbar, Engulfing Pattern, Inside Bar, Morning Star, Evening Star, Fakey, and display corresponding information in separate subcharts, indicating the direction of t
This EA does not use any indicators, but calculates the entry and exit points based on market volatility. The greater the market volatility, the more profit there is. The EA each trade includes a stop loss. From backtesting, this strategy has proven to be very successful. This EA is suitable for any trading instrument, and all internal parameters of the EA are open for adjustment to fit other instruments. The EA does not employ high-risk strategies like Martingale or grid trading, nor does it in
Considering the main theories of Forex (Dow Theory, support lines, chart patterns, and Fibonacci retracements), It tells you the price range where whales (large investors) are likely to appear. You can trade at the price points that professionals also aim for. You no longer have to warry about where to aim next. We are live-streaming the actual operation of the system. Please check for yourself if it is usable. Please check it out for yourself. https://www.youtube.com/@ganesha_forex We do n
TREND HARMONY MT5 – Multi Timeframe Trend and Phase and Pullback Level Visualizer indicator for Metatrader5 The TREND HARMONY indicator automates deep trend analysis and generates visualizations for you. Take control of your trades by eliminating uncertainty! Revolutionize your trading experience with precision and insight through the TREND HARMONY Multi Timeframe indicator – your ultimate MT5 trend visualization indicator. [  Features and Manual   | MT4 version |   All Products   ] Are you t
PipFinite Exit EDGE MT5
Karlo Wilson Vendiola
4.86 (29)
Did You Have A Profitable Trade But Suddenly Reversed? In a solid strategy, exiting a trade is equally important as entering. Exit EDGE helps maximize your current trade profit and avoid turning winning trades to losers. Never Miss An Exit Signal Again Monitor all pairs and timeframes in just 1 chart www.mql5.com/en/blogs/post/726558 How To Trade You can close your open trades as soon as you receive a signal Close your Buy orders if you receive an Exit Buy Signal. Close your Sell orde
Käufer dieses Produkts erwarben auch
IVISTscalp5
Vadym Zhukovskyi
5 (5)
Wir stellen Ihnen den iVISTscalp5-Indikator vor, der nicht nur einzigartig, sondern auch effektiv im Handel ist. Dieser Indikator basiert auf Zeitdaten und ist das Ergebnis jahrelanger Erfahrung und eingehender Analyse der Finanzmärkte. Der iVISTscalp5-Indikator ist ein ausgezeichnetes Werkzeug für manuellen Handel. Bequemlichkeit, Einfachheit und Visualisierung - die gesamte Komplexität ist verborgen. Wir haben die Einstellungen und Verwendung des iVISTscalp5-Indikators auf das Maximum vereinfa
Pendiente de Precio
Cesar Juan Flores Navarro
Indicador en base a la pendiente de la linea de precio, dibuja una línea de color cuando sube a base de los precios que previamente has sido procesados o linealizados, y cuando baja la pendiente la linea linealizada toma otro color. En este caso se a considerado 6 lineas de diferentes procesos desde pendientes largas hacia las cortas, observándose que cuando coincidan las pendientes se produce un máximo o mínimo, lo que a simple vista nos permitirá hacer una COMPRA O VENTA.
WanaScalper
Isaac Wanasolo
1 (1)
A scalping indicator based on mathematical patterns, which on average gives signals with relatively small SL, and also occasionally helps to catch big moves in the markets (more information in the video) This indicator has three main types of notifications: The first type warns of a possible/upcoming signal on the next bar The second type indicates the presence of a ready signal to enter the market/open a position The third type is for SL and TP levels - you will be notified every time price r
Recommended TimeFrame >= H1. 100% Non Repainted at any moment.  Use it carefully, only with Trend Direction. Trading Usage: 2 Variants: as Range System or as BreakOut System (Both Only With Trend Direction)::: (Always use StopLoss for minimise Risk); [1] as Range System: (Recommended) in UP TREND:  - BUY in Blue Line , then if price goes down by 50 points (on H1) open Second BUY.   Close in any Profit you wish: TrailingStop(45 points) or Close when Price touches upper Gold Line. in DOWN TR
En base a cálculos matemáticos de determino una linea Horizontal que cruza a todas las señales de trading, mostrando los máximos y mínimos. La linea horizontal parte en dos las subidas y bajadas de las señales de trading, de tan manera que es fácil identificar los máximos y mínimos, y es inteligente por que es sensible a las subidas y bajadas, afín de no quedarse en un solo lado por siempre, trabaja excelentemente con otros indicadores suavizadores ya que les garantiza que en un intervalo de tie
Spike Detector
Tete Adate Adjete
dieser Indikator ist ein Spike-Detektor-Indikator, es wurde speziell für den Handel mit Boom 1000, Boom 500, Crash 1000 und Crash 500 entwickelt Wir empfehlen, es nur für Derivat Boom- und Crash-Indizes zu verwenden Die Einstellung ist intuitiv, vertraut und einfach zu bedienen es hat Benachrichtigungsfunktionen; akustische Benachrichtigungen und Push-Benachrichtigungen. Dieses Tool ist einfach zu bedienen, einfach zu handhaben Dieses Update basiert auf verschiedenen Strategien für
Escalera Inteligente
Cesar Juan Flores Navarro
Indicador en MQL5, recibe la información del precio SUAVIZADO, lo procesa anulando los picos inteligentemente, y el resultado lo envía al desarrollo de la escalera que iniciara y subirá o bajara según el peldaño o INTERVALO ingresado Ingreso PERIODO = 50 (variar segun uso) Ingreso MULTIPLICA AL PERIODO = 1 (variar segun uso) Segun la configuración la escalera puede pegarse o separarse de los precios,, Se aplica toda la linea de tiempo, y a todas las divisas, etc.  
Fibonacci Suavizado
Cesar Juan Flores Navarro
Indicador en MQL5, que obtiene el promedio de 10 EMAS, que son alineadas según Fibonacci, obteniendo un promedio, que sera suavizado.  Se puede ingresar un numero desde 2 a N, que multiplica a los EMA-Fibonacci. Funciona en cualquier criptomoneda, etc. etc... pudiendo calcular el futuro segun la tendencia de las EMAS. Funciona excelentemente en tramos largos, determinando exactamente el mejor inicio/salida. El precio inicial por apertura sera por un periodo de tiempo, luego aumentará.
Seconds Charts
Aleksandr Goryachev
Micro  ******************* Секундные графики MT5 ********************** Более точного инструмента для входа в сделку вы не найдёте. Входные параметры: Timeframe, sek - период построения графика, секунды Displayed bars - отображаемые бары Step of price levels, pp, 0-off - шаг отрисовки ценовых уровней, пункты Scale points per bar, 0-off - масштаб в пунктах на бар Show lines - отображение текущих уровней Show comment - отображение комментария Standard color scheme - стандартная цветовая сх
Super Suavizador
Cesar Juan Flores Navarro
Indicador en MQL5 que obtiene el promedio de 10 EMAS que son alineadas y procesadas según Fibonacci luego el promedio es suavizado"  Se ingresa un número de 2 a N que multiplica los EMA-Fibonacci y por consiguiente aumenta los fibonacci, resultando un promedio.   Se ingresa un número que suaviza los EMA-Fibonacci. Considerando los números 1/1 seria la suavización minima. Considerando los números 3/5 seria la suavización media. Considerando los números 10/30 seria la suavización alta.....etc
Trend and Signals MT5  indicator scans  30 trading Instruments (Forex, Metals and Indices).     It uses special algorithm on the  current market   based on   Pure Price Action   and display the overall trend and signal on the dashboard. When signals are produced the indicator sends alert and notification. Strategy for Signals This indicator uses the daily timeframe to determine the direction of the trend. The hourly timeframe is used to identify possible entries. Main trend and is determined by
Cycles Forecast
Pooriya Alirezaee
This indicator is based on a mathematical formula and an ANN combined, designed to make a model(using previous prices) of the most recent market condition (any chart*) in order to use the model as a forecasting tool. *This indicator can operate on any chart/timeframe, but it's suggested you use multiple timeframes for each trade because this method relies solely on the time factor, you can not use this indicator to predict price volatility, but if it's fit correctly it will show you when the nex
This indicator is based on the crossing of two Moving Average with the RSI It is intended for scalpers Specially designed for Boom and Crash syhtetic indices from Binary.com/Deriv.com It is easy to use and intuitive. We recommend its use on M1 and is equipped with three types of notification Email alert Sound notification Push notification these parameters can be activated and deactivated.
Regression Channel Tools" basiert. Durch die Nutzung dieses Tools können Trader eine außergewöhnliche Kontrolle über ihren Chart-Regression-Kanal erlangen und fundiertere Handelsentscheidungen treffen. Das Regression Channel Tool ist ein leistungsstarkes Instrument im Werkzeugkasten eines Traders. Es soll wertvolle Einblicke in Preisentwicklungen und potenzielle Unterstützungs- und Widerstandsniveaus bieten. Das Tool eignet sich besonders gut zur Visualisierung von Korrekturwellen innerhalb eine
Use with JUMP 25. However it can can with the volatility indices as well because it is a modified version. It is advisable to use create a healthy account management. Measure your risk and happy trading. Other experts to be loaded soon. These are modified in order to optimise profits. Ideal candidates are high risk, high returns individuals who hold trades at a maximum of 1 - 2 hours
This indicator is a scalping indicator intended solely for the Boom and Crash indices of the Deriv Limited market It supports Boom 500, Boom 1000, Crash 500 and Crash 1000 Not repaint and no bug The settings are intuitive and easy to use The product activation number is 20 The Time Frame used depends on the user If you are an aggressive scalper then just use M1 For long trades use M15 If you are conservative use M5 Please contact me for more details of its use
RadioMedia
Cesar Juan Flores Navarro
Indicador de MQL5 basado en 3 EMAs, en función del precio. El precio influye en las EMAs, de tal forma que los Máximos y Mínimos solo la alteran minimamente, este influjo lo llame radio. Considerando la influencia del radio como constante, por lo que no tiene valores de entrada. Ideal para todas las criptomonedas. Funciona en todos los tiempos. Se sugiere operar cuando el precio este abajo y en bajada.... o cuando el precio este encima y en subida.
El Super Suavizador Inteligente es la culminación de la evolución de los suavizadores en funcion del precio, funciona en todos los pares de divisas, es fácil de usar, y puedes usarlo varias veces en un mismo par, afin de darte una idea de hacia donde va el precio, muy util para ver la tendencia a largo plazo. El SSI trata siempre de formar ondas de subidas y bajadas a fin de poder mostrar el máximo y/o mínimo de la tendencia del precio.
Aliens dougkang de moviles
Cesar Juan Flores Navarro
Tomamos 5 medios móviles las unimos en una la cual suavizamos y volvemos a suavizar, resultando un mega suavizador de medios móviles suavizadas. Indicador de mql5 funciona en cualquier broker y para todos los tiempos, siendo el mas optimo el de 5, 15 a mas. Funciona mejor en grupo consigo misma osea poner uno de 14 y otro de 50 y 400,, así se observa mejor su desempeño.
AIS MT5 INDICATOR 5 ALL INCLLUSIVE SET GUIDE CHAPTER 1  IMPORTANT INFORMATION <1> THIS INDICATOR IS ONE OF THE SERIES OF NEW AIS INDICATORS AIS MT5 INDICATOR 1 =ADVANCED CLASSIC= AIS MT5 INDICATOR 2 =MULTIFRAMES= AIS MT5 INDICATOR 3 =LINES= AIS MT5 INDICATOR 4 =MARKET PROFILES= AIS MT5 INDICATOR 5 =ALL INCLUSIVE SET CHAPTER 2 GENERAL FEATURES OF THE SERIES <1> AIS MT5 INDICATOR 1 =ADVANCED CLASSIC= < DEVELOPMENT PAUSED >     DISPLAYS MAIN TIME POINTS AND PRICE LEVELS OF THE CHART     
ForexAndCryptoTradeTool
Gabriel Ferreira Da Silva
Quantitative analysis software, this indicator came from another country and thanks to my network today I can share this software with you! Russian Tool plots arrows on your asset, indicating the trend the asset will enter, easy to use and easy to install indicator We have been working with robots and indicators since 2018! We came to MQL5 to be able to bring better benefits at the time of payment by our customers!, our Instagram where we post daily stories of operations: https://www.inst
Zwölf künstliche neuronale Netze, aufgeteilt in vier Ensembles versuchen, die Richtung der Preisbewegung in der Zukunft vorherzusagen: klein: 1 Minute, mittel: 5 Minuten, groß: 30 Minuten, Königlich: 15 Minuten. Dieser Indikator für den aktiven Hochfrequenzhandel ist einsatzbereit ein EA, der separat gestartet wird und Signale vom Indikator in Form von globalen Variablen empfängt, die vom Indikator veröffentlicht werden. Dieser Indikator funktioniert nicht im Strategietester, also schauen Sie s
Recuroid
Andriy Sydoruk
The Recuroid indicator shows very good entry points. Just look at the screenshots, then download the free version and look in the strategy tester and see for yourself. The system is based on two key algorithms. The first algorithm (managed) creates a system of balanced transition from the buy zone to the sell zone and vice versa, draws arrows and lines, and forms entries. The second algorithm (managing) corrects the initial data for the first algorithm (managed) by measuring virtual windows,
Live-Übertragung des Indikators auf YouTube. Bitte klicken Sie auf den Link unten, um mehr Glaubwürdigkeit zu erhalten. Es gibt auch Videos des Indikators, die Sie sich ansehen können. Beachten Sie, dass die Übertragung spät ist, verlassen Sie sich nicht darauf. Nur eine Überprüfung des Indikators ist nur eine Überprüfung der Genauigkeit des Indikators, der fast nicht verliert und die Gewinnrate 95% erreicht Ich werde mit großer Genauigkeit an der CRASH-Münze 1000 INDICES arbeiten
MMM Gold Sniper MT5
Gilang Wardhana Purnama Putra
Indicator is based on   Market Maker Strategy.   NO REPAINT. MM's are traders and their objective is to make money.  This includes strategies to trade against retails traders.  The major difference between them and other traders is that they have the ability, through access to massive volumes, to move price at their will.  So to make money, they aim to buy at a lower price and then sell at a higher price. They achieve this by:  1. Inducing traders to take positions. This is achieved by using a
Volume Confluence
Mussadiq Abdul Rahim
Achtung! Bevor Sie unser Produkt verwenden, lesen Sie bitte sorgfältig den Haftungsausschluss auf Englisch durch. Unser Produkt ist dafür konzipiert, Informationen über mögliche Markttrends und Preisbewegungen bereitzustellen. Es kann jedoch keine Garantie für Gewinne oder bestimmte Handelsergebnisse gegeben werden. Der Handel an den Finanzmärkten birgt Risiken und wir übernehmen keine Verantwortung für mögliche Verluste. Weitere Informationen finden Sie im englischen Haftungsausschluss.
The indicator is a gold mine that works with the MACDI strategy with alert supported by AI it working on gold 5m time frame with 92% win the stratige take 15 pip tp and 15 stop 1:1 follow us on telegram : t.me/tuq98 youtube : youtube.com/ssfx1 green color its buy with alert red color its sell with alert this indicator is one from top 10 in greece and one from top 5 in iraq
Entry Pro
Bartlomiej Tadeusz Tomaja
Entry Pro Indicator is a powerful multi-functional trading tool designed to increase your market entry accuracy. It combines the power of several key market trend indicators, including ATR Trailing Stop and both fast and slow EMA, to provide comprehensive market insight. It offers easy-to-interpret market entry signals represented by colored arrows. Also, it's fully customizable, allowing you to adjust ATR and EMA periods to suit your trading strategy. Trend filters and alerts can be toggled on
Make Sure to Read the Description! UT Bot Plus contains free EA! The EA can be downloaded from telegram channel:  https://t.me/ +NSOJTvH39fNhZmU0 Unlock the Power of Automated Trading with UT BOT Indicator, Integrated with a FREE EA! ( Limited time offer ) This version has been expanded to include multiple additional filtering options. These options are fully configurable and can be switched on and off. This versatile UT BOT indicator is crafted and optimized to work seamlessly with the
Hello I Want to introduce The Forex Buy Sell Arrow Premium MT5 i recently release this premium indicator! its 1000% Non Repaint Indicator, It Work Perfectly Well,, i tested it day by day, Just mind blowing Result,  Including Powerful trend Algorithm! How It Work? well, it work market trend formula, when trend Bullish Or when trend Bearish,  Recommend Timeframe M30, H1 it work all timeframe, and all currency pair, 100% non repaint, How to take signal From Forex Buy Sell Arr
Weitere Produkte dieses Autors
Noize Absorption Index - is the manual trading system that measures the difference of pressure between bears forces and bulls forces. Green line - is a noize free index that showing curent situation. Zero value of index shows totally choppy/flat market.Values above zero level shows how powerfull bullish wave is and values below zero measures bearish forces.Up arrow appears on bearish market when it's ready to reverse, dn arrow appears on weak bullish market, as a result of reverse expectation.
Pips Hunter Robot
Ekaterina Saltykova
This EA is based on Grid Martingail method, and it has made a huge evolution with this method of trading.   It does not use directly the "classic" Grid Martingail method. EA waits exact points to add new orders in case of initial order goes loss direction. It has smart method to define follow up position points, that allows EA to stand up HUGE one side market's price direction. During high - impact News, highg-volatility time most of Grid systems, if it was not turned off, successfully blows tr
Golden section price action indicator - is a trend-scalping complete system with enter and exit points. Indicator is based on most powerfull price action japan patterns that are filtered by volume, volatility, market phase. Pattern is not a simple combinations of candles. Patterns must have "weight" to move market in right direction. "Weight" - is the summary of pattern's volume, the size of pattern candles according to last average volatility and ofcourse pattern must appear in correct market p
Balance Weighted Moving Hedge System- is the trend following manual system for forex/crypto market. Indicator represents custom balance-weighted moving average indicator. The main advantagies : very stable moving with really early signals, defines current trend power, ignores market noise. The more width of indicator line - the more expressive trend is. On the other hand thin moving line shows unstable / choppy market. Indicator can be used as single b alance weighted moving or with hedge strate
SupportResistancePeaks Indicator indicator - is the combination of dynamic support/resitance and price action pattern. As a rule support/resistance indicators uses already calculated, history levels. The most disadvantage of this method - new(incomming) levels always are not the same as were on history, in other words accuracy is not so high as expected. My indicator is looking for dynamic/live levels that are forming right now after trend lost it's power and choppy market starts. As a rule exac
Trend deviation scalper - is the manual system to scalp choppy market places. Indicator defines bull/bear trend and it's force. Inside exact trend system also defines "weak" places, when trend is ready to reverse. So as a rule, system plots a sell arrow when bull trend becomes weak and possibly reverses to bear trend. For buy arrow is opposite : arrow is plotted on bear weak trend. Such arrangement allows you to get a favorable price and stand up market noise. Loss arrows are closing by common p
Trend driver bars is the manual trading system, which defines current trend continue or it's pull-back/reverse. "Driver" bars - are price action patterns that has powerfull affect on market, defining it's near future direction. Generally, driver bars represents trend "skeleton" and often anticipates new market impulse. System plots arrows when market shows 3 pattenrs in a row(most powerfull combo-pattern), and makes fast scalping of incomming movement. Loss positions closes by common profit. Lot
Wave Impulse OmegaScalper - is the manual system for scalping. In many cases Indicator "eats" almost all possible trend wave. System defines up price wave and down price wave. Inside the exact wave - system defines true trend movement and choppy market. Indicator plots signals while market is trending, powerfull and has quiet good volatility. This is complete system with enter and exit points. Main Indicator's Features Signals are not repaint,non-late or disappear(exept cases when system recalcu
Reverse side scalper is the manual trading system, that works on choppy(anti-trend) market. As a rule markets are on 80% choppy and only 20% is trend phase. System is based on custom step Moving and RSI and reverse pattern. System defines up movement, down movement, trend / choppy phases. Indicator plots Buy signal arrow when current direction is down and phase is trend, Sell signal arrow is plotted when currently is up movement and phase is trend. As a rule it allows to "catch" local maximum/mi
Binary step clouds - is the complete trading system with enter and exit points. System is based on double smoothed exponential step moving and volume weighted simple step moving.Generally each movings define trend direction and places when trend is in active phase. Signals plots when both movings approache to active trend phase and market speed is high.  Main Indicator's Features Signals are not repaint,non-late or disappear(exept cases when system recalculates all history datas,refreshing main
Acceleration Force Meter Indicator - is a trend system that join market in trend phase and after trend pull-back. AFM indicator - is the system that watchs market phases from flat to extreme volatility and prefers to enter in market when it's active, more volatility, ignoring most flat places. This is 100% complete trading system including enter and exit points. It works well with profitable trades - maximizing take profit targets(analysis of recent market volatility, its pips range to adapt cur
Market Chopper Indicator - is the manual system for market scalping. Indicator uses most accurate points to enter, when current trend has lost it's power and new one starts. Indicator shows : Enter points(buy/sell arrows), Exit points(Stoploss/Takeprofit arrows). Indicator makes market analysis and adapts to any market, any timeframe showing most relevant strategy for exact conditions. Main Indicator's Features Signals are NOT repaint, late or disappear; Every signal comes at the open of new bar
ImbaTrend Runner - is the trend following manual system for forex/crypto market. It defines medium-term trends and works with it in intraday mode. System shows enter points, profit and loss targets. As a rule profit targets are 2-3 X bigger than loss targets. Indicator is AutoAdaptive and it automatically updates it's settings during trading. Indicator is sensitive to market changes, regular updates helps to stay in relevant trend. Main Indicator's Features Signals are not repaint, late or disap
Early WPR divergence - is the manual system to define trend reverse. Green histogram shows main trend, Orange one - shows "short"/local trend. System is looking for clear divergence between both trends and pick up position(plot buy/sell arrows). When main trend is up, but local trend reverses to bearish trend and get's big power - sell arrow is plotted;    When main trend is down, but local trend reverses to bullish trend and get's big power - buy arrow is plotted;  Main inputs are : mediumTrend
Trend Gain Oscillator - is the manual system for defining trend phase(bullish/bearish). When histogramm is pink - market is up/bullish and when histogramm is blue - market is down/bearish. Arrows is plotted on zero cross, in case if additionally market has power for future movement. Main inputs are : trendPeriod- main indicator's period for trend calculation; trendPowerPeriod - period for market's power(volatility+volume) calculation ; trendPowerTrigger - arrows is not plotted if market's power
Bull bear pressure indicator - is the manual system which defines bull/bear market. When lines is above zero level - market is strong bullish, and when lines below zero level - market is bearish. First line represents global trend and second one are smoothed and shows local market's mood. Main inputs are : MainPeriod- main indicator's period for global trend calculation; SignalPeriod - period for   smoothed and shows local market's trend; Main Indicator's Features Signals are not repaint,non-la
ROC acceleration-deceleration is the manual system for medium-term scalping. Indicator based on custom ROC system which defines bullish/bearish market and especially  acceleration-deceleration of tendention in the market's main direction. Buy arrow is plotted during bearish market when current trend decelerates and sell  arrow is plotted during bullish market when current trend decelerates. Main Indicator's Features Signals are not repaint,non-late or disappear(exept cases when system recalculat
ASI fractals with DPO filter - is the manual trend-following system. ASI fractals are the base of every trend. System plots an arrow when fractal pattern appears on ASI indcator and DPO direction is same as incomming signal. System has several ways of usage : simply indicator, indicator with suggested arrows, arrows with single targets and arrows with common profit targets. User can simply switch indicator's modes directly from chart. Main Indicator's Features Signals are not repaint,non-late or
Trend reversal index - is the manual trading system that works with overbought , oversold levels and reversal patterns. Sell arrow is plotted when indicator is higher than overbought level and here forms reversal pattern, all pattern points  located higher than overbought level. Opposite with buy arrow : ndicator is lower than oversold level and here forms reversal pattern, all pattern points located lower than overbought level.  Main Indicator's Features Signals are not repaint, late or disapp
Dema divergence points - is the manual trading system based on double exponental moving divergence. Histogram represents 4 colors : yellow - strong up trend, orange - up movement, blue - down movement and aqua - strong down trend.  Up arrow is poltted when dema crosses current price up - but phase is still strong down (aqua color), down arrow is poltted when dema crosses current price down - but phase is still strong up (yellow color). Main inputs :  mainPeriod - main dema calculation period; f
Demarker pullback system - is the manual trading system for choppy markets. It show 2 colored histogram.  When histogram is blue - market is quite bullish, when histogram ir orange - market is more bearish. Up arrow is plotted when histogram is in oversold zone but blue color. Down arrow is plotted when histogram is in overbought zone but orange color. These patterns shows false breakout and possible soon reverse(price is overbought but shows bearish signs and price is oversold but shows bullis
TPM Cross (trend power moving cross) - is a trend following strategy based on custom signal points. Indicator consists from main custom moving chart line and trend power line. Indicator defines up and down movements by it's trend power and custom moving direction. When current market's trend looses it's power and opposite trend starts - power trend line  crosses moving and indicator plots an arrow.  Main indicator's adjustable inputs : movingPeriod - period of moving line  trendPeriod  - period
Impulse fractals indicator - is counter-trend oriented complex market fractal pattern.  Market creates bull/bear impulse, trend starts, fractals on impulsed wave are an agressive pullback signals. Buy arrow is plotted when market is bearish and it's impulse showed up-side fractal, and sell arrow is plotted when market is bullish and it's impulse showed dn-side fractal. Main indicator's adjustable inputs : impulsePeriod - main period of impulse histogram  filterPeriod  - smoothes impulse accordi
Triple trend index is the manual trading system/indicator. It looks for trend reversal points according to main trend index datas. Indicator represents  4 lines. 3 lines shows trend power by main market's parametres. 4th line (OrangeRed) is the main index. When line is above zero level - market is bullish, value below zero show bearish pressure. Indicator "looks" for weak places(reversal points) on bullish market to plot a sell arrow and weak places(reversal points) on bearish market to plot a
Floating peaks oscillator - it the manual trading system. It's based on Stochastik/RSI type of oscillator with dynamic/floating  overbought and oversold levels. When main line is green - market is under bullish pressure, when main line is red - market is under bearish pressure. Buy arrow appears at the floating bottom and sell arrow appears at floating top. Indicator allows to reverse signal types. Main indicator's adjustable inputs : mainTrendPeriod; signalTrendPeriod; smoothedTrendPeriod; tre
Trend speed vector - is the oscillator for manual trading. System measures trend direction and it's speed. Histogram shows 4 colors: Lime --> Strong up movement with good gain speed; Green --> Up movement with low gain speed Red --> Strong down movement with good gain speed; Orange --> Down movement with low gain speed Green and Orange histograms show weak market's movements and thуese places excluded from signal points. Buy arrow is plotted during strong down movement when bearish gain speed i
Floating gain meter is the manual trading system that works with local trends and it's scalping. Histogram represents  bull/bear floating trend gain. Green color histogram shows choppy market with bullish pressure, Orange - shows choppy market with bearish pressure. Lime and Red colors shows "boiled" places in market. As a rule buy arrow is placed after strong Down movement when it's power becomes weak and choppy market starts. And sell arrow is plotted after strong Up movement when it's power
Pullback points indicator - is the manual trading system, that shows most popular market prices. Indicator measures bull/bear waves pressure and looks for "consensus" prices. As a rule these points are crossed up and down very often and opened trade has several chances to be closed in positive zone. Mainly, such points is the good base for "common profit" types of strategies. Indicator also represents   "common profit"  scalping method of trading as default one.  Main Indicator's Features Signa
Noize Absorption Index MT4
Ekaterina Saltykova
5 (1)
Noize Absorption Index - is the manual trading system that measures the difference of pressure between bears forces and bulls forces. Green line - is a noize free index that showing curent situation. Zero value of index shows totally choppy/flat market.Values above zero level shows how powerfull bullish wave is and values below zero measures bearish forces.Up arrow appears on bearish market when it's ready to reverse, dn arrow appears on weak bullish market, as a result of reverse expectation. S
Market Chopper Indicator - is the manual system for market scalping. Indicator uses most accurate points to enter, when current trend has lost it's power and new one starts. Indicator shows : Enter points(buy/sell arrows), Exit points(Stoploss/Takeprofit arrows). Indicator makes market analysis and adapts to any market, any timeframe showing most relevant strategy for exact conditions. Main Indicator's Features Signals are NOT repaint, late or disappear; Every signal comes at the open of new bar
Auswahl:
Keine Bewertungen
Antwort auf eine Rezension