• Übersicht
  • Bewertungen
  • Diskussion

Zig Zag Ma Rsi Signal1

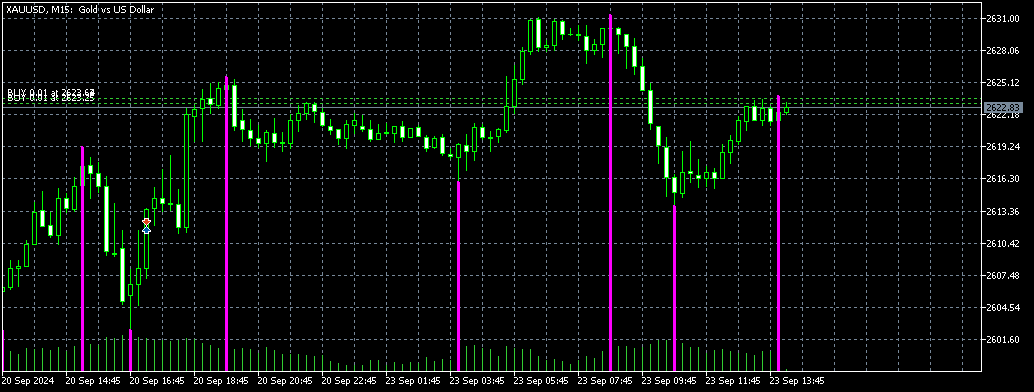
Dieser Code erstellt einen benutzerdefinierten Indikator für die MetaTrader 5-Plattform. Der Indikator generiert starke Kauf- und Verkaufssignale unter Verwendung einer Kombination aus ZigZag, Gleitendem Durchschnitt (MA) und Relative Strength Index (RSI). Hier ist eine detaillierte Erklärung des Codes:

Indikator-Definition und Eigenschaften:
- Der Indikator wird im Chartfenster angezeigt.
- Er verwendet 5 Indikatorpuffer und 3 Plots.
- Separate Plots werden für ZigZag, Kaufsignale und Verkaufssignale definiert.

Eingabeparameter:
- Verschiedene Parameter werden für ZigZag, MA und RSI definiert (Tiefe, Abweichung, Periode usw

Empfohlene Produkte
WAPV Box Effort x Result
Eduardo Da Costa Custodio Santos
WA_PV_BOX_EFFORT X ERGEBNIS für MT5 Der WAPV Box Effort x Result Indicator ist Teil der Package Indicators-Gruppe (Wyckoff Academy Wave Market). Der WAPV Box Effort x Result Indicator für MT5 hilft Ihnen beim Lesen von Preis und Volumen. Seine Lektüre besteht darin, bei der Identifizierung von Aufwand x Ergebnis zu helfen in Wellen, die durch den Graphen erzeugt werden. Der WAPV Box Effort x Result Indicator für MT5 bedeutet, wenn das Kästchen grün ist, dass das Volumen der Nachfrage entspricht,
InfinX Hull Mavg MT5
Stanislav Shtiliyanov
The Hull Moving Average (HMA) attempts to minimize the lag of a traditional moving average while retaining the smoothness of the moving average line. Developed by Alan Hull in 2005, this indicator makes use of weighted moving averages to prioritize more recent values and greatly reduce lag. The resulting average is more responsive and well-suited for identifying entry points. For more information, welcome to our Telegram Group.  https://t.me/InfinXx
To get access to MT4 version please click here . - This is the exact conversion from TradingView: "Didi Index" by " everget ". - This is a popular version of DIDI index on tradingview. - This is a light-load processing and non-repaint indicator. - Buffer is available for the lines on chart and arrows on chart. - You can message in private chat for further changes you need. Thanks for downloading
Zeus Indicator MT5
Lo Thi Mai Loan
3 (1)
Vorstellung des Zeus-Indikators: Ihr ultimatives Werkzeug für den Durchbruch zu profitablen Trades. Dieser Indikator vereinfacht das Trading, indem er die Notwendigkeit für eine tiefgreifende Analyse mit Ausbruchsstrategien beseitigt. Er zeichnet automatisch Zonen basierend auf Ihren voreingestellten Zeitrahmen und schlägt Stop-Loss (SL), Take-Profit (TP) und Trailing-Stop-Levels vor. Der Zeus-Indikator wird Sie umgehend benachrichtigen und Signalpfeile anzeigen, wenn der Preis die Kauf- oder Ve
The Penta-O is a 6-point retracement harmonacci pattern which usually precedes big market movements. Penta-O patterns can expand and repaint quite a bit. To make things easier this indicator implements a twist: it waits for a donchian breakout in the right direction before signaling the trade. The end result is an otherwise repainting indicator with a very reliable trading signal. The donchian breakout period is entered as an input. [ Installation Guide | Update Guide | Troubleshooting | FAQ | A
Follow The Line MT5
Oliver Gideon Amofa Appiah
4.52 (29)
This indicator obeys the popular maxim that: "THE TREND IS YOUR FRIEND" It paints a GREEN line for BUY and also paints a RED line for SELL. (you can change the colors). It gives alarms and alerts of all kinds. IT DOES NOT REPAINT and can be used for all currency pairs and timeframes. Yes, as easy and simple as that. Even a newbie can use it to make great and reliable trades. NB: For best results, get my other premium indicators for more powerful and reliable signals. Get them here: https://www.m
FREE
Are you tired of drawing trendlines every time you're analyzing charts? Or perhaps you would like more consistency in your technical analysis. Then this is for you. This indicator will draw trend lines automatically when dropped on a chart. How it works Works similar to standard deviation channel found on mt4 and mt5. It has 2 parameters: 1. Starting Bar 2. Number of bars for calculation The   starting bar   is the bar which drawing of the trend lines will begin, while the   number of bars for c
FREE
Volume Waves
Paulo Henrique Faquineli Garcia
One of the best tools for analyzing volume, Weis Wave was devised by David Weis to facilitate reading the directional flow. For the disciples of the Wyckoff method, this means an evolution, facilitating a predictive reading of the market, always looking for Accumulation and Distribution zones for traded assets. For better understanding, in this indicator we try to cover every reading of EFFORT (traded volume) versus RESULT (price change). Thus, you can apply the indicator on the chart twice
Mini Chart Indicators
Flavio Javier Jarabeck
The Metatrader 5 has a hidden jewel called Chart Object, mostly unknown to the common users and hidden in a sub-menu within the platform. Called Mini Chart, this object is a miniature instance of a big/normal chart that could be added/attached to any normal chart, this way the Mini Chart will be bound to the main Chart in a very minimalist way saving a precious amount of real state on your screen. If you don't know the Mini Chart, give it a try - see the video and screenshots below. This is a gr
To download MT4 version please click here . - This is the exact conversion from TradingView: "Trend Direction Force Index - TDFI [wm]" By "causecelebre". - This indicator uses multiple levels of averaging to detect trend strength. - You can optimize filter low and filter high levels to achieve best results. - You have access to buffers to use in EAs. - This is a light-load processing and non-repaint indicator. - You can message in private chat for further changes you need.
Hunter trend
Yaroslav Varankin
Hunter Trend: Arrow Indicator for Binary Options Trading Hunter Trend is an arrow indicator designed for trading binary options (turbo options) on the M1 timeframe, allowing for short-term trading opportunities. How to Trade with this Tool: Signals may appear when a candlestick forms. Once such a signal appears, wait for the closure of that candlestick. Upon the opening of a new candlestick, open a trade for 1-2 candlesticks in the indicated direction. In this case, for 1-2 minutes. A blue dot
Dieser Indikator zeigt Ihnen die TP- und SL-Werte (in dieser Währung), die Sie bereits für jede Order in den Charts (geschlossen zur Transaktions-/Orderzeile) festgelegt haben, was Ihnen sehr dabei helfen wird, Ihren Gewinn und Verlust für jede Order zu schätzen. Und es zeigt Ihnen auch die PIPs-Werte. das angezeigte Format ist „Währungswerte unserer Gewinn- oder Verlust-/PIPs-Werte“. Der TP-Wert wird in grüner Farbe und der SL-Wert in roter Farbe angezeigt. Bei Fragen oder weiteren Informati
HiqIndi
Ratul Goswami
It is 1 Minute Strategy. When Indicator Gives Signal Then Put on Buy. It's Best Work on Crash 300 & Crash 500. If you want to know anything details please Contact Me on Telegram In this Link:  https://t.me/+mi_52VwFp3E4MGNl It is very nice for scalping & for who not gives enough time on market. N/B: Please be carefully it's only for scalping & not trade all the day. It's only 10 or maximum 15 trade per day. Thanks everyone.
Секвента Демарка (Sequential) - индикатор, демонстрирующий развитие тренда, его структуру. Довольно точно отображает начальную и конечную точки, важные точки перелома. Срабатывает по открытию свечи, поэтому перерисовок не будет никогда. Здесь нет сложных формул, только статистика, отсчёт свечей, выбранных по определённым критериям. При этом индикатор может давать очень точные сигналы для входа, особенно при поддержке какого-нибудь индикатора уровней, например, этого . Алгоритм нахождения сигнал
To download MT4 version please click here . - This is the exact conversion from TradingView: " PA-Adaptive Hull Parabolic " By "Loxx". - This is a non-repaint and light processing load indicator - You can message in private chat for further changes you need. - All input options are available. - Buffers are available for processing within EAs. - Highlight option is omitted as does not show good in Metatrader. 
up down v6 for mt5 is no repaint all timeframe and all pairs indicator. red histogram cros trigger that is up point,and put a red point on histogram. and blue histogram cros trigger that is deep point.and put blue point on histogram. this indicator need to sometimes zoom out .for thise pres + button. if newly comes signal is too high makes before invisible.red and blue points are there.to see the signals. indicator is no repaint and can use all time frame and all pairs. only need minimum 500 bar
Balance Aggression
Edson Cavalca Junior
The indicator measures the balance of aggression. The formula is as follows:   Aggression  = Purchase Volume - Sales Volume. Note : It is rec ommended to use the default configuration and VPS values. It does not work in Forex. Meet Our Products     Parameters : Numbers of days prior to the current one for calculation; Volume Divider e; Enables calculation of the current candle; Histogram Line style and; Size; Line Line style and; Size;  Follow us on our website to check the next new
KF-BB Professional Bollinger Bands with Alert. Bollinger bands available in the market are mostly drawn based on simple moving average . KF-BB is the first bollinger bands that can draw the center line using all the usual methods simple , exponential, etc. A very professional indicator, it does not end here other advantages of this indicator include creating an alarm on the desktop and the mobile phone When the candlesticks hit one of the center lines or the upper and lower bands Features in
Noize Absorption Index - is the manual trading system that measures the difference of pressure between bears forces and bulls forces. Green line - is a noize free index that showing curent situation. Zero value of index shows totally choppy/flat market.Values above zero level shows how powerfull bullish wave is and values below zero measures bearish forces.Up arrow appears on bearish market when it's ready to reverse, dn arrow appears on weak bullish market, as a result of reverse expectation.
Tabajara V5
Flavio Javier Jarabeck
4.85 (33)
Metatrader 5 version of the famous Andre Machado's Tabajara indicator. If you don't know Andre Machado's Technical Analysis work you don't need this indicator... For those who need it and for those several friend traders who asked this porting from other platforms, here it is... FEATURES 8-period Moving Average 20-period Moving Average 50-period Moving Average 200-period Moving Average Colored candles according to the inflexion of the 20-period MA SETTINGS You can change the Period of all M
FREE
Dies ist ein MTF-Indikator für Unterstützungs- und Widerstandsniveaus basierend auf den   Extremwerten des Advanced ZigZag Dynamic   und/oder   Extended Fractal   Indikators mit Preisetiketten (kann deaktiviert werden). Für den MTF-Modus können höhere TFs ausgewählt werden. Standardmäßig werden die Ebenen basierend auf ZigZag-Indikatorpunkten generiert. Fraktale Indikatorpunkte können auch zusammen mit ZigZag oder stattdessen verwendet werden. Um die Verwendung zu vereinfachen und CPU-Zeit zu sp
Clear DOM
Oclair Gallacini Prado
Clear Dom This Indicator shows a pressure color box based on depth of market of the current symbol. Notice that it only works when book information is received. You decide weather you want or not to display higher (ask) and lower (bid) levels of book. The proportion ratio is calculated using volumes read from the book. You can read the actual pressure in the market any time. Indicator parameters: color_Ask -> ASK box color and ASK value line color color_Bid -> BID box color and BID valu
LT Donchian Channel
Thiago Duarte
4.8 (5)
Donchian Channel is an indicator created by Richard Donchian. It is formed by taking the highest high and the lowest low of the last specified period in candles. The area between high and low is the channel for the chosen period. Its configuration is simple. It is possible to have the average between the upper and lower lines, plus you have alerts when price hits one side. If you have any questions or find any bugs, please contact me. Enjoy!
FREE
Rainbow MT5
Jamal El Alama
4 (1)
Description : Rainbow MT5 is a technical indicator based on Moving Average with period 34 and very easy to use. When price crosses above MA and MA changes color to green, then this is a signal to buy. When price crosses below MA and MA changes color to red, then this is a signal to sell. The Expert advisor ( Rainbow EA MT5 ) based on Rainbow MT5 indicator is now available here . MT4 version is available here .
FREE
Fibonacci and RSI. Demo versión only works with GBPUSD. For full version, please, visit visit https://www.mql5.com/en/market/product/52101 The indicator is a combination of the Fibonacci and RSI indicators. Every time the price touches one of the fibonacci levels and the rsi condition is met, an audible alert and a text alert are generated. Parameters number_of_candles : It is the number of candles that will be calculated. If you put 100, the indicator will give you the maximum and min
FREE
Weis Waves
Flavio Javier Jarabeck
2.83 (18)
The original author is David Weis, an expert in the Wyckoff Method. The Weis Wave is a modern adaptation of the 1930's Wyckoff Method, another expert in Tape Reading techniques and Chart Analysis. Weis Waves takes market volume and stacks it into waves according to price conditions giving the trader valuable insights about the market conditions. If you want to learn more about this subject you can find tons of videos in YouTube. Just look for "The Wickoff Method", "Weis Wave" and "Volume Spread
FREE
Ultimate Divergence Scanner (Multi Pair And Multi Time Frame) :   ---LIMITED TIME OFFER: NEXT 25 CLIENTS ONLY ---46% OFF REGULAR PRICE AND 2 FREE BONUSES ---SEE BELOW FOR FULL DETAILS It is a widely known market principle that momentum generally precedes price.  Making divergence patterns a clear indication that price and momentum are not in agreement.  Divergence patterns are widely used by institutional traders around the world. As they allow you to manage  your trades within strictly de
Donchian Channel DC is the indicator of Donchian Channels, that plots maximum and minimum values of a specific period, besides mean value line. It´s possible to configure simple period for analysis and the indicator will plot all three values. You can trade with this indicator as trend or reversal, according to each strategy. Do not let to test others indicators as soon as others expert advisors.
Revolution martingale
Yaroslav Varankin
5 (3)
Revolution Martingale is an indicator designed for trading binary options on the M5 timeframe. Features: M5 Timeframe: It is recommended to use the indicator on the M5 timeframe for optimal trading. Trade Entry: Trades should only be opened on the first candle after a signal appears. Signals: A blue diamond indicates a buying opportunity for upward movement, while a red diamond indicates a buying opportunity for downward movement. Configured for Effective Binary Options Trading: The indicator i
FREE
Value Chart Candlesticks
Flavio Javier Jarabeck
4.7 (10)
The idea of a Value Chart indicator was presented in the very good book I read back in 2020 , " Dynamic Trading Indicators: Winning with Value Charts and Price Action Profile ", from the authors Mark Helweg and David Stendahl. The idea is simple and the result is pure genius: Present candlestick Price analysis in a detrended way! HOW TO READ THIS INDICATOR Look for Overbought and Oversold levels. Of course, you will need to test the settings a lot to find the "correct" one for your approach.
FREE
Käufer dieses Produkts erwarben auch
TPSpro RFI Levels MT5
Roman Podpora
4.75 (12)
ANWEISUNGEN       Russland       -        ENG    Die Empfehlung basiert auf dem Indikator -   TPSpro   TREND PRO -   Version MT5 Die wichtigsten Elemente in der Branche sind entweder in Zonen oder in der Fabrik enthalten, oder sie führen zu einer Lösung bei einem Kauf oder dem Verkauf eines anderen Instruments. Wenn viele Menschen ihre Rechte nicht auf dem Händlerkonto verschlüsseln, werden die Folgen nicht schnell genug sein. Ich habe es damit abgeschlossen, dass ich diese Folgen nun noch inter
TPSproTREND PrO MT5
Roman Podpora
4.89 (9)
TPSpro TREND PRO   ist ein Trendindikator, der den Markt automatisch analysiert und Informationen über den Trend und jede seiner Änderungen liefert sowie Signale für den Einstieg in Geschäfte ohne Neuzeichnung gibt! Der Indikator verwendet jede Kerze und analysiert sie separat. bezieht sich auf verschiedene Impulse – Aufwärts- oder Abwärtsimpuls. Exakte Einstiegspunkte in Transaktionen für Währungen, Krypto, Metalle, Aktien, Indizes! Version MT5                   VOLLSTÄNDIGE BESCHREIBUNG DES I
Atbot
Zaha Feiz
4.92 (36)
AtBot: Wie es funktioniert und wie man es benutzt ### Wie es funktioniert Der "AtBot"-Indikator für die MT5-Plattform generiert Kauf- und Verkaufssignale mithilfe einer Kombination von technischen Analysetools. Er integriert den einfachen gleitenden Durchschnitt (SMA), den exponentiellen gleitenden Durchschnitt (EMA) und den Durchschnitt der wahren Reichweite (ATR)-Index, um Handelsmöglichkeiten zu identifizieren. Darüber hinaus kann er Heikin Ashi-Kerzen verwenden, um die Signalgenauigkeit zu
Trend Screener Pro MT5
STE S.S.COMPANY
4.87 (63)
Nutzen Sie die Macht des Trendhandels mit Trend Screener Indicator: Ihrer ultimativen Trendhandelslösung, die auf Fuzzy-Logik und einem System mit mehreren Währungen basiert! Steigern Sie Ihren Trendhandel mit Trend Screener, dem revolutionären Trendindikator mit Fuzzy-Logik. Es handelt sich um einen leistungsstarken Trendfolgeindikator, der über 13 Premium-Tools und -Funktionen sowie 3 Handelsstrategien kombiniert und ihn zu einer vielseitigen Wahl macht, um Ihren Metatrader in einen Trendanaly
Zunächst einmal ist es wichtig zu betonen, dass dieses Handelssystem ein Nicht-Repainting-, Nicht-Redrawing- und Nicht-Verzögerungsindikator ist, was es sowohl für manuelles als auch für automatisches Trading ideal macht. Online-Kurs, Handbuch und Vorlagen herunterladen. Das "Smart Trend Trading System MT5" ist eine umfassende Handelslösung, die für neue und erfahrene Trader maßgeschneidert ist. Es kombiniert über 10 Premium-Indikatoren und bietet mehr als 7 robuste Handelsstrategien, was es zu
Atomic Analyst MT5
Issam Kassas
4.32 (19)
Zunächst einmal ist es erwähnenswert, dass dieser Handelsindikator nicht neu malt, nicht neu zeichnet und keine Verzögerung aufweist, was ihn sowohl für manuellen als auch für Roboterhandel ideal macht. Benutzerhandbuch: Einstellungen, Eingaben und Strategie. Der Atom-Analyst ist ein PA-Preisaktionsindikator, der die Stärke und das Momentum des Preises nutzt, um einen besseren Vorteil auf dem Markt zu finden. Ausgestattet mit fortschrittlichen Filtern, die helfen, Rauschen und falsche Signale z
Quantum TrendPulse
Bogdan Ion Puscasu
5 (1)
Wir stellen   Quantum TrendPulse   vor, das ultimative Handelstool, das die Leistung von   SuperTrend   ,   RSI   und   Stochastic   in einem umfassenden Indikator vereint, um Ihr Handelspotenzial zu maximieren. Dieser Indikator wurde für Händler entwickelt, die Präzision und Effizienz suchen, und hilft Ihnen dabei, Markttrends, Momentumverschiebungen und optimale Ein- und Ausstiegspunkte sicher zu erkennen. Hauptmerkmale: SuperTrend-Integration:   Folgen Sie problemlos dem vorherrschenden Markt
FX Volume MT5
Daniel Stein
4.93 (14)
Erhalten Sie Ihr tägliches Marktupdate mit Details und Screenshots über unser Morning Briefing hier auf mql5 und auf Telegram ! FX Volume ist der ERSTE und EINZIGE Volumenindikator, der einen ECHTEN Einblick in die Marktstimmung aus Sicht eines Brokers bietet. Es bietet fantastische Einblicke in die Positionierung von institutionellen Marktteilnehmern, wie z.B. Brokern, auf dem Forex-Markt, viel schneller als COT-Berichte. Diese Informationen direkt auf Ihrem Chart zu sehen, ist der wahre Game
FX Power MT5 NG
Daniel Stein
5 (6)
Erhalten Sie Ihr tägliches Marktupdate mit Details und Screenshots über unser Morning Briefing hier auf mql5 und auf Telegram ! FX Power MT5 NG ist die nächste Generation unseres langjährig sehr beliebten Währungsstärkemessers FX Power. Und was bietet dieser Stärkezähler der nächsten Generation? Alles, was Sie am ursprünglichen FX Power geliebt haben PLUS GOLD/XAU-Stärkeanalyse Noch präzisere Berechnungsergebnisse Individuell konfigurierbare Analysezeiträume Anpassbares Berechnungslimit für noc
Gold Stuff mt5
Vasiliy Strukov
4.92 (169)
Gold Stuff mt5-Ein Trendindikator, der speziell für Gold entwickelt wurde, kann auch auf allen Finanzinstrumenten verwendet werden. Der Indikator wird nicht neu gezeichnet und verzögert sich nicht. Empfohlener Zeitrahmen H1. WICHTIG! Kontaktieren Sie mich sofort nach dem Kauf, um Anweisungen und Bonus zu erhalten!     Sie können eine kostenlose Kopie unseres Strong Support- und Trendscanner-Indikators erhalten, bitte senden Sie uns eine persönliche Nachricht. Mich! DATEN Draw Arrow - in
Dieses Dashboard zeigt die   neuesten verfügbaren harmonischen   Muster für die ausgewählten Symbole, so dass Sie Zeit sparen und effizienter sein werden /   MT4-Version . Kostenloser Indikator:   Basic Harmonic Pattern Spalten des Indikators Symbol:   die ausgewählten Symbole werden angezeigt Trend:   bullish oder bearish Pattern :   Art des Musters (Gartley, Schmetterling, Fledermaus, Krabbe, Hai, Cypher oder ABCD) Entry :   Einstiegskurs SL:   Stop-Loss-Kurs TP1:   1. Take-Profit-Kurs
Wir stellen vor       Quantum Breakout PRO   , der bahnbrechende MQL5-Indikator, der die Art und Weise, wie Sie mit Breakout-Zonen handeln, verändert! Entwickelt von einem Team erfahrener Händler mit über 13 Jahren Handelserfahrung,       Quantum Breakout PRO       ist darauf ausgelegt, Ihre Handelsreise mit seiner innovativen und dynamischen Breakout-Zone-Strategie auf ein neues Niveau zu heben. Der Quantum Breakout Indicator zeigt Ihnen Signalpfeile auf Breakout-Zonen mit 5 Gewinnzielzone
Dies ist ein Indikator für MT5, der genaue Signale für den Einstieg in einen Handel ohne Repainting (Neuzeichnen) liefert. Er kann auf alle Finanzwerte angewendet werden: Forex, Kryptowährungen, Metalle, Aktien, Indizes. Er liefert ziemlich genaue Schätzungen und sagt Ihnen, wann es am besten ist, eine Position zu eröffnen und zu schließen. Sehen Sie sich das Video (6:22) mit einem Beispiel für die Verarbeitung nur eines Signals an, das sich für den Indikator gelohnt hat! Die meisten Händler ver
Zunächst einmal ist es wichtig zu betonen, dass dieses Handelstool ein Nicht-Repaint-, Nicht-Redraw- und Nicht-Verzögerungsindikator ist, was es ideal für professionelles Trading macht. Online-Kurs, Benutzerhandbuch und Demo. Der Smart Price Action Concepts Indikator ist ein sehr leistungsstarkes Werkzeug sowohl für neue als auch erfahrene Händler. Er vereint mehr als 20 nützliche Indikatoren in einem und kombiniert fortgeschrittene Handelsideen wie die Analyse des Inner Circle Traders und S
Blahtech Supply Demand MT5
Blahtech Limited
4.54 (13)
Was: $299  Now: $99   Supply Demand uses previous price action to identify potential imbalances between buyers and sellers. The key is to identify the better odds zones, not just the untouched ones. Blahtech Supply Demand indicator delivers functionality previously unavailable on any trading platform. This 4-in-1 indicator not only highlights the higher probability zones using a multi-criteria strength engine, but also combines it with multi-timeframe trend analysis, previously confirmed swings
Der Gann Square Indikator ist ein leistungsstolles Marktanalyse-Tool, das auf dem Artikel "Mathematische Formel für Marktvorhersagen" von W.D. Gann basiert. Dieses Tool verwendet mathematische Konzepte und Gann-Theorien für eine präzise Marktanalyse. Es beinhaltet Quadratwerte von 144, 90, 52 und auch das Quadrat von 9. Darüber hinaus integriert es die Methode von  zur Quadratwurzel von 9 und deren Beziehung zu Kanälen und dem Sternmuster. Benutzerhandbuch und Anwendung: Vor der Verwendung diese
Der Forex TPA Indikator deckt die wahren Aktionen der Marktmacher auf, immer dann wenn sie passieren. "Kämpfe nicht gegen die Marktmacher an, sondern folge ihnen", ist wohl der beste Rat, den ein Trader bekommen kann. Der TPA Indikator zeigt jedesmal seine Signale an wenn die Bullen definitiv stärker sind als die Bären und umgekehrt. Dieser Indikator wurde VON Tradern FÜR Trader gemacht und ist 100% NICHT NACHZEICHNEND! Signale werden STRENG am Schluss einer Kerze  generiert. Das sagen unsere Ku
Matrix Arrow Indicator MT5
Juvenille Emperor Limited
5 (13)
Matrix Arrow Indicator MT5   ist ein einzigartiger 10-in-1-Trend, der zu   100 % nicht neu gezeichnet   werden kann. Multi-Timeframe-Indikator, der für alle Symbole/Instrumente verwendet werden kann:   Forex ,   Rohstoffe ,   Kryptowährungen ,   Indizes ,   Aktien .  Der  Matrix Arrow Indicator MT5  wird den aktuellen Trend in seinen frühen Stadien bestimmen und Informationen und Daten von bis zu 10 Standardindikatoren sammeln, die sind: Durchschnittlicher Richtungsbewegungsindex (ADX) Rohstoff
Quantum Trend Sniper
Bogdan Ion Puscasu
4.8 (49)
Wir stellen vor       Quantum Trend Sniper Indicator   , der bahnbrechende MQL5-Indikator, der die Art und Weise, wie Sie Trendumkehrungen erkennen und handeln, verändert! Entwickelt von einem Team erfahrener Händler mit über 13 Jahren Handelserfahrung,       Quantum Trend Sniper-Indikator       wurde entwickelt, um Ihre Trading-Reise mit seiner innovativen Methode zur Identifizierung von Trendumkehrungen mit extrem hoher Genauigkeit auf ein neues Niveau zu heben. ***Kaufe Quantum Trend Snipe
Auto Order Block with break of structure based on ICT and Smart Money Concepts (SMC) Futures Break of Structure ( BoS )             Order block ( OB )            Higher time frame Order block / Point of Interest ( POI )    shown on current chart           Fair value Gap ( FVG ) / Imbalance   -  MTF      ( Multi Time Frame )    HH/LL/HL/LH  -  MTF      ( Multi Time Frame )  Choch  MTF      ( Multi Time Frame )  Volume Imbalance     ,  MTF          vIMB Gap’s Power of 3 Equal High
Jetzt 147 US -Dollar (nach ein paar Aktualisierungen auf 499 US -Dollar) - Unbegrenzte Konten (PCs oder MACs) RelicusRoad Benutzerhandbuch + Schulungsvideos + Zugang zur privaten Discord-Gruppe + VIP-Status EINE NEUE ART, DEN MARKT ZU BETRACHTEN RelicusRoad ist der weltweit leistungsstärkste Handelsindikator für Forex, Futures, Kryptowährungen, Aktien und Indizes und gibt Händlern alle Informationen und Tools, die sie benötigen, um profitabel zu bleiben. Wir bieten technische Analysen un
PTS - Divergence Buy Finder von Precision Trading Systems Der Precision Divergence Finder wurde entwickelt, um Markt-Tiefpunkte mit höchster Genauigkeit zu finden und tut dies häufig. In der technischen Analyse ist das Aufspüren von Tiefpunkten im Allgemeinen viel einfacher als das Aufspüren von Höchstpunkten. Dieses Tool wurde genau für diese Aufgabe entwickelt. Nachdem eine bullische Divergenz identifiziert wurde, ist es ratsam, auf die Trendwende zu warten, bevor Sie kaufen. Sie können e
GannRS Trend Scalper   GannRS is an advanced trading tool based on Gann Law and Supports and Resistances. designed to have an   active trading at any time not lagging Indications are given at the beginning of a new candle Please watch the full tutorial video. How to use GannRS Very easy to set up... Put it on your chart Adjust inputs Inputs Show Resistance and support : [bool]  true = Shows R/S on chart false = does not show Show Levels :[bool]  true = Shows levels on the chart false = doe
Advanced Supply Demand MT5
Bernhard Schweigert
4.5 (14)
Derzeit 33% Rabatt! Die beste Lösung für jeden Anfänger oder erfahrenen Händler! Dieser Indikator ist ein einzigartiges, qualitativ hochwertiges und erschwingliches Trading-Tool, da wir eine Reihe von proprietären Funktionen und eine neue Formel integriert haben. Mit diesem Update werden Sie in der Lage sein, doppelte Zeitrahmenzonen anzuzeigen. Sie können nicht nur einen höheren TF (Zeitrahmen) anzeigen, sondern sowohl den Chart-TF als auch den höheren TF: SHOWING NESTED ZONES. Alle Supply Dema
Contact me for instruction, any questions! Related Product:  Gold Trade Expert MT5 Introduction The breakout and retest strategy is traded support and resistance levels. it involves price breaking through a previous level.  The break and retest strategy is designed to help traders do two main things, the first is to avoid false breakouts. Many false breakouts start with a candlestick that breaks out of a level but ends with an immediate candlestick that brings the price back into the level. T
Suchen Sie nach einem leistungsstarken Indikator für den Devisenhandel, der Ihnen dabei helfen kann, profitable Handelsmöglichkeiten mit Leichtigkeit zu erkennen? Suchen Sie nicht weiter als das Beast Super Signal. Dieser benutzerfreundliche trendbasierte Indikator überwacht kontinuierlich die Marktbedingungen, sucht nach neuen sich entwickelnden Trends oder springt auf bestehende Trends ein. Das Beast Super Signal gibt ein Kauf- oder Verkaufssignal, wenn alle internen Strategien aufeinander abg
Was: $249  Now: $99   Market Profile defines a number of day types that can help the trader to determine market behaviour. A key feature is the Value Area, representing the range of price action where 70% of trading took place. Understanding the Value Area can give traders valuable insight into market direction and establish the higher odds trade. It is an excellent addition to any system you may be using. Inspired by Jim Dalton’s book “Mind Over Markets”, this indicator is designed to suit the
FxaccurateLS
Shiv Raj Kumawat
WHY IS OUR FXACCCURATE LS MT5 THE PROFITABLE ? PROTECT YOUR CAPITAL WITH RISK MANAGEMENT Gives entry, stop and target levels from time to time. It finds Trading opportunities by analyzing what the price is doing during established trends. POWERFUL INDICATOR FOR A RELIABLE STRATEGIES We have made these indicators with a lot of years of hard work. It is made at a very advanced level. Established trends provide dozens of trading opportunities, but most trend indicators completely ignore them!
ICT, SMC, SMART MONEY CONCEPTS, SMART MONEY, Smart Money Concept, Support and Resistance, Trend Analysis, Price Action, Market Structure, Order Blocks, BOS/CHoCH,   Breaker Blocks ,  Momentum Shift,   Supply&Demand Zone/Order Blocks , Strong Imbalance,   HH/LL/HL/LH,    Fair Value Gap, FVG,  Premium  &   Discount   Zones, Fibonacci Retracement, OTE, Buy Side Liquidity, Sell Side Liquidity, BSL/SSL Taken, Equal Highs & Lows, MTF Dashboard, Multiple Time Frame, BigBar, HTF OB, HTF Market Structure
[ MT4 Version ] Only the next 10 units at current price! Final price: $299 Are you tired of spending months on demo or live accounts to test your trading strategies? The Backtesting Simulator is the ultimate tool designed to elevate your backtesting experience to new heights. Utilizing Metatrader historical symbol information, it offers an unparalleled simulation of real market conditions. Take control of your testing speed, test ideas quickly or at a slower pace, and witness remarkable improve
Weitere Produkte dieses Autors
Certainly. Here's the explanation in English: This program is a custom indicator that calculates the MACD (Moving Average Convergence Divergence) and shows the crossovers between the MACD and Signal lines. Here are the main functions of the program: MACD Calculation: Calculates the difference between the Fast EMA (Exponential Moving Average) and Slow EMA. This difference forms the MACD line. Signal Line Calculation: Creates the Signal line by taking a simple moving average (SMA) of the MACD valu
Dieser MACD (Moving Average Convergence Divergence) Indikator hat folgende Eigenschaften: Separates Fenster: Wird unter dem Hauptchart angezeigt. MACD-Linie: Blaue Linie, die den Unterschied zwischen schnellem und langsamem EMA zeigt. Signallinie: Rote Linie, die den SMA der MACD-Linie zeigt. Histogramm: Graues Histogramm, das den Unterschied zwischen MACD- und Signallinie zeigt. Kauf-/Verkaufssignale: Grüne (Kauf) und rote (Verkauf) Pfeile an Schnittpunkten. Nulllinie: Graue gepunktete Linie,
Dieser fortschrittliche MACD-Indikator behält die Grundfunktionen des Standard-MACD bei und bietet gleichzeitig mehrere zusätzliche Funktionen: Histogramm-Färbung: Das Histogramm verwendet vier verschiedene Farben, um Zu- und Abnahmen deutlich zu zeigen. Hellgrün für zunehmende positive Werte, Grau für abnehmende positive Werte, Rot für abnehmende negative Werte und Orange für zunehmende negative Werte. Signallinie-Überkreuzungspfeile: Zeigt Pfeile für Kauf- und Verkaufssignale an den Punkten, a
Auswahl:
Keine Bewertungen
Antwort auf eine Rezension