RR TradeManager Visualizer
- Indikatoren
- Komi Eyram F Kahoho
- Version: 2.0
- Aktualisiert: 3 Oktober 2024
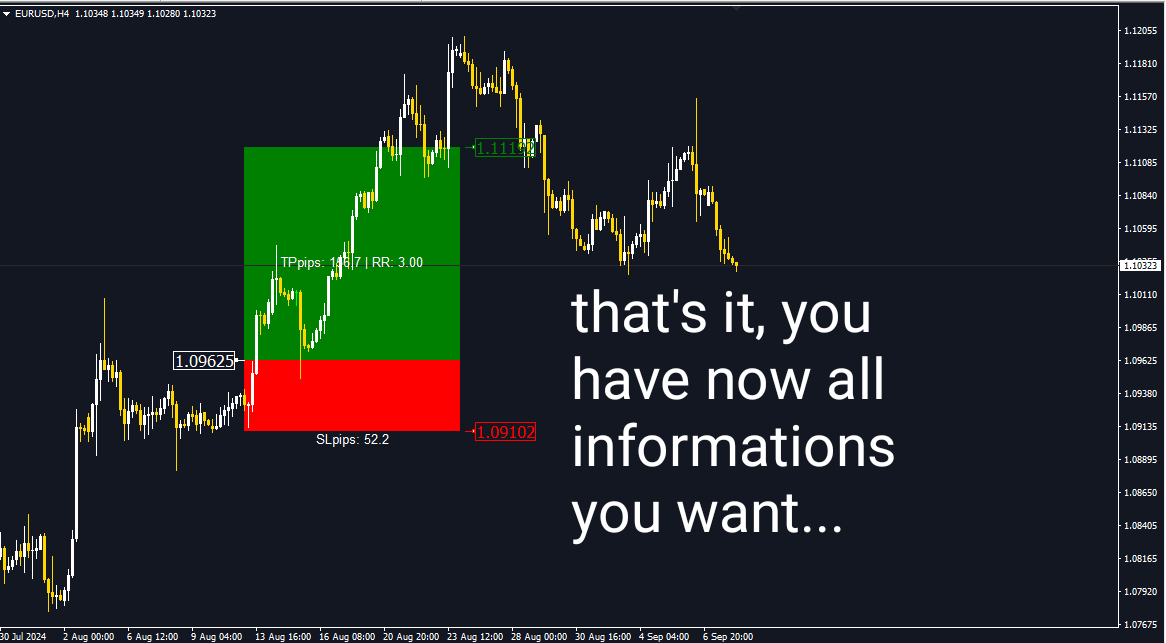
RR_TradeManager Visualizer ist ein Handelsmanagement-Tool, das für Händler entwickelt wurde, die ihre Gewinnziel- (TP) und Stop-Loss- (SL) Ebenen einfach auf einem Chart visualisieren möchten. Diese erste Version bietet eine einfache grafische Darstellung, die die SL- und TP-Zonen sowie den Einstiegspreis anzeigt. Bitte beachten Sie, dass sich diese aktuelle Version ausschließlich auf die grafische Darstellung der SL- und TP-Zonen als Figuren auf dem Chart konzentriert.
Aktuelle Version: Funktionen:
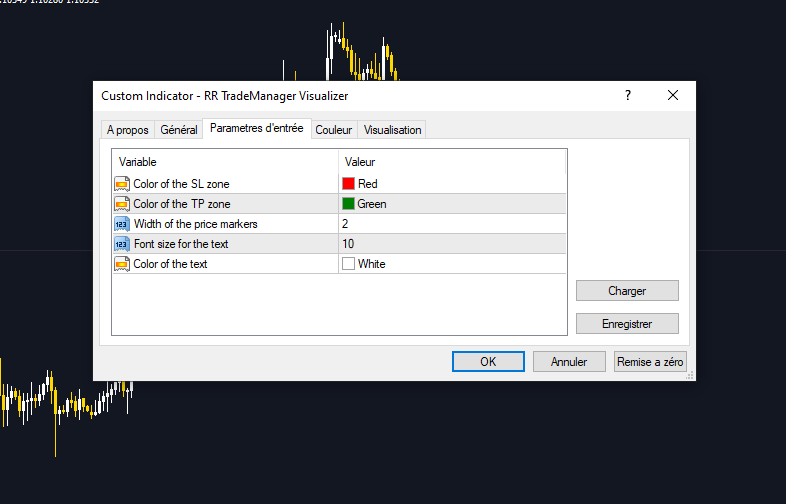
- Anzeige der SL- und TP-Zonen: Klare Visualisierung der Stop-Loss- und Take-Profit-Ebenen mit anpassbaren Farben.
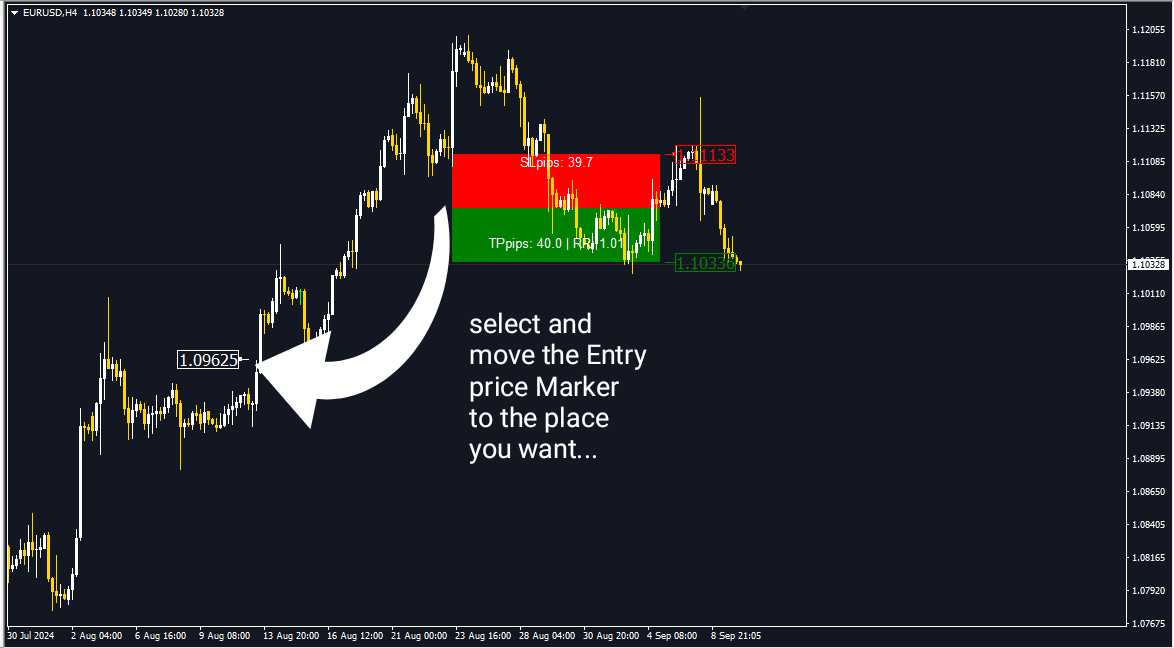
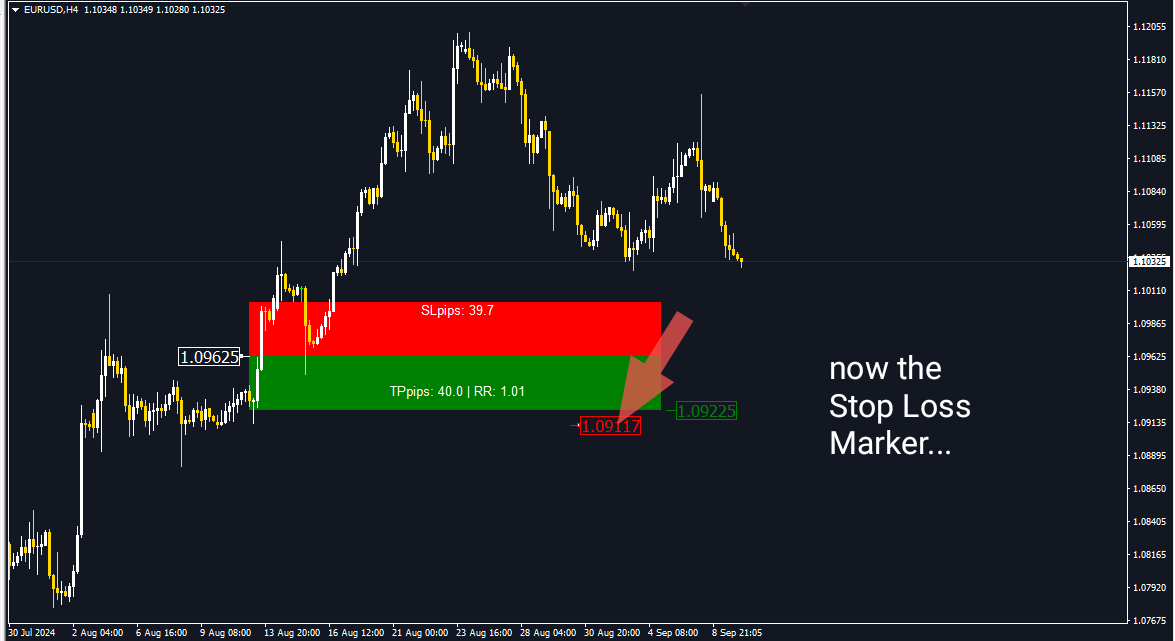
- Verschiebbarer Einstiegspreis: Ermöglicht es, den Einstiegspreis auf dem Chart zu verschieben, um zu sehen, wie die SL- und TP-Niveaus reagieren.
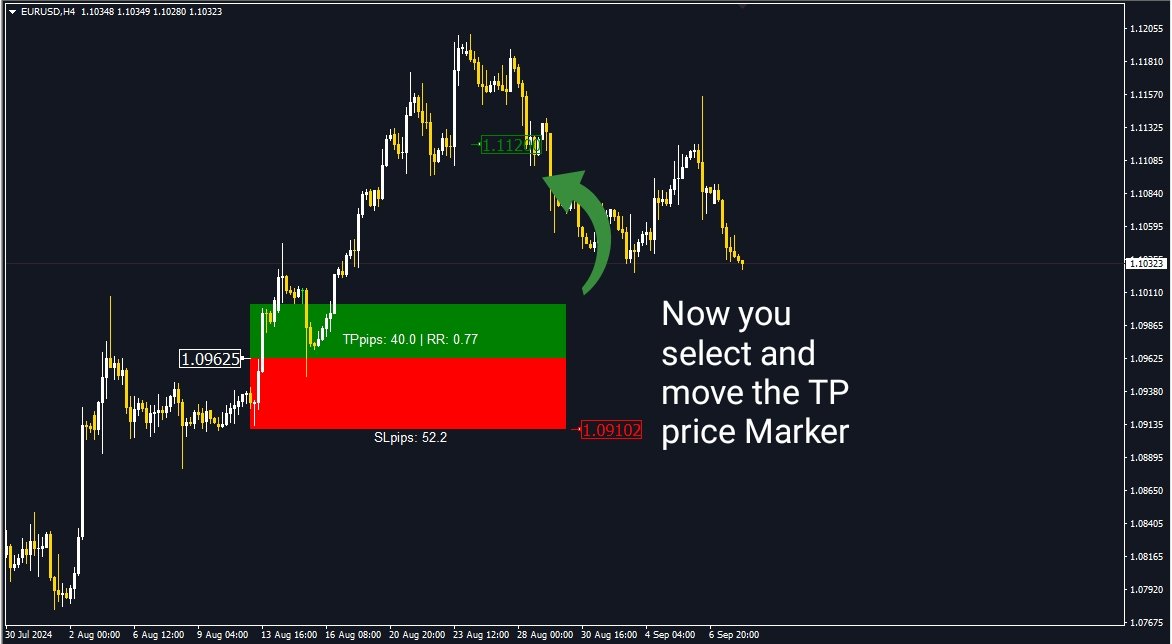
- Berechnung des Risiko-Rendite-Verhältnisses: Dynamische Anzeige des Risiko-Rendite-Verhältnisses basierend auf den definierten Ebenen.
Verwendung:
- Einstiegspreis festlegen: Klicken Sie auf den Chart, um Ihren Einstiegspreis festzulegen.
- SL- und TP-Niveaus anpassen: Verschieben Sie die SL- und TP-Zonen, um Ihre Risiko- und Rendite-Niveaus anzupassen.
- Zonen visualisieren: Die SL- und TP-Zonen werden in verschiedenen Farben angezeigt, um die Visualisierung zu erleichtern.
Demnächst: Eine aktualisierte Version wird in wenigen Tagen verfügbar sein, die zusätzliche Funktionen und Verbesserungen für ein noch effektiveres Handelsmanagement bietet.
Bitte: Wenn Ihnen der RR_TradeManager Visualizer nützlich erscheint, bewerten Sie bitte das Produkt auf der Seite. Ihr Feedback ist sehr wichtig und hilft uns, das Tool weiter zu verbessern.