"Boeta Rsi Histo" ist leider nicht verfügbar.
Schauen Sie sich andere Produkte von Pieter Gerhardus Van Zyl an:

The indicator is a histogram for scalping the lower timeframes
When the hill behind appears go short and when it disappears go long
The indicator has only sound alerts
The colors can be adjusted as preferred
Suitable for lower timeframes - 1 - 5 minutes
Test in demo before purchase
Enjoy -----------------------------------------------------------------------

Eine nicht neu zu lackierende Pfeilanzeige zur Unterstützung bei Eingaben In Trendmärkten werden bessere Signale gegeben Warten Sie, bis sich die aktuelle Leiste schließt, um den Pfeil zu fixieren Laden Sie einfach das Diagramm, ohne dass Einstellungen verwechselt werden könnten Die Farbe und Größe des Pfeils kann angepasst werden Der Indikator kann mit jedem Paar oder jedem Zeitrahmen verwendet werden – Forex, Krypto ..... Es ist besser, mit dem Trend zu größeren Zeitrahmen zu handeln ---------

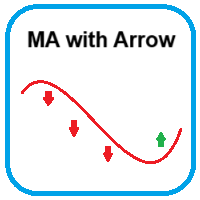
The indicator provides a moving average with buy and sell arrows
Only buy arrows are shown above the moving average and only sell arrows are shown below the moving average
The moving average can be adjusted as preferred - Default is 200 EMA
The arrows is non repaint after close of candle to lock it in place
The arrows also has alerts if needed
Suitable to any timeframe or instrument of choice
Test in demo before purchase
Enjoy

The indicator is a simple bar oscillator with green and red bars
The calculation of the bars are Rsi based
The values of the bars does not recalculate after bar has closed
Higher green bars shows possible bullish momentum and vice versa
The indicator has no settings or alerts
The colors can be adjusted as preferred but the bar width should remain on default
Suitable for any timeframe or instrument
Test in demo before purchase
Enjoy ----------------------------------------------

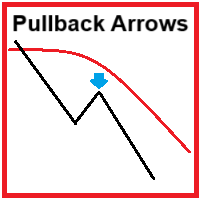
The indicator provides buy and sell arrows with a moving average
# Added color change to the moving average and added ema bars
The arrows are based on a reversal algorithm - Different than my other indicator MA with Arrows that is continuation based
Only buy arrows are shown above the moving average and only sell arrows are shown below the moving average - Where the candle closes
The arrows are non repaint
Alerts can be activated as preferred
Suitable to any timeframe or instrument