Eurusd Maverick P Weekly Indicator
- Indikatoren
- GEORGIOS VERGAKIS
- Version: 1.0
- Aktivierungen: 5
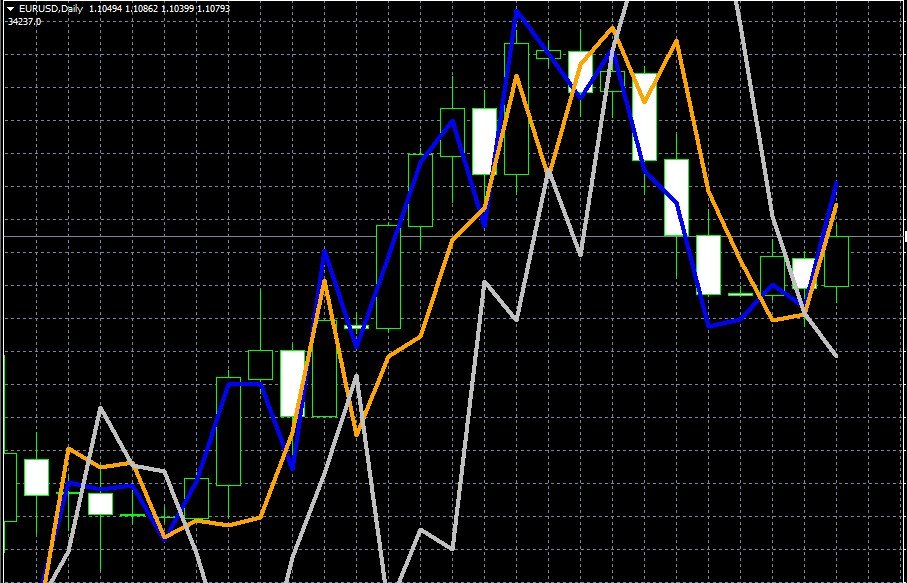
Development of this indicator goes back several years, we have successfully used this latest algorithm since 2019, and it generally works well enough to be profitable. It was originally attampted to make it work on the daily chart, but as you will see in practice it doesn't work so well on the daily chart, while it works extremely well on the weekly chart, for the period setting between 0 and 2, (0 is the latest running week candle, 1 is the latest candle plus the previous one, 2 weeks combined, and a setting of 2 is 3 weeks).
This is an indicator that senses major trend reversals BEFORE they occur and before even swing trading signals! It's not perfect, you will see that, and it couldn't be better. Nonetheless, it's profitable enough to turn around your trading.
Limitations:
it tends to give back 20-30% of the gains on all good moves, while in more rare times you get a signal, and then the next week you may get an opposite signal. This problem is more profound on the daily and smaller time frames, this is why we ended up using it on the weeklys only.
Despite these natural limitations, the indicator can sense the dynamic and almost impossibe to predict EURUSD market allowing for massive profits over the weeks where the signals are clear!
Who is this indicator for? This indicator is a serious intermarket indicator suitable for investment funds that want to have greater insight into the market, beyond just momenutm and price action.
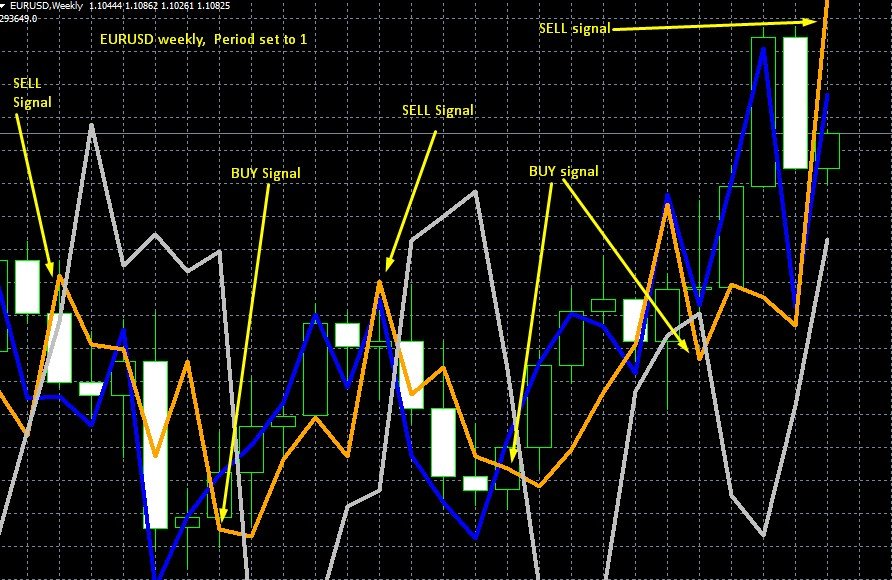
Signals reading is very simple, you neet to plot the indicator on 3 different weekly charts, with period set from 0 to 2 respectively. Then
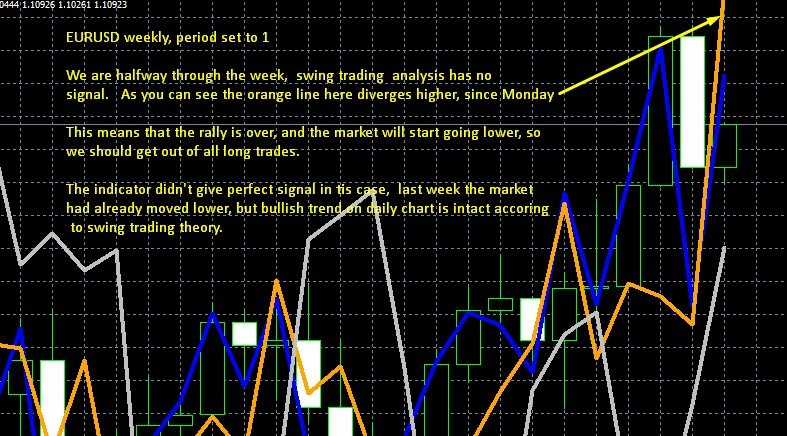
each Monday of the week (typically signals can but rarely ever change through the week), you just watch for divergences on the orange line.
If the orange line divergeses away from the other two lines, if to the down side it's a BUY signal, if on the up side it's a SELL signal.
Signal formation can happen slowlly or fast, if for example EURUSD has been rallying for few weeks, and then the orange line starts pushing higher, it means the end of the rally is near, if on one Monday, it shows up diverging on the up side extremely, then the SELL signal is in place, and this won't change even if Monday is a bulllish day.
We use all 3 periods from 0 to 2, while usually, but not always the setting of 1 gives us most signals.