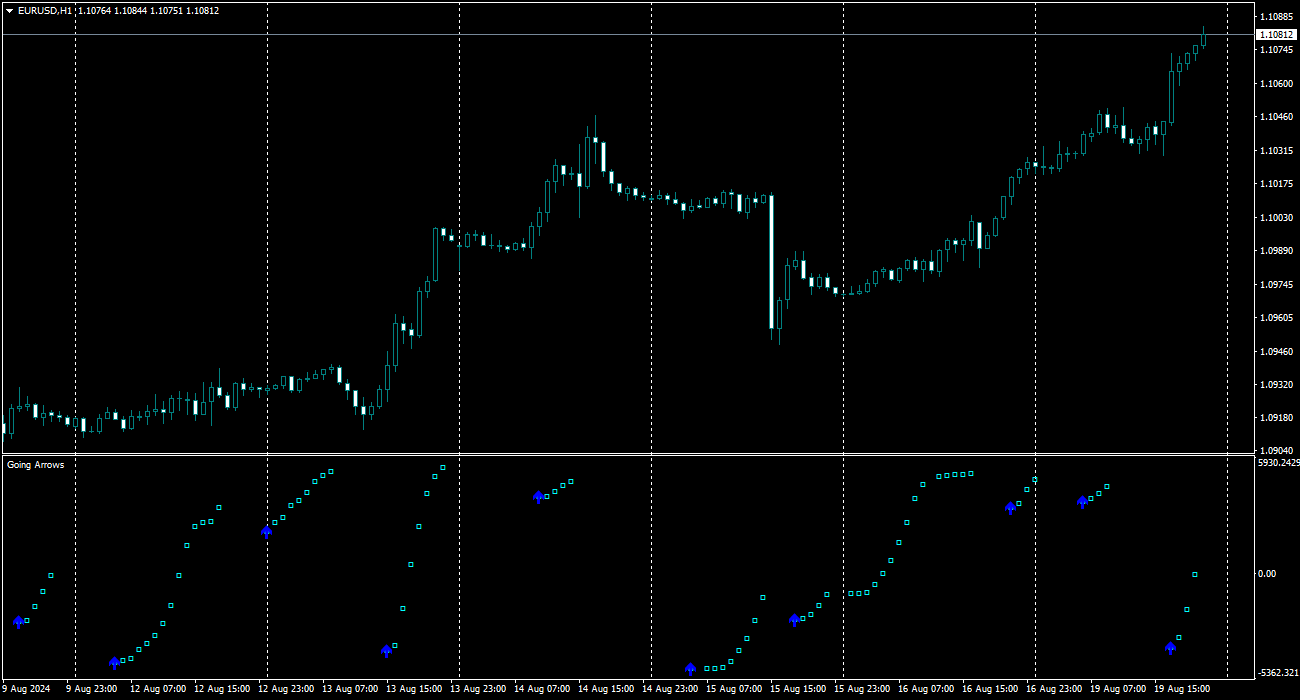
• Übersicht
  • Bewertungen
  • Diskussion

Going Arrows

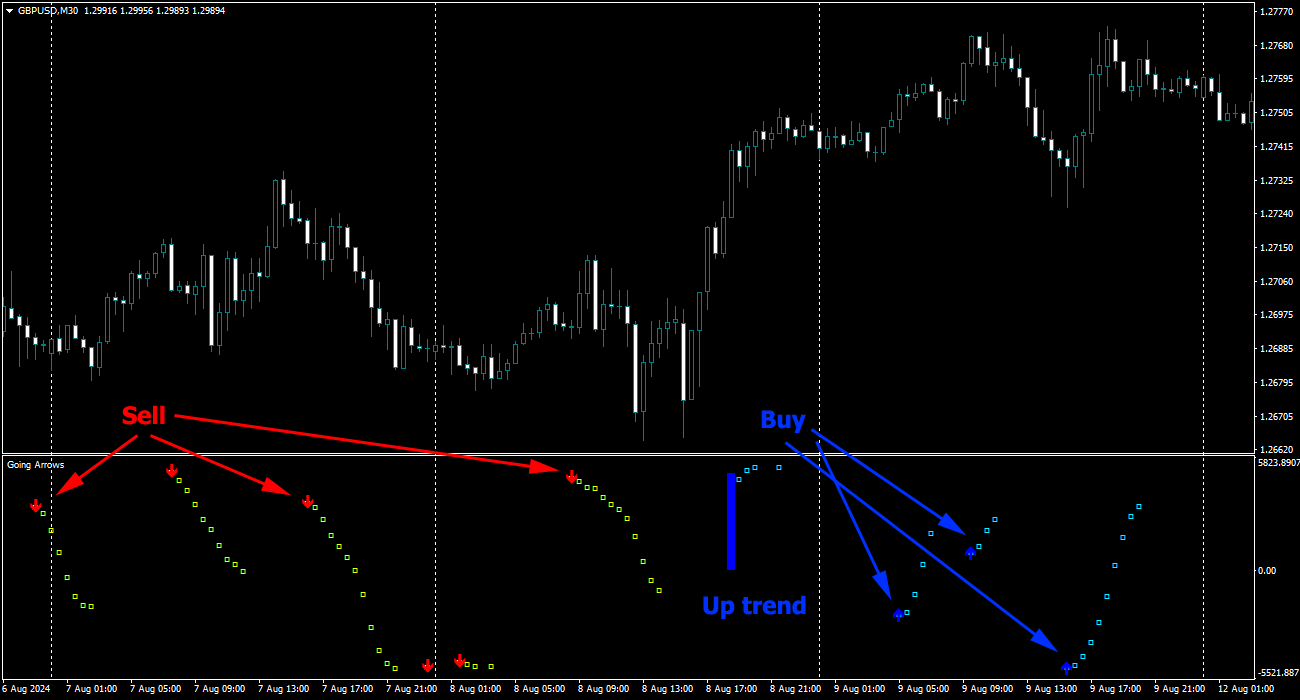
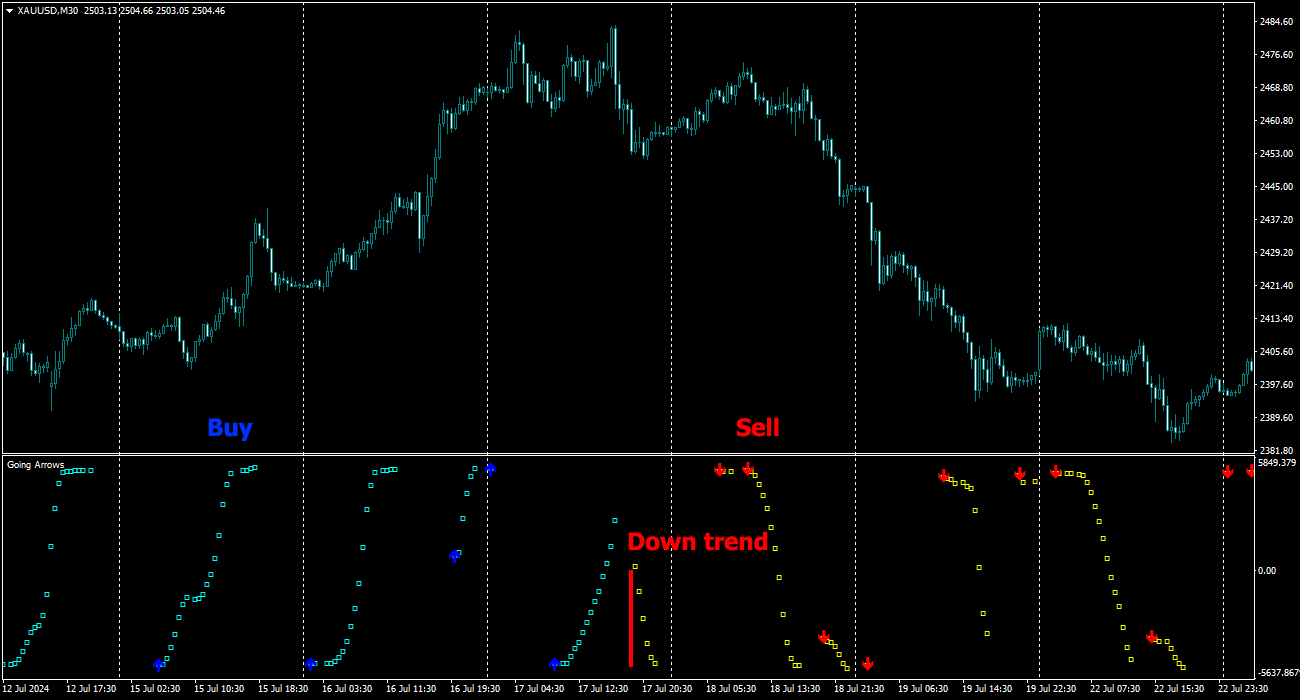
Ein speziell für das Scalping entwickelter technischer Indikator, der Volatilitätsimpulse erkennen und deren Dauer anzeigen kann.
Es verfügt über flexible Parameter für manuelle Einstellungen, sodass Sie die Funktionalität des Indikators auf jedes Handelsinstrument anwenden können.
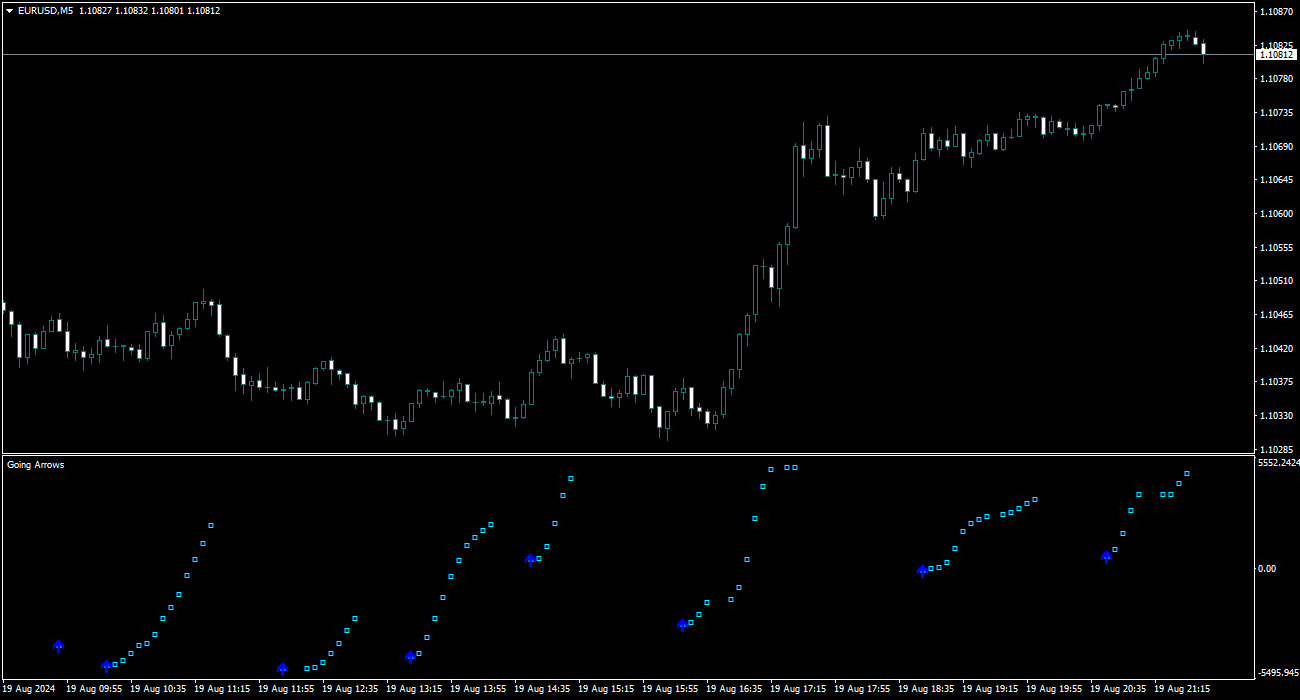
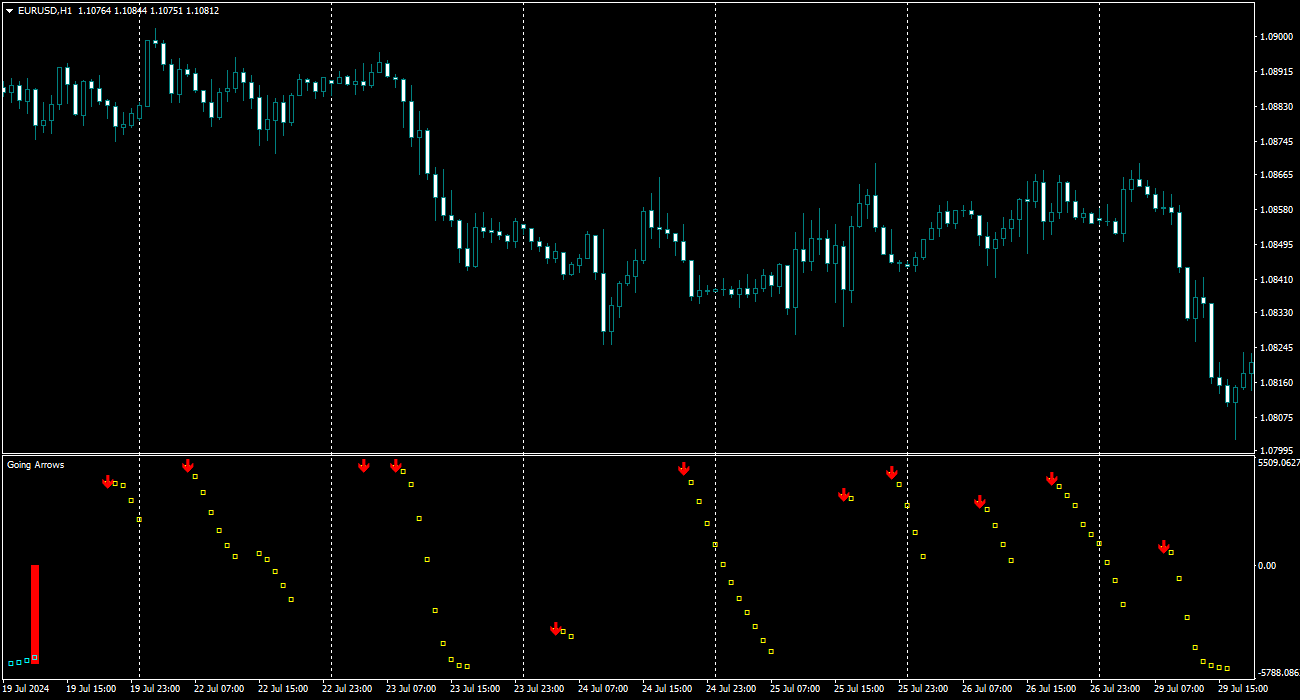
Empfohlene Zeitrahmen sind M5, M15, M30, H1 und H4.
Es gibt verschiedene Arten von Warnungen.
Alle Signale ändern oder verfärben sich am Ende der Kerze nie.

Der Indikator wird von oben nach unten durch Parameter konfiguriert.
  • Trend Length – Gibt die Trendlänge an, für die die folgenden Berechnungen funktionieren.
  • Duration of arrows – Anzahl der Balken zur Berechnung des Volatilitätsmomentums (Abnahme mit zunehmender TF).
  • Accuracy – Bestimmt die Genauigkeit des Signalanfangs.
  • Smoothing – Wendet eine Filterung an, um Rauschen zu entfernen.
Empfohlene Produkte
Liquidity Buy Sell Signal Indicator is a no-nonsense, no delay, no repaint indicator ! Liquidity pools together with a trend filter is the most powerful and reliable signal according to me (with the correct parameters depending on the timeframe used) It selects buy/sell entry signals based on liquidity in the market. The time range to scan for liquidity can be set in the parameters. Liquidity is an important aspect in the market, especially for institutional investors, as they need lots of liqu
Trend Scanner looks at the Market watchlist and Checks to see if there are trending cases between three (3) timeframes selected by the user. The analysis can assist in finding pairs to focus on for a particular session where a trader may need to have a bias in terms of direction to place trades for a particular system which requires multiple timeframe filtration of bar momentum. 3 Main indicators are involved: Moving Average, MACD and Heiken Ashi. User is able to select timeframes available on
Doonchian
Andriy Sydoruk
The Doonchian channel consists of two channel displays. Channel lines are determined by a simple and reliable algorithm. The channel is preferably used for trading inside the channel. The indicator does not redraw and does not lag; simple algorithms are the basis of the work. It works on all currency pairs and on all timeframes. As always a warning, we must not forget that the approach must be comprehensive, the indicator signals require additional information to enter the market.
DS Arrow
Dmitriy Sychev
DS Arrow is a simple indicator for buying/selling in MetaTrader 4, This straightforward indicator shows the market entry points. Perfect for both beginners and professionals. Designed for working only with the H1 timeframe, the indicator will not be displayed on other timeframes. Recommended currency pairs: GBP-USD, EUR-USD, USD-CAD, AUD-USD, USD-JPY, NZD-USD. Works with both4-digit and 5-digit quotes. This indicator does not redraw its signals. Features The entry is made when the hourly candl
Doji Marker Point
Alexander Shienkov
This indicator shows the levels and signal dots of the Doji pattern. The indicator allows traders to easily determine possible location of a price rebound. Doji is a candlestick with Open and Close price equal, or almost equal. It should also have shadows of approximately the same size on both sides. Doji denotes the balance between buyers and sellers, or the absence of major players, or level testing. This pattern can mean both a reversal and a continuation of the trend. Indicator Parameters
This indicator Master XR indicator.Indicator displays trend movement. Indicator calculates automatically line. Features FiltPer - displays indicator period. deviation - displays indicator deviation. deviation2 - displays indicator deviation. How to understand the status: If (Timeframe M1-H1) FiltPer = 100; If ( Timeframe H4-MN) FiltPer = 5-20; ////////////////////////////////////////////////////////////////////////////////////////////////////////////////////////////////////////////////////// /
Fractal Trend AM
Andriy Matviyevs'kyy
The presented indicator is essentially a separate trading system. The indicator independently determines entry points and points for setting protective stop orders. This product can be useful for both beginners and experienced traders, since it is developed on the basis of solutions proven by time and by professional traders. On fully formed bars the indicator is not redrawn. The indicator has the ability to send notifications to the terminal and email. Technically, the indicator is a system of
FREE
TMoney OrderBLockWeek
Moises Orlando Urbina Sojo
The indicator is activated at the beginning of each week and detects both bullish and bearish ORDERBLOCK potentials. These levels are of high operational probability, being able to use a minimum ratio of 3 to 1 to maximize profits. It is recommended to use pending orders at the OB levels of the chart and place the SL up to a maximum of 20 pips from the entry price. Submit the indicator to Backtesting to become familiar with its performance and complement it with other trend or oscillation typ
Trading Indicator Lab's Volume by Price is a volume-based indicator for MT4 that reveals price levels with the most and least volume for each bar within a given period. How It Works You can think of the indicator as a running volume profile that displays the most voluminous price level and the price level that has the least volume. For each bar, the indicator calculates the volume vertically in the price axis. As this is calculated, the indicator creates 2 signals: (1) a large red dot which repr
Supply and Demand Indicator + FREE Currency Strength Meter ADD-ON Looking for a powerful tool that can help you identify the most reactive zones in the forex market? Our supply and demand indicator for MetaTrader 4 and 5 is exactly what you need. With its advanced algorithms and real-time analysis, this indicator helps traders of all experience levels make informed trading decisions. The supply and demand indicator is a cutting-edge tool that helps traders identify areas where buyers and seller
The Levels indicator has been created to simplify the process of plotting support and resistance levels and zones on selected timeframes. The indicator plots the nearest levels of the selected timeframes, which are highlighted in different colors. It significantly reduces the time needed to plot them on the chart and simplifies the market analysis process. Horizontal support and resistance levels are used to identify price zones where the market movement can slow down or a price reversal is lik
Diamond PRO
Fanur Galamov
4.84 (19)
Diamond PRO is enhanced powerful version of Diamond for advanced traders. Pro version includes optimized cores, new impoved entry points filters, new multistage profit closure algorithm and сontains number of external control parameter that allows build and fine tune own tradind decisions and algorithms. The system provides more accurate market entries, analyzes and filters upcoming economic news, contains spread protection and an advanced position management algorithm. Main goal of Diamond PRO
The indicator allows you to trade binary options. The recommended time frame is М1 and the expiration time is 1 minutes. The indicator suitable for auto and manual trading. A possible signal is specified as a arrows above/under a candle. You should wait until the candle closes! Arrows are not re-painted Trade sessions: London and New York section Currency pairs: AUD/CAD Working time frame: M1 Expiration time: 1 minute The indicator also shows good results when using the martingale strategy - "Ma
FREE
Die Idee hinter diesem Indikator besteht darin,   Murray-Pegel in allen Zeitrahmen zu finden und sie zu Combo-Pegeln zu kombinieren , die Signalpegel basierend auf starken Murray-Pegeln enthalten.   (+2,   +1, 8, 4, 0, -1, -2). Je kürzer der Zeitrahmen, desto mehr Chancen haben Sie, das Combo-Level sofort zu sehen. Es wird farblich hervorgehoben. Wenn Sie den Cursor über eine beliebige Zahl bewegen, wird ein Hinweis angezeigt, zu welchem ​​Zeitrahmen das Level gehört. Sie sehen jedoch immer den
KT Horizontal Lines MT4
KEENBASE SOFTWARE SOLUTIONS
In MetaTrader, plotting multiple   horizontal lines   and then tracking their respective price levels can be a hassle. This indicator automatically plots multiple horizontal lines at equal intervals for setting price alerts, plotting support and resistance levels, and other manual purposes. This indicator is suitable for Forex traders who are new and looking for chances to make quick profits from buying and selling. Horizontal lines can help traders find possible areas to start trading when the
CycleIdentifier
Amyr Shryf Mhmd Salh
The Cycle Identifier MT4 indicator is a great choice of custom indicator for both short-term and long-term traders. The Cycle Identifier MT4 generates filtered price action signals to assist traders to identify when the conditions are right to open buy and sell positions. How it works The Cycle Identifier MT4 indicator displays on a separate indicator chart below the main chart where it draws an oscillating gray line. This gray line is characterized by upward and downward spikes that are accompa
Hell Dog Pro
Hossein Davarynejad
/// Hell Dog Pro /// This Expert Working 5 day a week 12 month of years                                                      Live     unique strategy where it continuously splits a single trade into seven smaller trades. This means that each time the EA executes a trade, it automatically divides it into seven smaller positions. Hell Dog Pro   stands out from other expert advisors due to its remarkable approach to handling losing trades. Unlike traditional methods that solely rely on Stop
Please follow the "How To Trade" instructions exactly for best results Wycoff theory is vastly used by institutional traders but when it comes to retail traders the concept isn't well understood by most. It is even more difficult to implement in intraday & swing trading. This No REPAINT indicator helps you in analyzing the market cycles and plots buy/sell signals at the start of trending phase. It studies the market strength of bulls and bears and does a effort Vs reward matrix calculation befor
Volatility Trend System – ein Handelssystem, das Signale für Einstiege gibt. Das Volatilitätssystem liefert lineare und punktuelle Signale in Richtung des Trends sowie Signale zum Verlassen des Trends, ohne Neuzeichnung und Verzögerungen. Der Trendindikator überwacht die Richtung des mittelfristigen Trends, zeigt die Richtung und deren Änderung an. Der Signalindikator basiert auf Änderungen der Volatilität und zeigt Markteintritte an. Der Indikator ist mit mehreren Arten von Warnungen ausgest
TrendWave Oscillator is an advanced MT4 oscillator that not only identifies the trend direction but also provides visual and audio alerts to enhance trading strategies. Key Features: - Color-coded trend indication:   - Blue : Indicates an uptrend, signaling potential price growth.   - Orange : Indicates a downtrend, suggesting possible price decline.   - Gray : Represents a flat market or lack of clear entry signals. - Graphical signals on the chart :   - Aqua : Highlights an uptrend, empha
Chart Analyzer
Innovicient Limited
The Chart Analyzer is an MT4 indicator that provides visual arrow signals without redrawing them. In addition, we have included trendlines to validate your entries. This indicator has been fine-tuned to work with all timeframes and instruments.  The Chart Analyzer has a number of advantages Does not fade or remove arrows when drawn Sends both email and phone alerts. It is light on computer resources Easy to install. Default setting works just fine.  If price opens above the trendline, open
Ska ZigZag BuySell
NKATEKO VUKOSI LEROY MASANGO
Ska ZigZag BuySell indicator determines the overbought and oversold regions within a trend. The indicator determines the overbought region by the candlestick high and the oversold region by the candlestick low. This indicator only gives signals with arrow and audible alerts each and every time when a new candlestick appear. To utilize the full strategy i recommend using "Ska ZigZag BuySell" together with "Ska ZigZag Line". The Ska ZigZag Line indicator is available for free. NOTE: Indicator is h
This indicator draws Horizontal Support and Resistance automatically. It works with any symbol and any timeframe. Stronger Support Lines are displayed in thicker green horizontal lines. In the same way, Stronger Resistance lines are displayed with thicker red lines. Change the timeframe to display the Support and Resistance Lines of various timeframes.
PDP indicator is used for: defining price probability distributions. This allows for a detailed representation of the channel and its borders and forecast the probability of a price appearing at each segment of its fluctuations; defining the channel change moment. Operation principles and features PDP analyzes a quote history on lower timeframes and calculates a price probability distribution on higher ones. Forecast algorithms allow the indicator to calculate probability distributions and m
In the world of trading, one of the main concerns is finding a reliable trading system. Meet the TrendEdge Channel indicator - your reliable companion in this search. Developed based on complex mathematical calculations, this indicator predicts the most likely short-term price movements. TrendEdge Channel is designed specifically to identify trends in price movements. Thanks to it, you can quickly determine not only the direction of the trend, but also the levels of interaction between buyers
LR Candles AM
Andriy Matviyevs'kyy
This indicator displays candle prices on the chart, colored according to the data of a linear regression of various prices (at the user's choice) for a selected period of time. The user has the option to select two different price types and two different time periods. The indicator will display the moments of coincidence of the directions of the linear regression. Usage: After the full formation of a candle colored in the opposite color to the previous candle, place a stop order at the high /
FREE
Candle EA MT4
Mansour Babasafary
4.43 (49)
This expert is based on patterns The main patterns of this specialist are candlestick patterns Detects trends with candlestick patterns It has a profit limit and a loss limit, so it has a low risk The best time frame to use this expert is M30 time frame The best currency pairs to use with this expert is the EURUSD, GBPUSD, AUDUSD, USDCAD currency pairs Attributes: Can be used in the EURUSD, GBPUSD, AUDUSD, USDCAD  currency pairs Can be used in M30, H1, H4 time frames Has profit limit an
Forex Indicator "   Stochastic   for 8 Symbols" for MT4. Stochastic oscillator is one of the best indicators on the market - perfect tool for many traders. OverBought zone - above 80; OverSold one - below 20 It is great to take   Sell   entries from   above 80 zone   and  Buy   entries from   below 20 "S tochastic   for 8 Symbols" gives opportunity to control  S tochastic  values of up to   8 different symbols just on 1 chart This indicator is excellent to combine   with Price Action entries a
VisualTics
Dariusz Grywaczewski
A real rarity for scalpers. Are you looking for TFs lower than M1 ? Do you want to see the price dynamics inside the candle? This is a tool for you. Visual Ticks is an indicator that shows the tick chart in a separate window. He does it in real time waiting for changing ticks. Thanks to Visual Ticks, we can look inside the traditional candle and see the dynamics of the moving price. By setting "period_of_model" we can shape a chart made of candles. "period_of_model" defines how many c
Käufer dieses Produkts erwarben auch
Gold Stuff
Vasiliy Strukov
4.9 (270)
Gold Stuff-Ein Trendindikator, der speziell für Gold entwickelt wurde, kann auch auf allen Finanzinstrumenten verwendet werden. Der Indikator wird nicht neu gezeichnet und verzögert sich nicht. Empfohlener Zeitrahmen H1. Nach diesem Indikator geschrieben EA Gold Stuff Berater, können Sie es in meinem Profil finden. WICHTIG! Kontaktieren Sie mich sofort nach dem Kauf, um Anweisungen und Bonus zu erhalten!   Sie können eine kostenlose Kopie unseres Strong Support- und Trendscanner-Indikators
BITTE LESEN SIE DIE INFORMATIONEN UNTEN, BEVOR SIE DAS PRODUKT KAUFEN! Apollo Pips PLUS SP ist ein einzigartiges Produkt! ES IST FÜR ALLE, DIE MEINEN NEUEN „APOLLO PIPS“-INDIKATOR PLUS „SUPER PACK“-BONUS MIT ZUGRIFF AUF ALLE MEINE HANDELSINDIKATOREN ERHALTEN MÖCHTEN! Mit dem Kauf des Produkts Apollo Pips PLUS SP erwerben Sie tatsächlich eine völlig neue Version meines Apollo Pips-Indikators. Diese Version des Indikators verfügt über einen verbesserten Algorithmus und einen benutzerfreundlichen P
Scalper Inside PRO
Alexey Minkov
4.75 (60)
An exclusive indicator that utilizes an innovative algorithm to swiftly and accurately determine the market trend. The indicator automatically calculates opening, closing, and profit levels, providing detailed trading statistics. With these features, you can choose the most appropriate trading instrument for the current market conditions. Additionally, you can easily integrate your own arrow indicators into Scalper Inside Pro to quickly evaluate their statistics and profitability. Scalper Inside
TPSproTREND PrO
Roman Podpora
4.79 (19)
TPSpro TREND PRO   ist ein Trendindikator, der den Markt automatisch analysiert und Informationen über den Trend und jede seiner Änderungen liefert sowie Signale für den Einstieg in Geschäfte ohne Neuzeichnung gibt! Der Indikator verwendet jede Kerze und analysiert sie separat. bezieht sich auf verschiedene Impulse – Aufwärts- oder Abwärtsimpuls. Exakte Einstiegspunkte in Transaktionen für Währungen, Krypto, Metalle, Aktien, Indizes! Version MT5                   VOLLSTÄNDIGE BESCHREIBUNG DES
Atomic Analyst
Issam Kassas
5 (3)
Zunächst einmal ist es erwähnenswert, dass dieser Handelsindikator nicht neu malt, nicht neu zeichnet und keine Verzögerung aufweist, was ihn sowohl für manuellen als auch für Roboterhandel ideal macht. Benutzerhandbuch: Einstellungen, Eingaben und Strategie. Der Atom-Analyst ist ein PA-Preisaktionsindikator, der die Stärke und das Momentum des Preises nutzt, um einen besseren Vorteil auf dem Markt zu finden. Ausgestattet mit fortschrittlichen Filtern, die helfen, Rauschen und falsche Signale z
Gold Channel is a volatility-based indicator, developed with a specific timing algorithm for the XAUUSD pair, which consists of finding possible corrections in the market. This indicator shows two outer lines, an inner line (retracement line) and an arrow sign, where the theory of the channel is to help identify overbought and oversold conditions in the market. The market price will generally fall between the boundaries of the channel. If prices touch or move outside the channel it is a tra
Derzeit 20% Rabatt! Die beste Lösung für jeden Neueinsteiger oder Expert Händler! Dieses Dashboard arbeitet mit 28 Währungspaaren. Es basiert auf 2 unserer Hauptindikatoren (Advanced Currency Strength 28 und Advanced Currency Impulse). Es bietet einen hervorragenden Überblick über den gesamten Forex-Markt. Es zeigt die Werte der Advanced Currency Strength, die Veränderungsrate der Währungen und die Signale für 28 Devisenpaare in allen (9) Zeitrahmen. Stellen Sie sich vor, wie sich Ihr Hande
PZ Day Trading
PZ TRADING SLU
3.67 (3)
Dieser Indikator erkennt Preisumkehrungen im Zick-Zack, wobei nur Preisaktionsanalysen und ein Donchian-Kanal verwendet werden. Es wurde speziell für den kurzfristigen Handel entwickelt, ohne dass ein Nachlackieren oder ein Backpainting erforderlich ist. Es ist ein fantastisches Werkzeug für clevere Trader, die darauf abzielen, das Timing ihrer Operationen zu verbessern. [ Installationsanleitung | Update-Anleitung | Fehlerbehebung | FAQ | Alle Produkte ] Erstaunlich einfach zu handeln Es bi
NAM Order Blocks
NAM TECH GROUP, CORP.
5 (1)
MT4-Erkennungsanzeige für Auftragsblöcke mit mehreren Zeitrahmen. Eigenschaften - Vollständig anpassbar auf dem Diagrammbedienfeld, bietet vollständige Interaktion. - Verstecken und zeigen Sie das Bedienfeld, wo immer Sie möchten. - Erkennen Sie OBs in mehreren Zeiträumen. - Wählen Sie die anzuzeigende OB-Menge aus. - Verschiedene OBs Benutzeroberfläche. - Verschiedene Filter an OBs. - OB-Näherungsalarm. - ADR High- und Low-Leitungen. - Benachrichtigungsdienst (Bildschirmwar
Enigmera
Ivan Stefanov
5 (4)
ENIGMERA: Der Kern des Marktes https://www.enigmera.com Einführung Dieser Indikator und dieses Handelssystem sind ein bemerkenswerter Ansatz für die Finanzmärkte. ENIGMERA nutzt die fraktalen Zyklen zur genauen Berechnung von Unterstützungs- und Widerstandsniveaus. Er zeigt die echte Akkumulationsphase an und gibt Richtung und Ziele vor.  Ein System, das funktioniert, egal ob wir uns in einem Trend oder in einer Korrektur befinden.  Wie funktioniert es? ENIGMERA besteht aus drei Linien: der
PZ Trend Trading
PZ TRADING SLU
4.8 (5)
Trend Trading ist ein Indikator, der so weit wie möglich von den Markttrends profitiert, indem er Pullbacks und Breakouts zeitlich festlegt. Sie findet Handelsmöglichkeiten, indem sie analysiert, was der Preis während etablierter Trends tut. [ Installationsanleitung | Update-Anleitung | Fehlerbehebung | FAQ | Alle Produkte ] Handeln Sie mit Zuversicht und Effizienz an den Finanzmärkten Profitieren Sie von etablierten Trends, ohne ins Wanken zu geraten Profitable Pullbacks, Ausbrüche und vor
TPSpro RFI Levels
Roman Podpora
4.83 (24)
Umkehr der ersten Impulsniveaus (RFI)       ANWEISUNGEN       Russland       -        ENG    Die Empfehlung basiert auf dem Indikator -   TPSpro   TREND PRO -   Version MT5 Die wichtigsten Elemente in der Branche sind entweder in Zonen oder in der Fabrik enthalten, oder sie führen zu einer Lösung bei einem Kauf oder dem Verkauf eines anderen Instruments. Wenn viele Menschen ihre Rechte nicht auf dem Händlerkonto verschlüsseln, werden die Folgen nicht schnell genug sein. Ich habe es damit abgesc
Order Block Hunter
Noha Mohamed Fathy Younes Badr
5 (2)
Order block hunter indicator is the best indicator for  hunt the order blocks that area where there has been a large concentration of limit orders waiting to be executed Order blocks are identified on a chart by observing previous price action and looking for areas where the price experienced significant movement or sudden changes in direction .This indicator does that for you by using very complicated codes and helps you to take the best areas To buy and sell because it make marks at the best a
Connect Indicator
Sukunthakan Ngernbamrung
Connect Indicator is a tool used for connecting indicators between the MQL market and MT4. The connected indicators are made by our group and can be used for other applications, such as sending messages to the Line application or Telegram application. If you have any questions, please don't hesitate to ask us to receive support. Function and indicator buffer Buffer one is the high price of the previous candle. Buffer two is the high price of the previous candle. Usage To connect indicators to fu
Entry Points Pro
Yury Orlov
4.7 (226)
Dies ist ein Indikator für MT4, der genaue Signale für den Einstieg in einen Handel ohne Repainting (Neuzeichnen) liefert. Er kann auf alle Finanzwerte angewendet werden: Forex, Kryptowährungen, Metalle, Aktien, Indizes. Er liefert ziemlich genaue Schätzungen und sagt Ihnen, wann es am besten ist, eine Position zu eröffnen und zu schließen. Sehen Sie sich das Video (6:22) mit einem Beispiel für die Verarbeitung nur eines Signals an, das sich für den Indikator gelohnt hat! Die meisten Händler ver
Der Forex TPA Indikator deckt die wahren Aktionen der Marktmacher auf, immer dann wenn sie passieren. "Kämpfe nicht gegen die Marktmacher an, sondern folge ihnen", ist wohl der beste Rat, den ein Trader bekommen kann. Der TPA Indikator zeigt jedesmal seine Signale an wenn die Bullen definitiv stärker sind als die Bären und umgekehrt. Dieser Indikator wurde VON Tradern FÜR Trader gemacht und ist 100% NICHT NACHZEICHNEND! Signale werden STRENG am Schluss einer Kerze  generiert. Das sagen unsere Ku
Currency Strength Exotics
Bernhard Schweigert
4.88 (33)
Stärke von 8 Währungen plus EIN EXOTISCHES Paar oder Rohstoffe oder Indexe! Jedes Produkt kann als 9. Linie hinzugefügt werden. Fügen Sie Rohstoffe, Indexes oder exotische Währungen hinzu (Gold, Silber, Öl, DAX, US30, MXN, TRY, CNH ...). Eine neue noch nie dagewesene TRADING STRATEGIE  !!! Dieser Indikator ist einzigartig, weil wir eine Reihe von proprietäre Funktionen und neue Formeln eingebaut haben. Es funktioniert für alle Zeitrahmen. Basierend auf neuen zugrunde liegenden Algorithmen ist
Der Indikator zeigt die am besten geeigneten Einstiegs- und Ausstiegspunkte an. Er zeigt auch statistische Daten zu allen Signalen an, um den Handel besser analysieren zu können. Mit Hilfe dieses Indikators werden Sie den Markt besser verstehen können. Sobald sich die Kraft des Trends abzuschwächen beginnt (dies wird auf dem Panel angezeigt), bewegt sich die Trendlinie in die Horizontale - dies ist das Signal zum Ausstieg aus dem Handel. Oder Sie können aussteigen, wenn das durchschnittliche
RelicusRoad Pro
Relicus LLC
4.73 (141)
Jetzt 147 US -Dollar (nach ein paar Aktualisierungen auf 499 US -Dollar) - Unbegrenzte Konten (PCs oder MACs) RelicusRoad Benutzerhandbuch + Schulungsvideos + Zugang zur privaten Discord-Gruppe + VIP-Status EINE NEUE ART, DEN MARKT ZU BETRACHTEN RelicusRoad ist der weltweit leistungsstärkste Handelsindikator für Forex, Futures, Kryptowährungen, Aktien und Indizes und gibt Händlern alle Informationen und Tools, die sie benötigen, um profitabel zu bleiben. Wir bieten technische Analysen un
Wir stellen vor       Quantum Trend Sniper Indicator   , der bahnbrechende MQL5-Indikator, der die Art und Weise, wie Sie Trendumkehrungen erkennen und handeln, verändert! Entwickelt von einem Team erfahrener Händler mit über 13 Jahren Handelserfahrung,       Quantum Trend Sniper-Indikator       wurde entwickelt, um Ihre Trading-Reise mit seiner innovativen Methode zur Identifizierung von Trendumkehrungen mit extrem hoher Genauigkeit auf ein neues Niveau zu heben. ***Kaufe Quantum Trend Snipe
FX Volume
Daniel Stein
4.61 (36)
Erhalten Sie Ihr tägliches Marktupdate mit Details und Screenshots über unser Morning Briefing hier auf mql5 und auf Telegram ! FX Volume ist der ERSTE und EINZIGE Volumenindikator, der einen ECHTEN Einblick in die Marktstimmung aus Sicht eines Brokers bietet. Es bietet fantastische Einblicke in die Positionierung von institutionellen Marktteilnehmern, wie z.B. Brokern, auf dem Forex-Markt, viel schneller als COT-Berichte. Diese Informationen direkt auf Ihrem Chart zu sehen, ist der wahre Game
XQ Indicator MetaTrader 4
Marzena Maria Szmit
3.67 (3)
Step into the realm of Forex trading with confidence and precision using XQ, a cutting-edge Forex indicator designed to elevate your trading game to unprecedented heights. Whether you're a seasoned trader or just stepping into the world of currency exchange,   XQ Forex Indicator   empowers you with the insights and signals needed to make informed trading decisions. The signal conditions are a combination of three indicators, and XQ Forex Indicator only display  medium and long-term trends . The
Gann Time Clusters
Martin Eshleman
2.5 (2)
Gann Time Clusters Indicator This indicator is based on W. D. Gann's Square of 9 method for the time axis. It uses past market reversal points and applies the mathematical formula for Gann's Square of 9 and then makes projections into the future. A date/time where future projections line up is called a 'time cluster'. These time clusters are drawn as vertical lines on the right side of the chart where the market has not advanced to yet. A time cluster will result in a market reversal point (ex.
Ultimate Sniper Dashboard
Hispraise Chinedum Abraham
4.85 (27)
Ermäßigt auf $299! Die Preise können in Zukunft steigen! Lesen Sie die Beschreibung unten! Bestes Einstiegssystem für Ultimate Sniper Dashboard: ULTIMATIVE DYNAMISCHE EBENEN. (Bitte überprüfen Sie meine Produkte) Das Ultimate Sniper Dashboard funktioniert NUR auf Live-Märkten aufgrund der MT4 Multicurrency Testlimits. Wir stellen Ihnen das Ultimate-Sniper Dashboard vor! Unser bestes, das sowohl HA-Sniper, MA-Sniper und viele spezielle Modi enthält. Das Ultimate Sniper Dashboard ist ein
Indicator : RealValueIndicator Description : RealValueIndicator is a powerful tool designed specifically for trading on the EURUSD pair. This indicator analyzes all EUR and USD pairs, calculates their real currency strength values, and displays them as a single realistic value to give you a head start on price. This indicator will tell you moves before they happen if you use it right. RealValueIndicator allows you to get a quick and accurate overview of the EURUSD currency pair tops and bottoms,
Gioteen Volatility Index (GVI)   - your ultimate solution to overcoming market unpredictability and maximizing trading opportunities. This revolutionary indicator helps you in lowering your losing trades due to choppy market movements. The GVI is designed to measure market volatility, providing you with valuable insights to identify the most favorable trading prospects. Its intuitive interface consists of a dynamic red line representing the volatility index, accompanied by blue line that indicat
GOLD Impulse with Alert
Bernhard Schweigert
4.56 (9)
Dieser Indikator ist eine hervorragende Kombination aus unseren 2 Produkten Advanced Currency IMPULSE with ALERT  +   Currency Strength Exotics . Es funktioniert für alle Zeitrahmen und zeigt grafisch Impulse der Stärke oder Schwäche für die 8 wichtigsten Währungen plus ein Symbol! Dieser Indikator ist darauf spezialisiert, die Beschleunigung der Währungsstärke für beliebige Symbole wie Gold, Exotische Paare, Rohstoffe, Indizes oder Futures anzuzeigen. Als erster seiner Art kann jedes Sym
Cycle Sniper
Elmira Memish
4.41 (39)
NEW YEAR SALE PRICE FOR LIMITED TIME!!! Please contact us after your purchase and we will send you the complimentary indicators to complete the system Cycle Sniper is not a holy grail but when you use it in a system which is explained in the videos, you will feel the difference. If you are not willing to focus on the charts designed with Cycle Sniper and other free tools we provide, we recommend not buying this indicator. We recommend watching the videos about the indiactor and system before pu
Best Currency Strength Indicator
Tumelo Patrick Rakotsoane
4.6 (48)
Advanced Currency Strength Indicator The Advanced Divergence Currency Strength Indicator. Not only it breaks down all 28 forex currency pairs and calculates the strength of individual currencies across all timeframes , but, You'll be analyzing the WHOLE forex market in 1 window (In just 1 minute) . This indicator is very powerful because it reveals the true movements of the market.  It is highly recommended to  analyze charts knowing the performance of individual currencies or the countries ec
How to use Pair Trading Station Pair Trading Station is recommended for H1 time frame and you can use it for any currency pairs. To generate buy and sell signal, follow few steps below to apply Pair Trading Station to your MetaTrader terminal. When you load Pair Trading Station on your chart, Pair Trading station will assess available historical data in your MetaTrader platforms for each currency pair. On your chart, the amount of historical data available will be displayed for each currency pai
Weitere Produkte dieses Autors
Das Volatility Trend System ist ein Handelssystem, das Signale für Einstiege liefert. Das Volatilitätssystem liefert lineare und punktuelle Signale in Richtung des Trends sowie Signale zum Verlassen des Trends, ohne Neuzeichnung oder Verzögerungen. Der Trendindikator überwacht die Richtung des mittelfristigen Trends, zeigt die Richtung und deren Änderung an. Der Signalindikator basiert auf Änderungen der Volatilität und zeigt Markteintritte an. Der Indikator ist mit mehreren Arten von Warn
Volatility Trend System – ein Handelssystem, das Signale für Einstiege gibt. Das Volatilitätssystem liefert lineare und punktuelle Signale in Richtung des Trends sowie Signale zum Verlassen des Trends, ohne Neuzeichnung und Verzögerungen. Der Trendindikator überwacht die Richtung des mittelfristigen Trends, zeigt die Richtung und deren Änderung an. Der Signalindikator basiert auf Änderungen der Volatilität und zeigt Markteintritte an. Der Indikator ist mit mehreren Arten von Warnungen ausgest
Der Indikator „ ZigZag on Trend “ ist ein Assistent zur Bestimmung der Richtung der Preisbewegung sowie ein Balken- und Pip-Rechner. Es besteht aus einem Trendindikator, der die Richtung des Preises anhand einer Trendlinie in Form eines Zickzacks überwacht, und einem Zähler, der die Anzahl der in Trendrichtung durchlaufenen Balken und die Anzahl der Punkte auf einer vertikalen Skala berechnet. (Berechnungen werden bei der Eröffnung des Balkens durchgeführt) Der Indikator wird nicht neu gezeichne
Eine Reihe von Indikatoren, die Wendepunkte erkennen. Erkennt Höchst- und Tiefststände von Candlestick-Kombinationen, nachdem sie von zwei MAs abgezogen wurden. Gilt für Handelssysteme bei Verwendung von Early Entrys. Kann entlang des Trends für Scalping und Intraday-Handel sowie zur frühzeitigen Erkennung von Trendumkehrungen verwendet werden. Möglichkeiten Die Parameter bieten flexible Einstellungen für beliebige Zeitrahmen und Handelsinstrumente. Es gibt verschiedene Arten von Alarmen
Candle Binary Scalper ist ein technisches Analyseprodukt für Devisen und binäre Optionen. Enthält mehrere technische Indikatoren, die in einem Handelssystem zusammengefasst sind. Geeignet für den manuellen Handel innerhalb eines Trends, für Scalping und binäre Optionen. Funktioniert für alle Zeitrahmen und Handelsinstrumente. Empfohlene Zeitrahmen für den Handel M15, M30, H1 und H4, M5 und M1 sollten bei hoher Volatilität verwendet werden. Es gibt verschiedene Arten von Warnungen. So verwe
Indikator für manuellen Handel und technische Analyse für Forex. Es besteht aus einem Trendindikator mit dem Eröffnungsniveau des Handelstages und einem Pfeilindikator zur Bestimmung von Einstiegspunkten. Der Indikator ändert seine Farbe nicht; er funktioniert, wenn die Kerze schließt. Enthält verschiedene Arten von Warnungen für Signalpfeile. Kann für die Arbeit mit jedem Diagramm, Handelsinstrument oder Zeitrahmen konfiguriert werden. Die Arbeitsstrategie basiert auf der Suche nach Pr
Scalping and Binary Signal Detector – Scalping-Indikator, der Richtungssignale für Eröffnungspositionen entlang des Trends liefert. Der Indikator ist ein vollständiges Handelssystem, das für Forex und binäre Optionen verwendet werden kann. Das Algorithmensystem ermöglicht es Ihnen, starke Preisbewegungen in mehreren aufeinanderfolgenden Balken zu erkennen. Der Indikator bietet verschiedene Arten von Warnungen für Pfeile. Funktioniert mit allen Handelsinstrumenten und Zeitrahmen (M5 oder höhe
Wave Reversal Indicator - determines the direction of trend waves and price reversals. The indicator shows wave movements and trend directions. It gives recommendations where to follow the trader, helps to follow the trading strategy. It is an addition to an intraday or medium-term strategy. Almost all parameters are selected for each time frame and are changed automatically, the only parameter for manual adjustment is the wavelength. Works on various trading instruments and timeframes, rec
FREE
Eine Reihe von Indikatoren, die Wendepunkte erkennen. Erkennt Höchst- und Tiefststände von Candlestick-Kombinationen, nachdem sie von zwei MAs abgezogen wurden. Gilt für Handelssysteme bei Verwendung von Early Entrys. Kann entlang des Trends für Scalping und Intraday-Handel sowie zur frühzeitigen Erkennung von Trendumkehrungen verwendet werden. Möglichkeiten Die Parameter bieten flexible Einstellungen für beliebige Zeitrahmen und Handelsinstrumente. Es gibt verschiedene Arten von Alarmen
Das technische Handelssystem von BB Reverse Arrows wurde entwickelt, um umgekehrte Punkte für Einzelhandelsentscheidungen vorherzusagen. Die aktuelle Marktsituation wird durch den Indikator analysiert und für mehrere Kriterien strukturiert: die Erwartung von Umkehrmomenten, potenziellen Wendepunkten, Kauf- und Verkaufssignalen. Der Indikator enthält keine überschüssigen Informationen, verfügt über eine visuelle verständliche Schnittstelle, mit der Händler angemessene Entscheidungen treffen k
Zyklischer Indikator für den Handel und die Prognose der Marktrichtung. Zeigt das zyklische Verhalten des Preises in Form eines Oszillators. Gibt Signale für die Eröffnung von Trades aus, wenn es eine Erholung von der Ober- und Untergrenze des Oszillators gibt. In Form eines Histogramms zeigt es die geglättete Stärke des Trends.  Ergänzt jede Handelsstrategie, vom Scalping bis zum Intraday.  Der Indikator wird nicht neu gezeichnet.  Geeignet für den Einsatz auf allen Symbolen/Instrumenten.  
Scalping Entry Points - ist ein manuelles Handelssystem, das sich an Preisbewegungen anpassen und Signale für offene Geschäfte ohne Neuzeichnung geben kann. Der Indikator bestimmt die Richtung des Trends anhand des zentralen Unterstützungs- und Widerstandsniveaus. Der Punktindikator liefert Signale für Ein- und Ausstiege. Geeignet für manuellen Intraday-Handel, Scalping und binäre Optionen. Funktioniert für alle Zeitrahmen und Handelsinstrumente. Der Indikator gibt verschiedene Arten von Warnun
Candle Power Signals ist ein Trendindikator, der eine Strategie zur Suche nach potenziell volatilen Signalen verwendet, um Handelsentscheidungen zu treffen. Durch die Analyse des Marktes identifiziert der Indikator Zonen mit erhöhter und verringerter Volatilität innerhalb der Richtungstrendbewegung. Die wichtigsten Signalerzeugungsparameter wurden bereits konfiguriert, die restlichen Einstellungen und Zeiträume sind in 2 Parametern zur manuellen Konfiguration indiziert: 1. "Candle calculati
Level Breakout Indicator ist ein technisches Analyseprodukt, das anhand oberer und unterer Grenzen arbeitet und die Richtung des Trends bestimmen kann. Funktioniert bei Kerze 0 ohne Neuzeichnen oder Verzögerungen. Bei seiner Arbeit verwendet es ein System verschiedener Indikatoren, deren Parameter bereits konfiguriert und zu einem einzigen Parameter zusammengefasst wurden – „ Scale “, der die Abstufung der Perioden vornimmt. Der Indikator ist einfach zu verwenden und erfordert keine Berechnung
Max Min Reversal Arrows MT5 - an arrow reversal indicator for predicting price movement. The indicator is built on the support and resistance levels at the local lows and highs of the price. Product features Arrows appear on the current candle. The indicator does not redraw. Can be used on all time frames and trading instruments. Recommended timeframes to use M30, H1, H4. The dotted lines are the support and resistance levels within the signal. Price movement from these levels means a reve
Indikator des Preiskanals und des darin enthaltenen Breakpoint-Generators. Es gibt einen Eindruck von der Lage des Preises im Verhältnis zur Nutzungsdauer. Es enthält geglättete Trend-Absprunglinien entlang der Kanalgrenzen und Absprungpunkte, die den Ein- und Ausstiegszeitpunkt bestimmen. Funktioniert mit verschiedenen Handelsinstrumenten und Zeitrahmen. So arbeiten Sie mit dem Indikator Folgen Sie der Kanalunterbrechungslinie. Die blaue Linie zeigt die oberen Eingänge, die rosa Linie di
A trend indicator showing the strength of bulls and bears in a trading range. Consists of two lines: The green line is a balanced overbought/oversold condition. The red line is the direction of trading activity. Does not redraw calculations. Can be used on all Symbols/Instruments/Time Frames. Easy to use and set up. How to use the indicator and what it determines. The basic rule is to follow the direction of the red line: if it crosses the green line from the bottom up, the market i
FREE
Smoothed oscillator based on basic DeMarker indicators. Shows the volatility of the price direction. Can be used to determine intraday entry and exit points from the market. Suitable for use on all time frames and trading instruments. It is recommended to use on M5, M15 and M30. The green line shows the price direction up, the blue line shows the price direction down. The red line is a smoothed representation of the price. Input parameters      Period - Period of the main indicator DeMarker
FREE
Zig-Zag indicator with additional signals for inputs. Visually easy to use: The red zig-zag line is an uptrend. The blue zig-zag line is a downward trend. Arrows in the form of additional signals. Works on any trading pairs. On any timeframe. Not redrawn. Input parameters Zig-Zag Period - Zig-zag period (from 5) Signal Period - period of signal arrows (from 3) Alerts for signals Play sound - Sound alert Display pop-up message - Notification by message on the screen Send push not
FREE
Lines Channel Pro
Vitalyi Belyh
5 (1)
The "Lines Channel Pro" indicator determines price reversals from the High/Low channel. Contains a built-in trend finder, signal lines, entry and exit points. The recommended timeframe for M15 to work is D1. For each timeframe and trading instrument, depending on the volatility, it is necessary to select individual settings. Does not redraw calculations. Input parameters Use Channel trend filter - Turn on/off the trend filter Channel trend period - Trend filter period (from 8 and abov
Arrow indicator with trend filter. Generates trend input without delays or delays - on the emerging candle. Suitable for use on any trading tools and timeframes. Easy to use, contains the direction of the trend in the form of a histogram lines and signal generator. Input parameters Period Trend Line - Period of the Histogram Line Signal Generator Period - If the period is longer, then the arrows are less Play sound Display pop-up message Send push notification Send email Sound file signal -
An indicator that determines the point levels of price resistance. The arrows indicate price bounces in the indicated directions. Arrows are not redrawn formed on the current candle, shown on the previous candle for convenience.      It has one setting - the formation intensity: If the parameter is smaller, most of the signals are formed in a wide trend. If the parameter is larger, signals are formed in a narrower trend. Input parameters Formation Intensity - Arrow Formation Intensity Num
Channel Cluster
Vitalyi Belyh
5 (2)
Cluster indicator working in the price channel. For operation, the indicator builds a channel line - (dashed line). Inside the channel, cluster sections are determined that determine the direction of the price movement - (histograms in two directions), start with large arrows. Small arrows are plotted above / below each histogram - indicator increase volatility. The indicator does not redraw the values. Works on any tools and timeframes. Entrances are made when large arrows appear, inside s
A technical indicator that calculates its readings based on trading volumes. It has an oscillatory line that follows the change in volumes. Large arrows on the line indicate reversal values. A channel is built around the line with small arrows showing the strengthening of price movement in the direction of increasing volumes. The indicator does not redraw values. Works on any instrument and timeframe. It can complement any trading strategy by finding a trend or make entries in the direction of
Max Min Reversal Arrows - an arrow reversal indicator for predicting price movement. The indicator is built on the support and resistance levels at the local lows and highs of the price. Product features Arrows appear on the current candle. The indicator does not redraw. Can be used on all time frames and trading instruments. Recommended timeframes to use M30, H1, H4. The dotted lines are the support and resistance levels within the signal. Price movement from these levels means a reversal.
Scalping Entry Points - ist ein manuelles Handelssystem, das sich an Preisbewegungen anpassen und Signale für offene Geschäfte ohne Neuzeichnung geben kann. Der Indikator bestimmt die Richtung des Trends anhand des zentralen Unterstützungs- und Widerstandsniveaus. Der Punktindikator liefert Signale für Ein- und Ausstiege. Geeignet für manuellen Intraday-Handel, Scalping und binäre Optionen. Funktioniert für alle Zeitrahmen und Handelsinstrumente. Der Indikator gibt verschiedene Arten von Warnun
Binary Lines ist ein technischer Analyseindikator für Währungen, Rohstoffe, Kryptowährungen, Aktien, Indizes und alle Finanzinstrumente. Kann für binäre Optionen oder Forex-Scalping verwendet werden. Zeigt Ein- und Ausstiegspunkte in festen Abständen an und stellt bereit Händlern die notwendigen Informationen über die Ergebnisse möglicher Transaktionen. Einstiegspunkte werden ganz am Anfang der Kerze in Richtung der MA-Linie und der Dauer gebildet Trades in Bars können manuell angepasst und an j
Ein technischer Indikator, der seine Messwerte anhand des Handelsvolumens berechnet. In Form eines Histogramms zeigt es die Akkumulation der Stärke der Bewegung des Handelsinstruments. Es verfügt über unabhängige Berechnungssysteme für bullische und bärische Richtungen. Funktioniert mit allen Handelsinstrumenten und Zeitrahmen. Kann jedes Handelssystem ergänzen. Der Indikator zeichnet seine Werte nicht neu, die Signale erscheinen auf der aktuellen Kerze. Es ist einfach zu bedienen, lädt das Di
Line Breakouts – System für den Trendhandel. Enthält eine Trendkennung, die mithilfe der Perioden- und Glättungsfunktion an jedes Diagramm und Handelsinstrument angepasst werden kann. Und ein bestimmender Faktor für die Unterstützungs- und Widerstandsniveaus. Wenn der Preis unter der Widerstandslinie liegt, eröffnen Sie Verkaufsgeschäfte, und wenn der Preis über der Unterstützungslinie liegt, eröffnen Sie Kaufgeschäfte. Der Stop-Loss sollte einige Punkte von den Linien entfernt platziert werde
Point Trend Indicator – Ein Indikator für das obere und untere Niveau des Trends, der die Trendrichtung bestimmen und seine Verstärkung anzeigen kann. Die Trendrichtung wird durch runde Punkte bestimmt; liegen die Punkte über der Nulllinie, ist der Trend bullisch, liegen sie darunter, ist der Trend bärisch. Die Zunahme der Richtungsbewegung wird durch Pfeile angezeigt. Es gibt den einzigen Parameter zur manuellen Anpassung – die Dauer der Trendrichtung.   Möglichkeiten Funktioniert in allen
Auswahl:
Keine Bewertungen
Antwort auf eine Rezension