Outside Bar Indicator MT5
- Indikatoren
- Christian Galsterer
- Version: 3.2
- Aktualisiert: 23 August 2024
- Aktivierungen: 5
Aussenstab are important in professional price action trading and were made popular by Michael Voigt. Highs and lows of outside bars (Aussenstäbe) can be utilized as entry and exit for trades following different strategies. Examples for strategies with inside/outside bars are
- Reversal
- Trend continuation
- Breakout
- Ranges
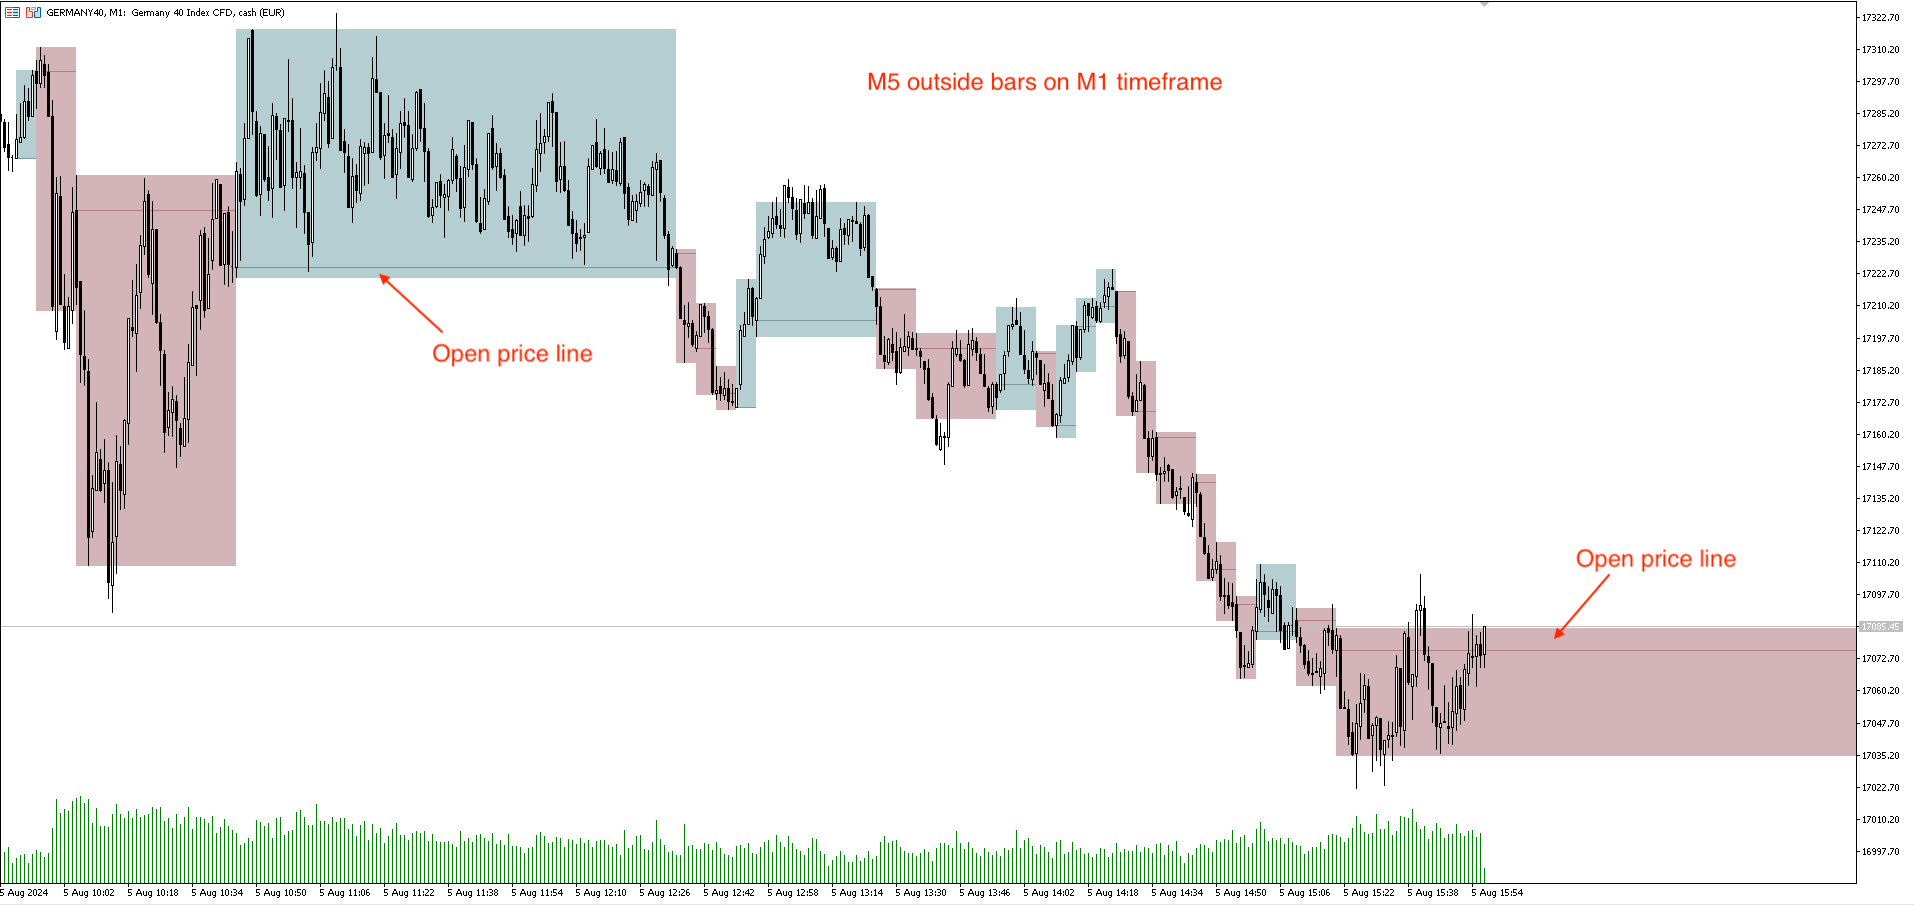
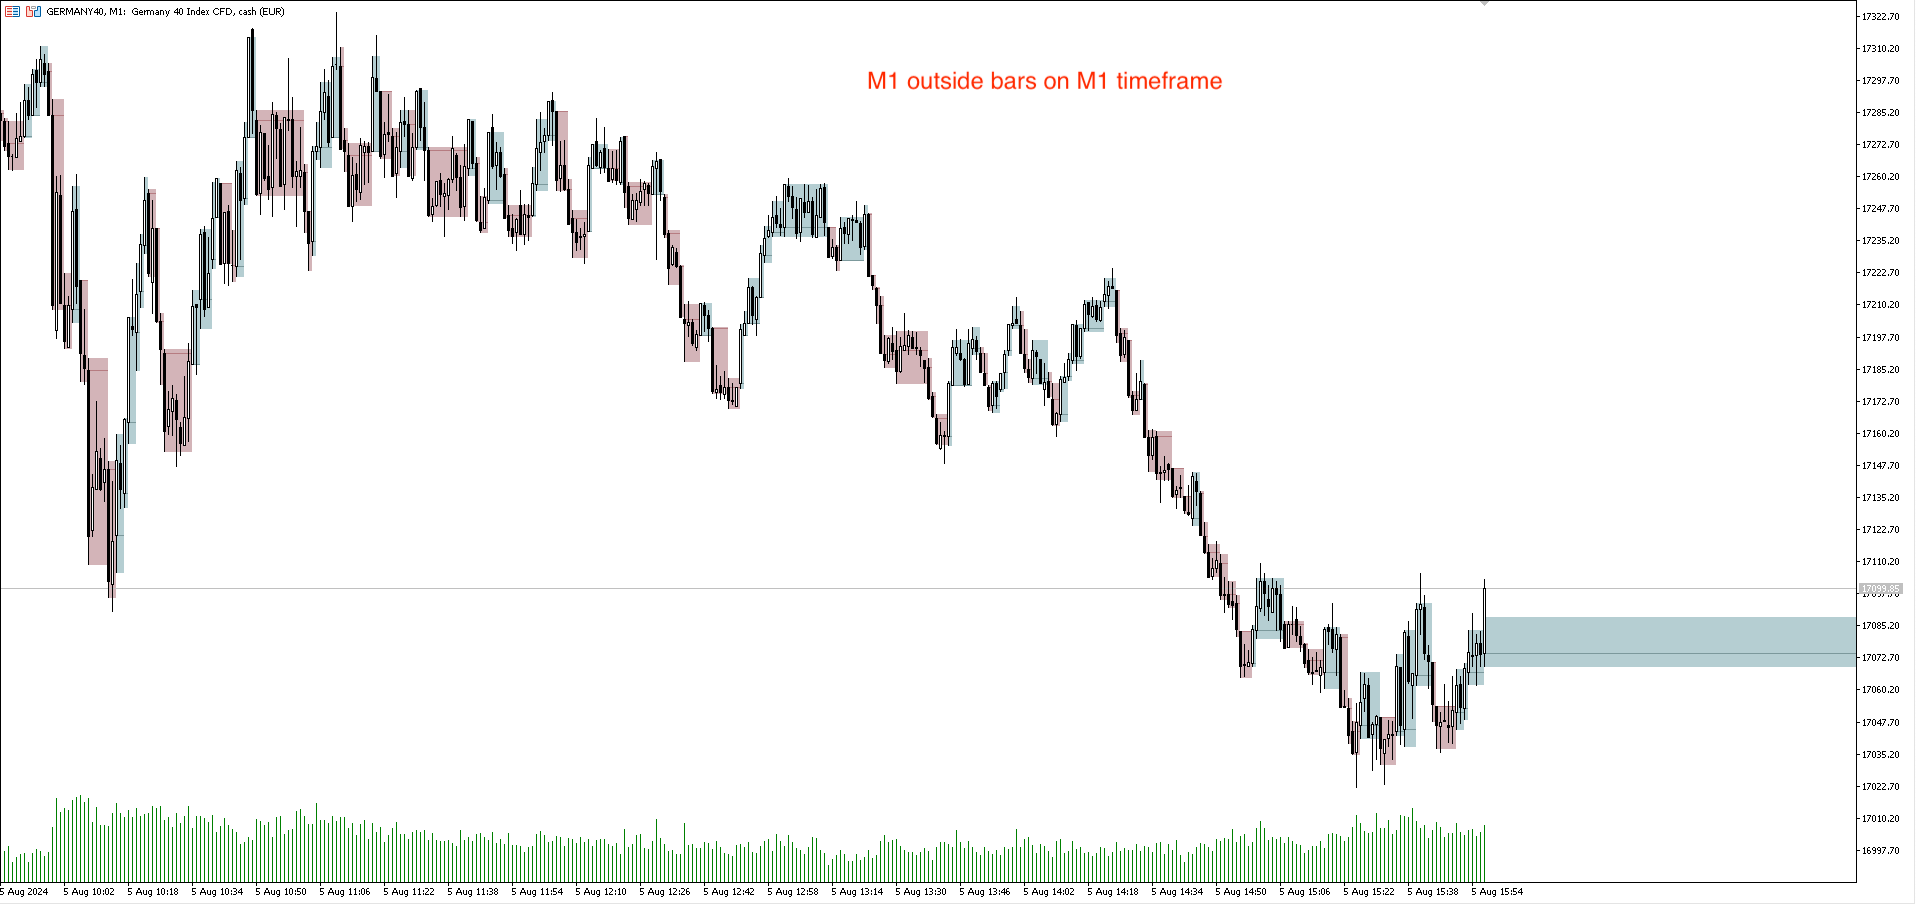
This indicator allows to displays outside bars on the current and configurable higher timeframes. E.g. you can display the M5 outside bars on a M1 timeframe to see the bigger picture without the need to switch between different charts.
Key features:
- Smart timeframes:
- If the configured timeframe is smaller than the chart timeframe, then automatically the chart timeframe is used.
- If the chart time frame is changed back then automatically the configured timeframe is used again
- Configurable timeframes
- Configurable colors
- Tolerance for the open/close price of inside bars
- Display of fibonacci extensions (150% and 161,8%) for the last outside bar.
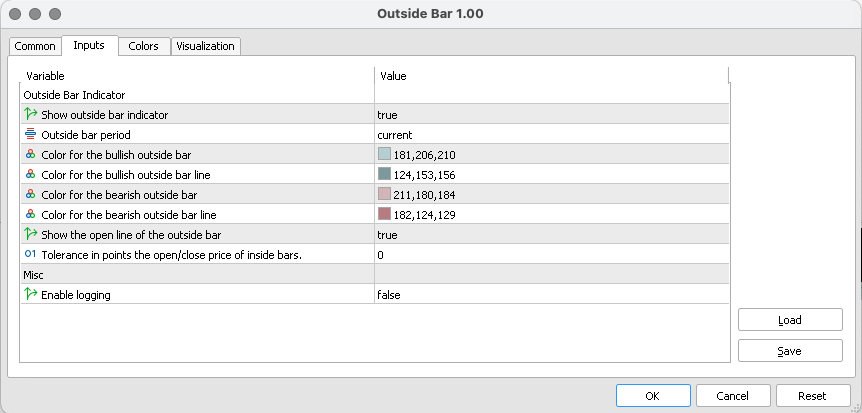
Configuration:
The following configuration options exists:
- Timeframe for the outside bar
- Colors for bullish/bearish outside bars
- Option to display the open line of the outside bar as market often returns to the open line and can be used as entry or exit point into a trade
- Option to display fibonacci extensions for the last outside bar
- Tolerance in points the open/close price of an inside bar can be higher/lower than the outside bar.