Linear regression oscillator with signal
- Indikatoren
- Minh Truong Pham
- Version: 1.0
- Aktivierungen: 5
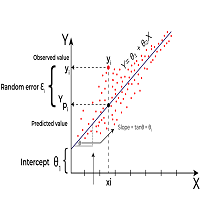
Linear Regression is a statistical method used to model the relationship between two or more variables. The primary goal of Linear Regression is to predict the value of one variable (called the dependent variable or outcome variable) based on the value of one or more other variables (called independent variables or explanatory variables)
Linear Regression can be applied to technical analysis, and it is indeed one of the tools used by traders and analysts to make predictions and identify trends in currency markets. Here are some ways Linear Regression can be applied in Forex analysis:
1. Trend Identification
- Linear Regression can be used to identify the trend of a currency pair over a specific period. By fitting a linear regression line to the price data, traders can determine whether the currency pair is in an uptrend, downtrend, or moving sideways.
2. Price Prediction
- Linear Regression models can help predict future price movements based on historical data. By analyzing past exchange rates and using them to forecast future rates, traders can make informed decisions about when to buy or sell currencies.
3. Support and Resistance Levels
- The linear regression line can also act as a dynamic support or resistance level. Traders may use the regression line to identify potential entry and exit points. When the price is near the regression line, it may act as a support (if the trend is upward) or resistance (if the trend is downward).
4. Indicator Development
- Linear Regression can be used to develop technical indicators. For example, the Linear Regression Channel consists of a regression line and two parallel lines above and below it, representing the standard deviation of the price. This can help traders identify overbought or oversold conditions.
5. Correlation Analysis
- By using multiple linear regression, analysts can study the relationship between different currency pairs or between a currency pair and various economic indicators (e.g., interest rates, inflation rates). This can help in understanding how different factors influence currency prices.
6. Algorithmic Trading
- Linear Regression is a common technique in algorithmic trading strategies. Automated trading systems can use linear regression models to make real-time trading decisions based on statistical analysis of market data.
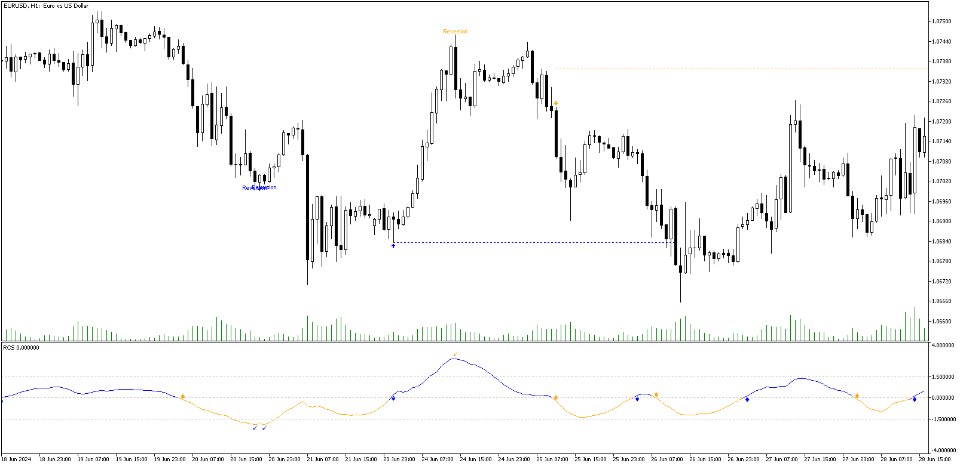
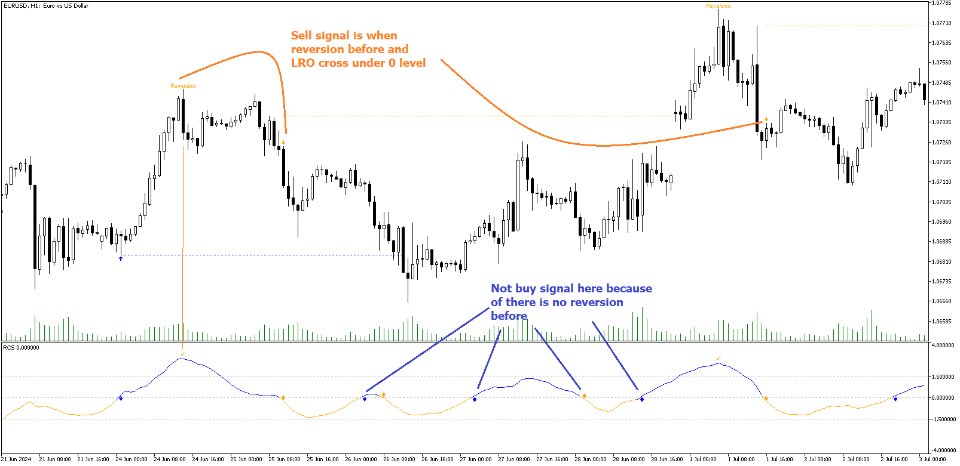
The Linear Regression Oscillator (LRO) is a custom indicator designed to provide insights into potential mean reversion and trend conditions. By calculating a linear regression on the closing prices over a user-defined period, this oscillator helps identify overbought and oversold levels and highlights trend changes. The indicator provide signal sell when LRO overbought before and turn down to cross level 0 and vice versel for buy signa.
Key Features:
◆ Customizable Look-Back Period:
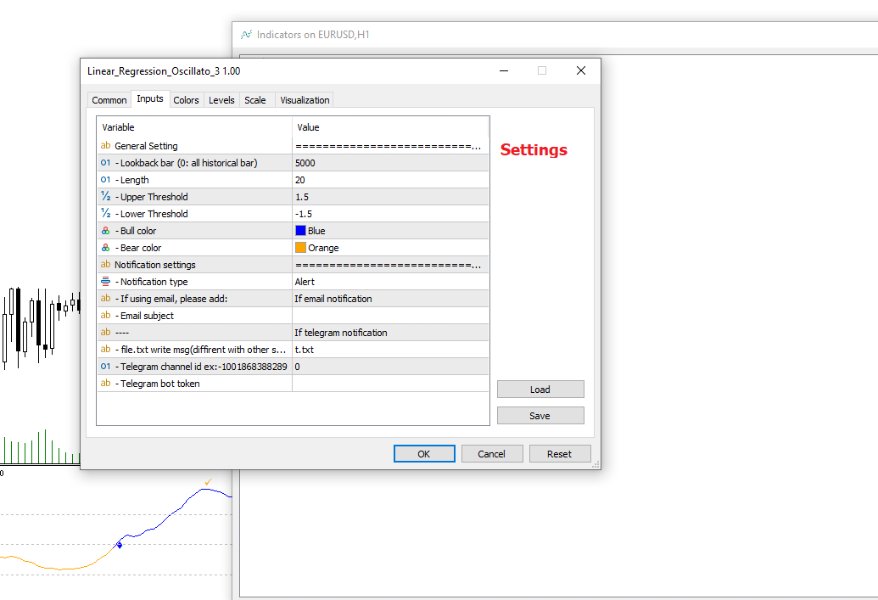
Input: Length
Default: 20
Description: Determines the period over which the linear regression is calculated. A longer period smooths the oscillator but may lag, while a shorter period is more responsive but may be noisier.
◆ Overbought and Oversold Thresholds:
Inputs: Upper Threshold and Lower Threshold
Default: 1.5 and -1.5 respectively
Description: Define the upper and lower bounds for identifying overbought and oversold conditions. Values outside these thresholds suggest potential reversals.
◆ Mean Reversion and Trend Signals:
Visual markers and labels indicate when the oscillator suggests mean reversion or trend changes, aiding in identifying key market turning points.
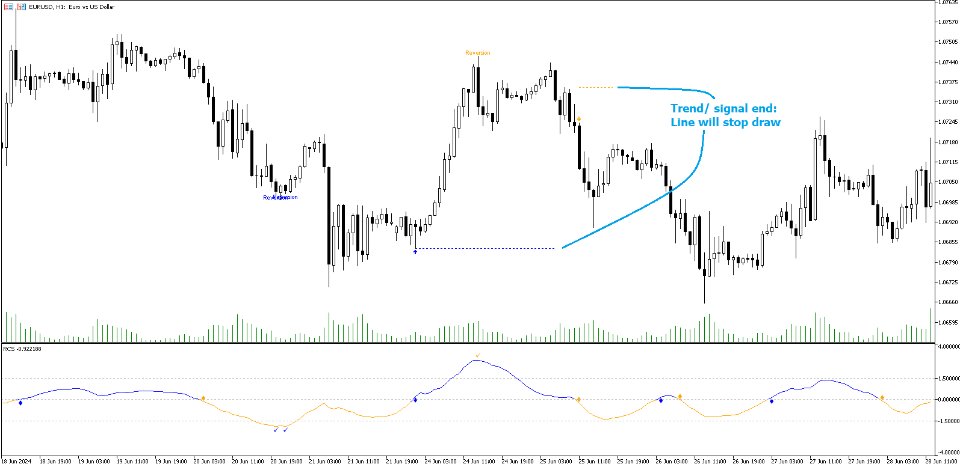
Tracks the highest and lowest prices (as horizontal line) over a recent period to set levels where the current trend signal would be considered invalidated. (fingure 3)
